Published August 2021. Small edits November 2022. Some charts need to updated to include 2021 data.
We have warmed our climate to the temperature range of the Eemian or perhaps just beyond, a period when seas were metres higher. Such impact is beyond adaptation for an organised global civilisation, and yet we continue to carbonise at near record rates.
Since the COVID-19 crisis erupted, many governments may have talked about the importance of building back better for a cleaner future, but many of them are yet to put their money where their mouth is.
Not only is clean energy investment still far from what’s needed to put the world on a path to reaching net-zero emissions by mid-century, it’s not even enough to prevent global emissions from surging to a new record.
Fatih Birol, IEA Executive Director, July 20211.
Our greatest threat
Sea-level rise figures prominently among the consequences of climate change. It impacts settlements and ecosystems both through permanent inundation of the lowest-lying areas and by increasing the frequency and/or severity of storm surge over a much larger region.
Kopp et al. Probabilistic 21st and 22nd century sea-level projections at a global network of tidegauge sites2.
The impacts of multi-metre sea level rise would be irreversible and may leave global civilisation ungovernable3. The world’s coastal cities and ports would be permanently flooded, devastating high population areas, international trade and finance.
The world is “locked in” to 15 to 30 centimetres (6 to 12 inches) of sea level rise by mid-century.
Bob Kopp, Rutgers University4.
Shown below is land area in 2050 projected to be below annual flood level, due to 26cm (10 inches) sea level rise relative to year 2000 (click on maps to enlarge)5.
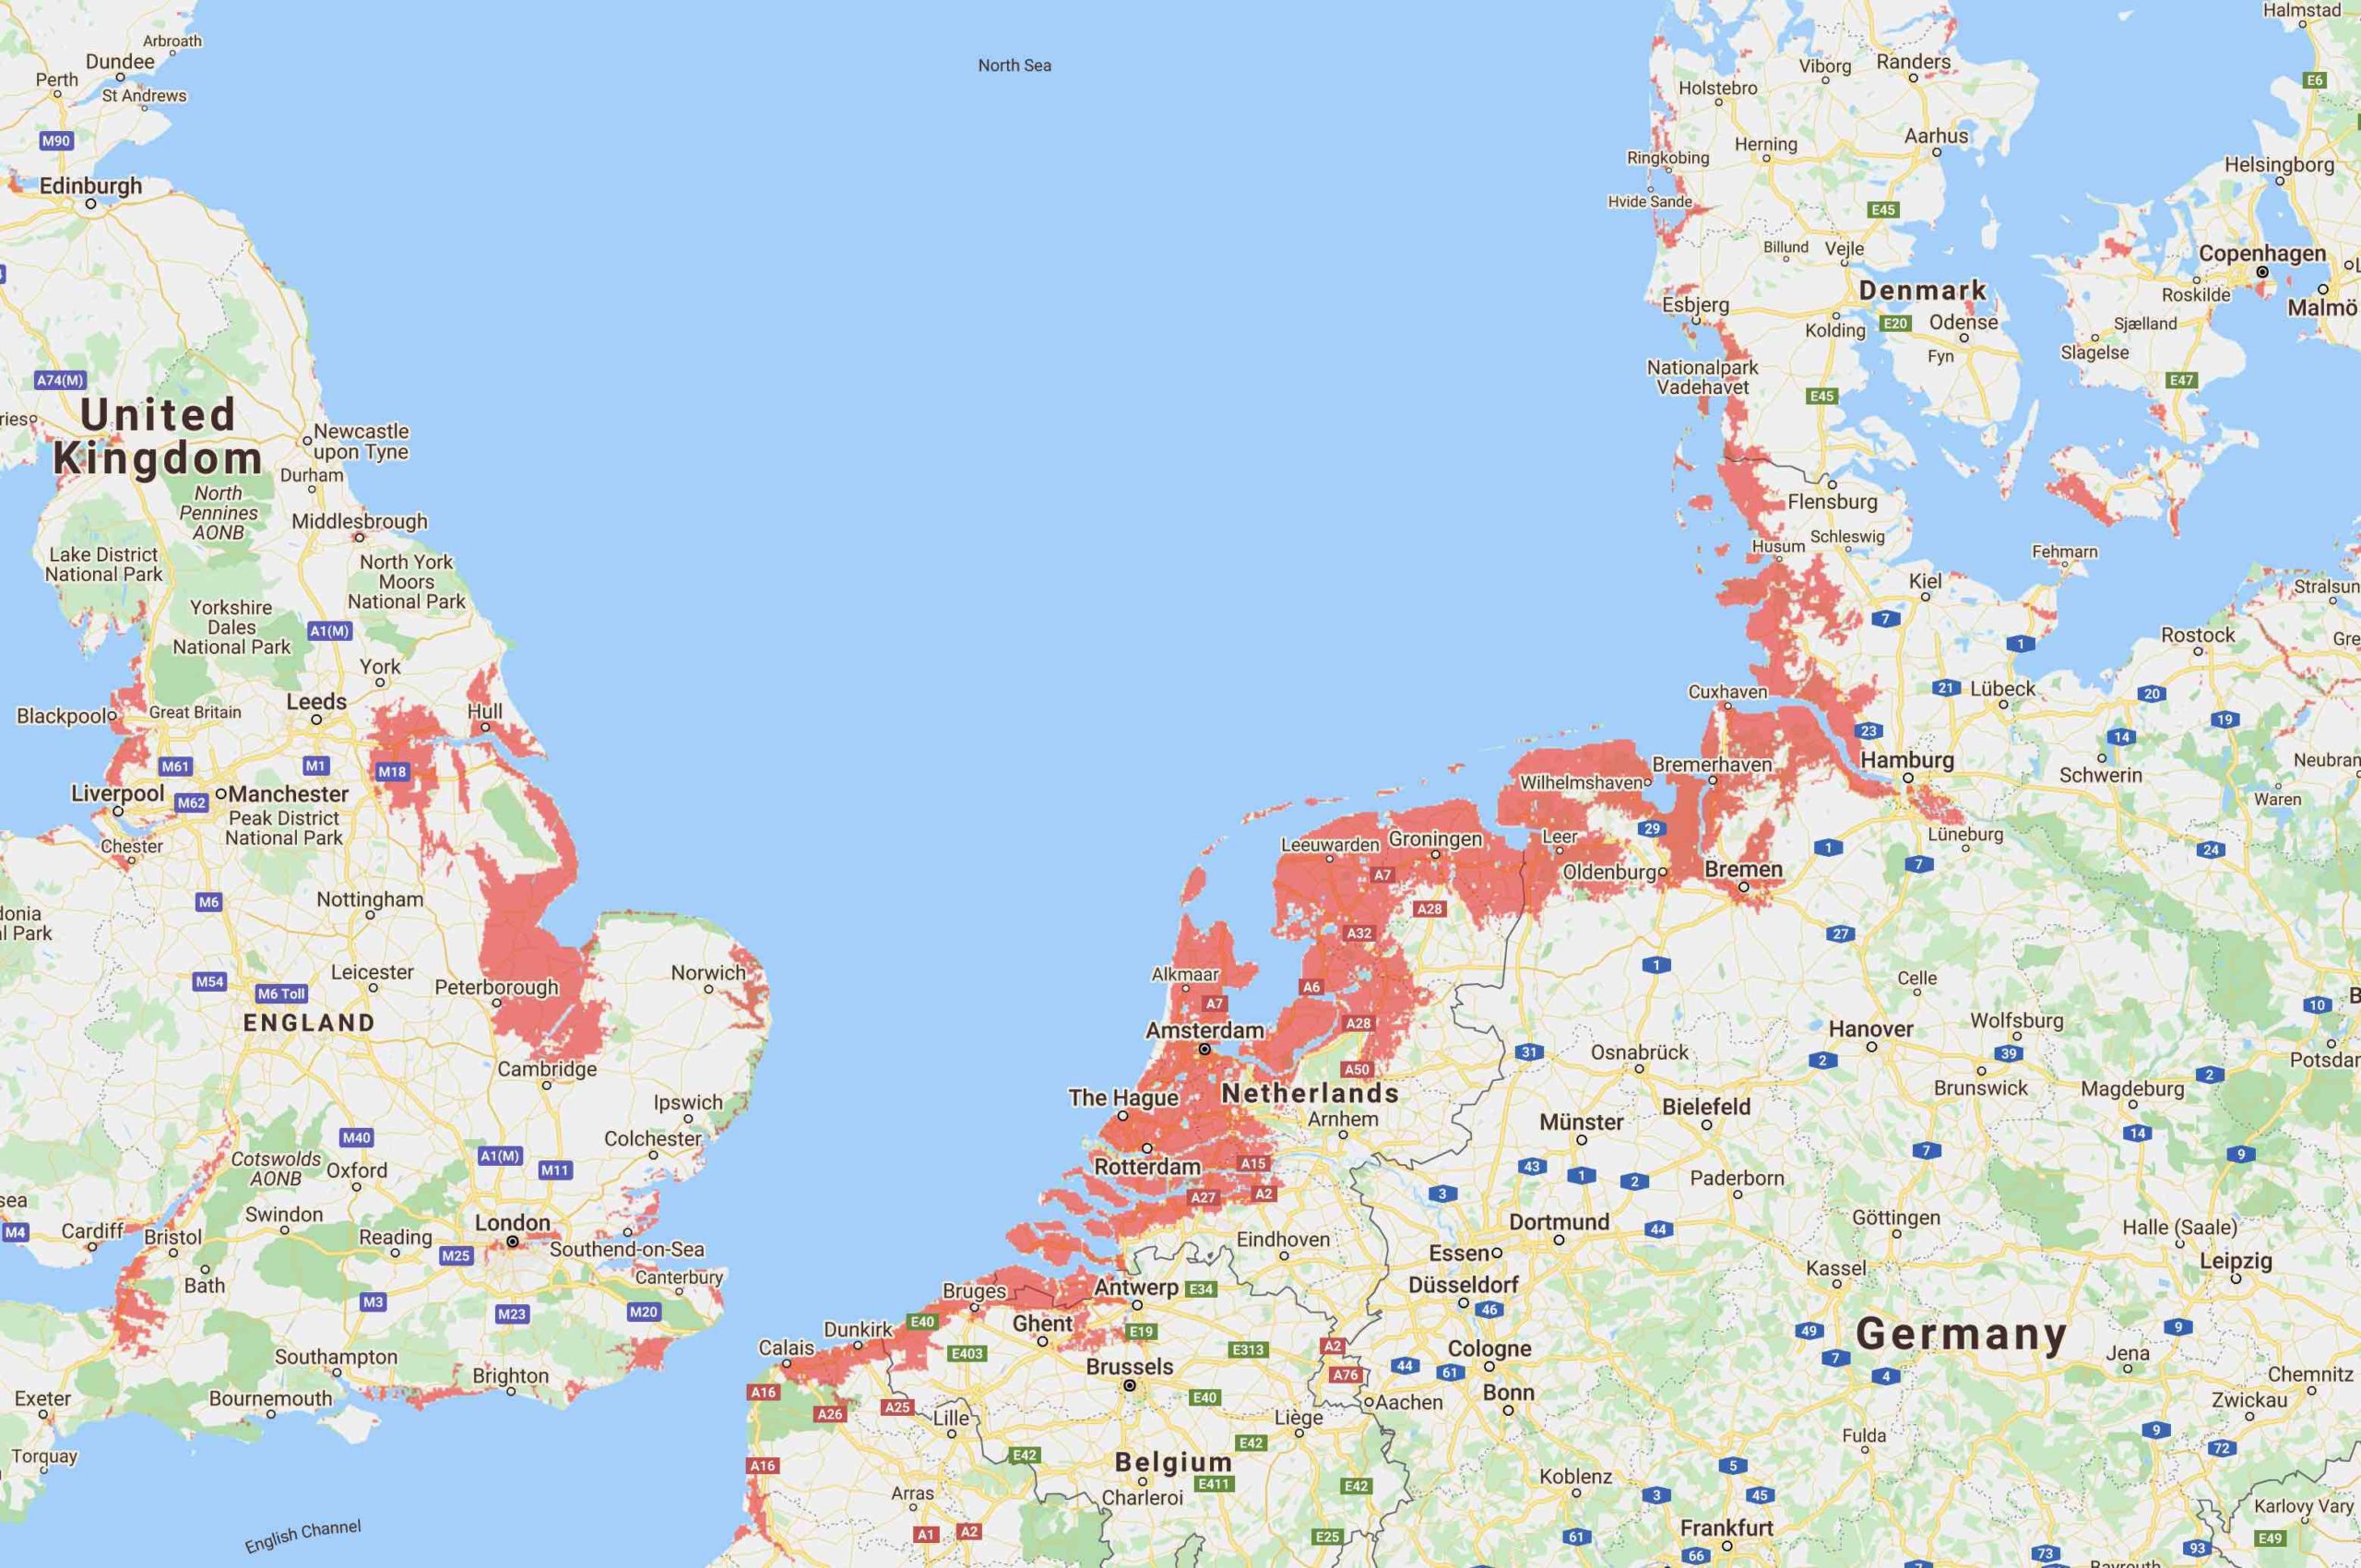
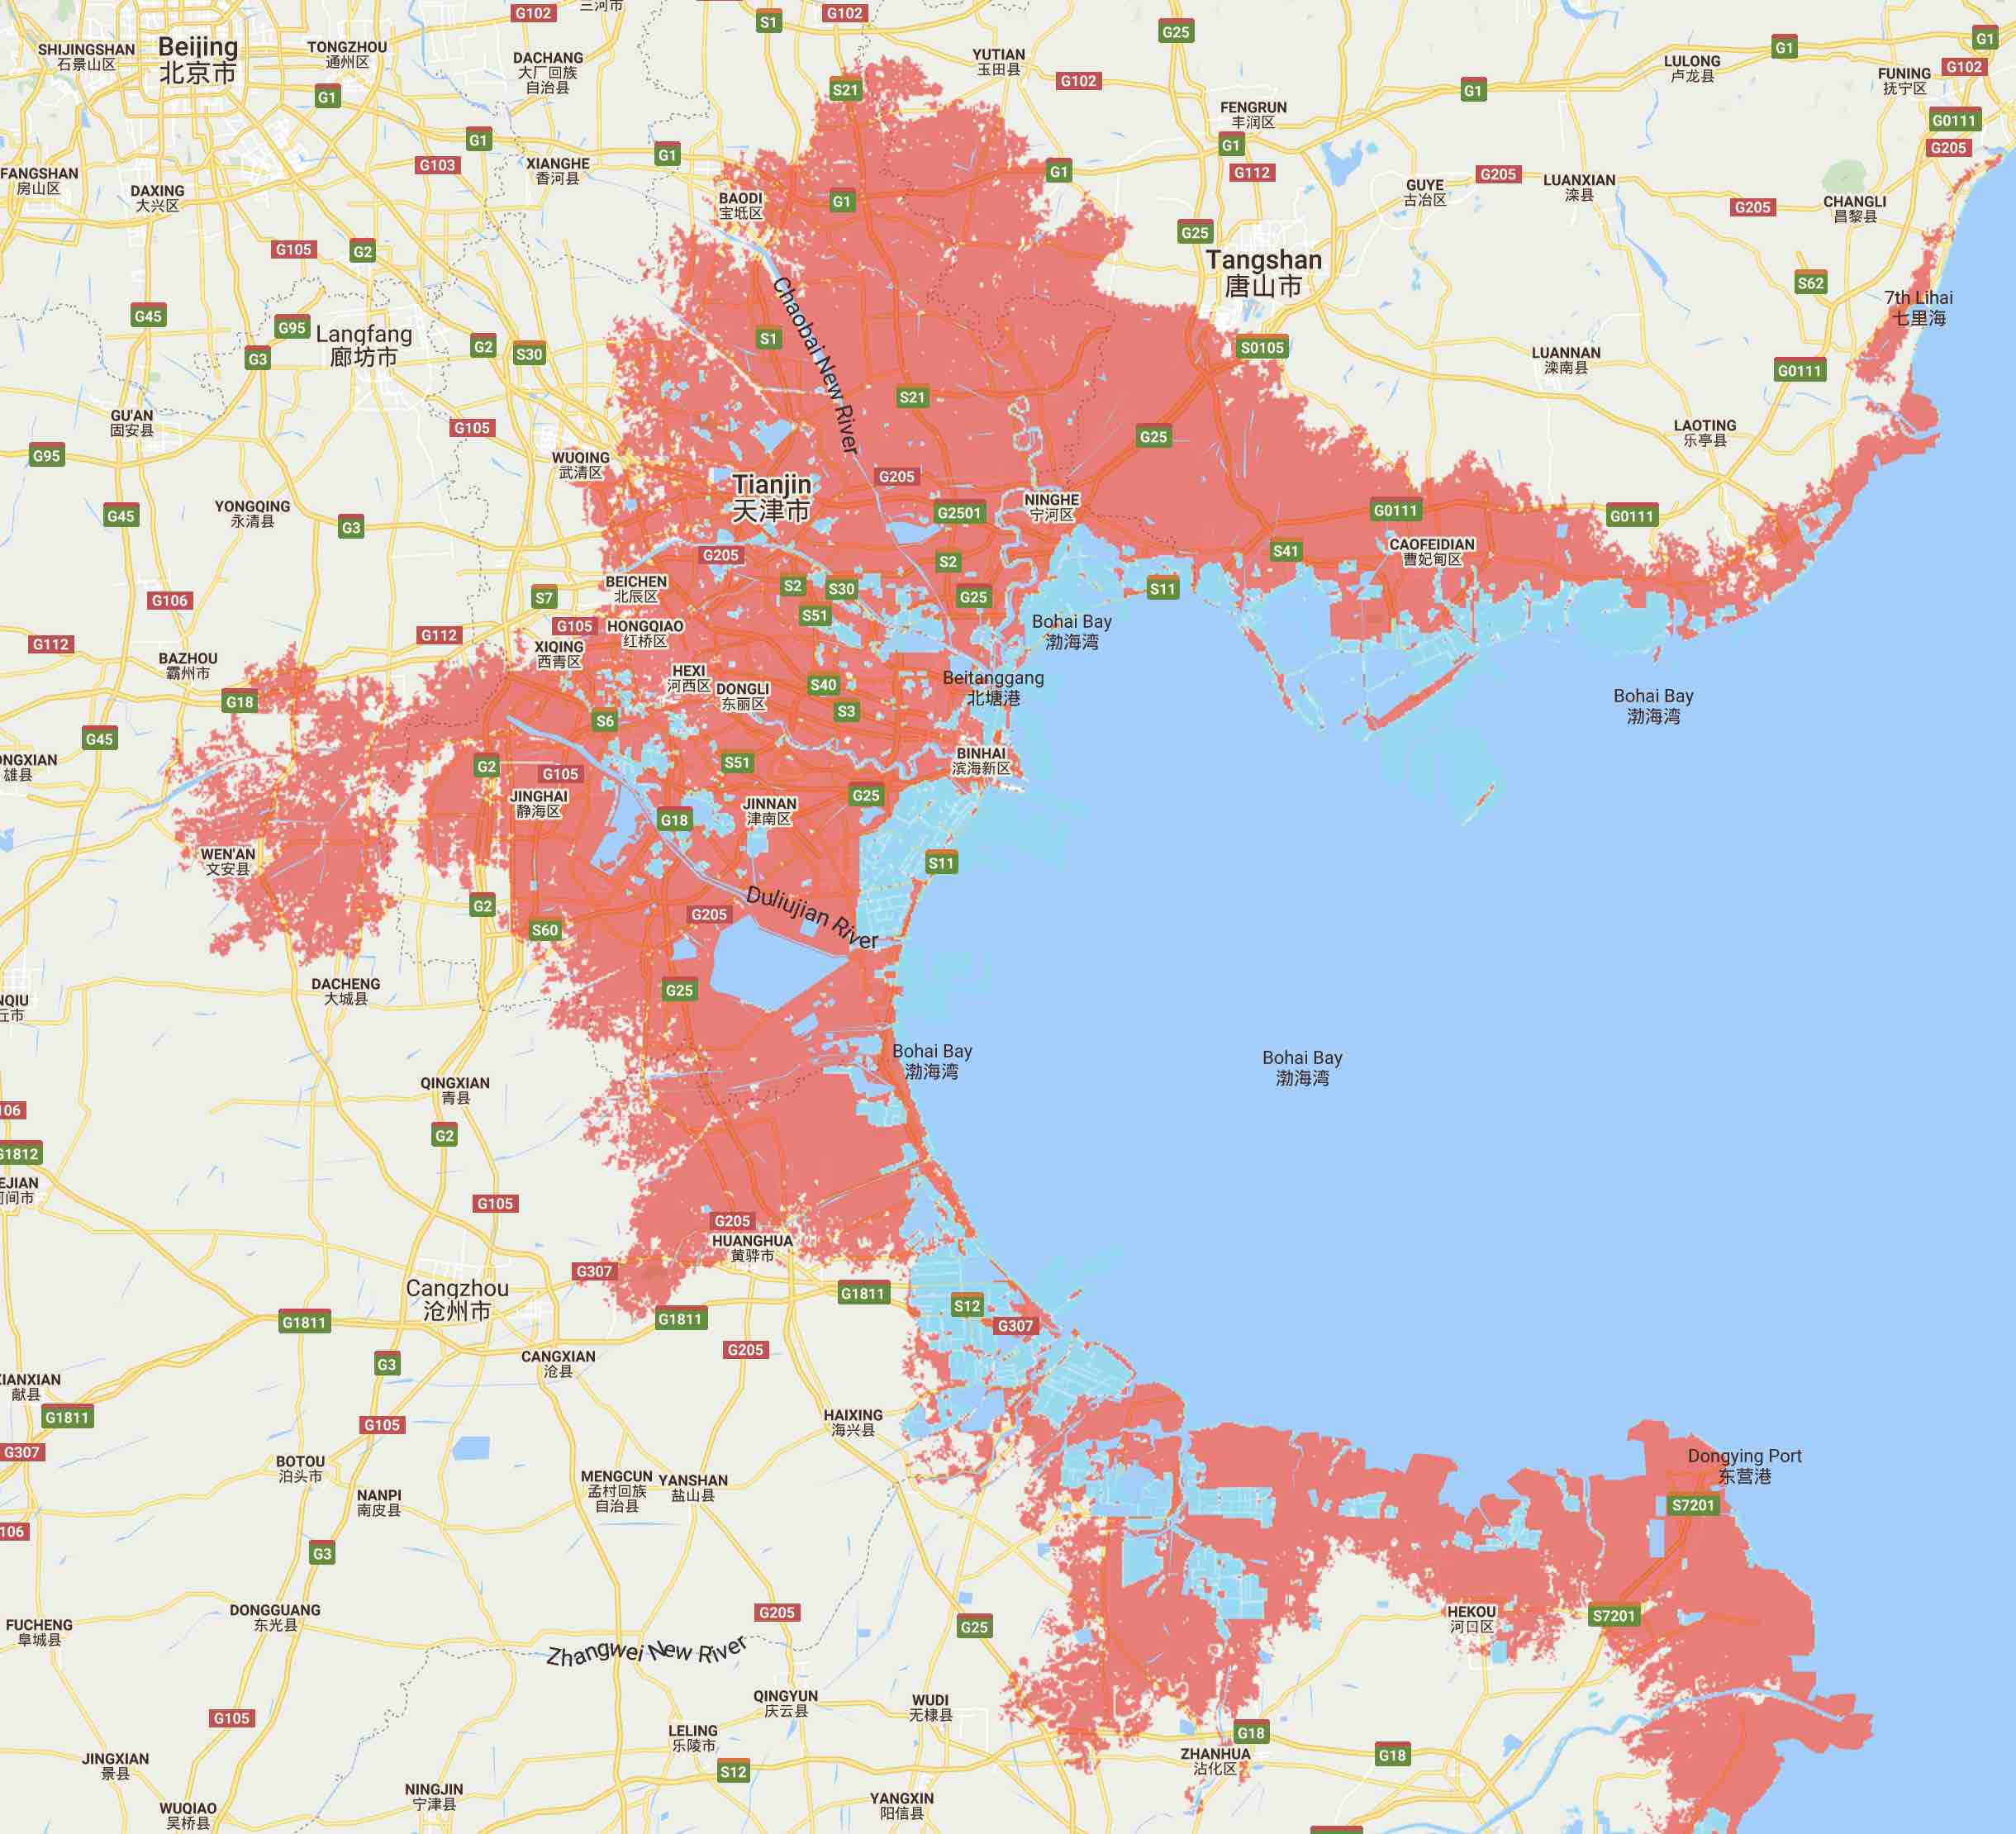
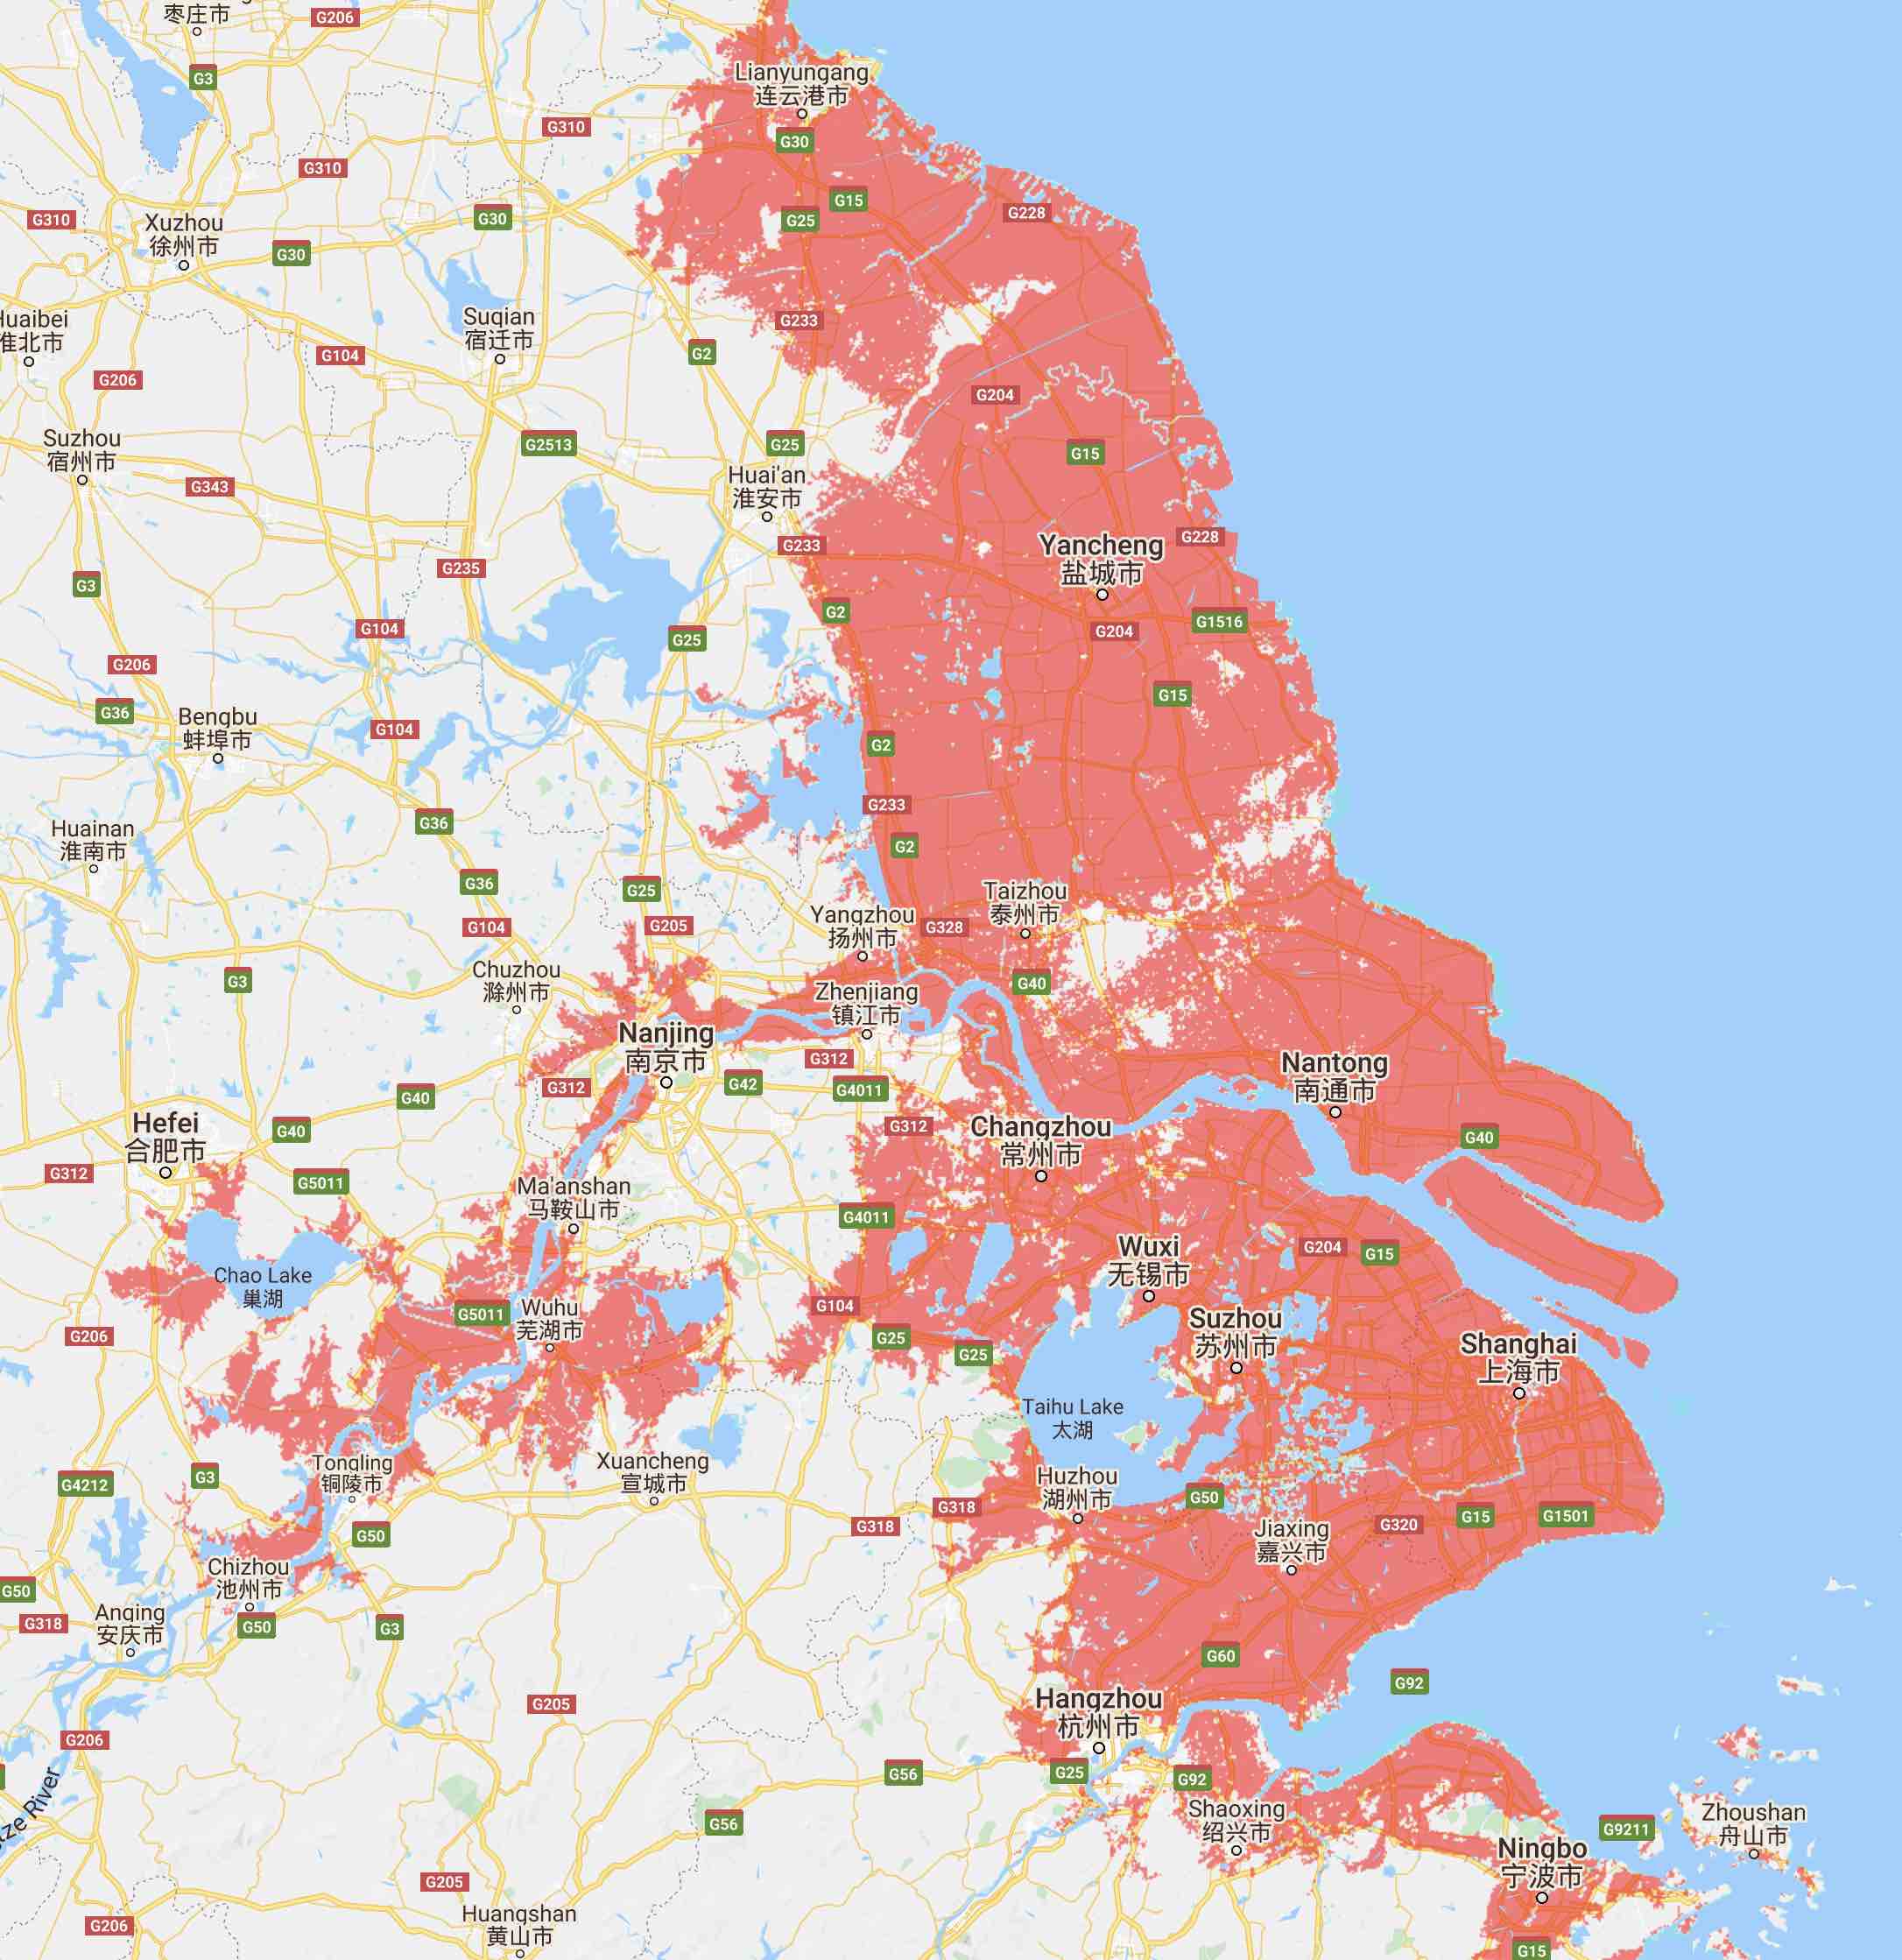
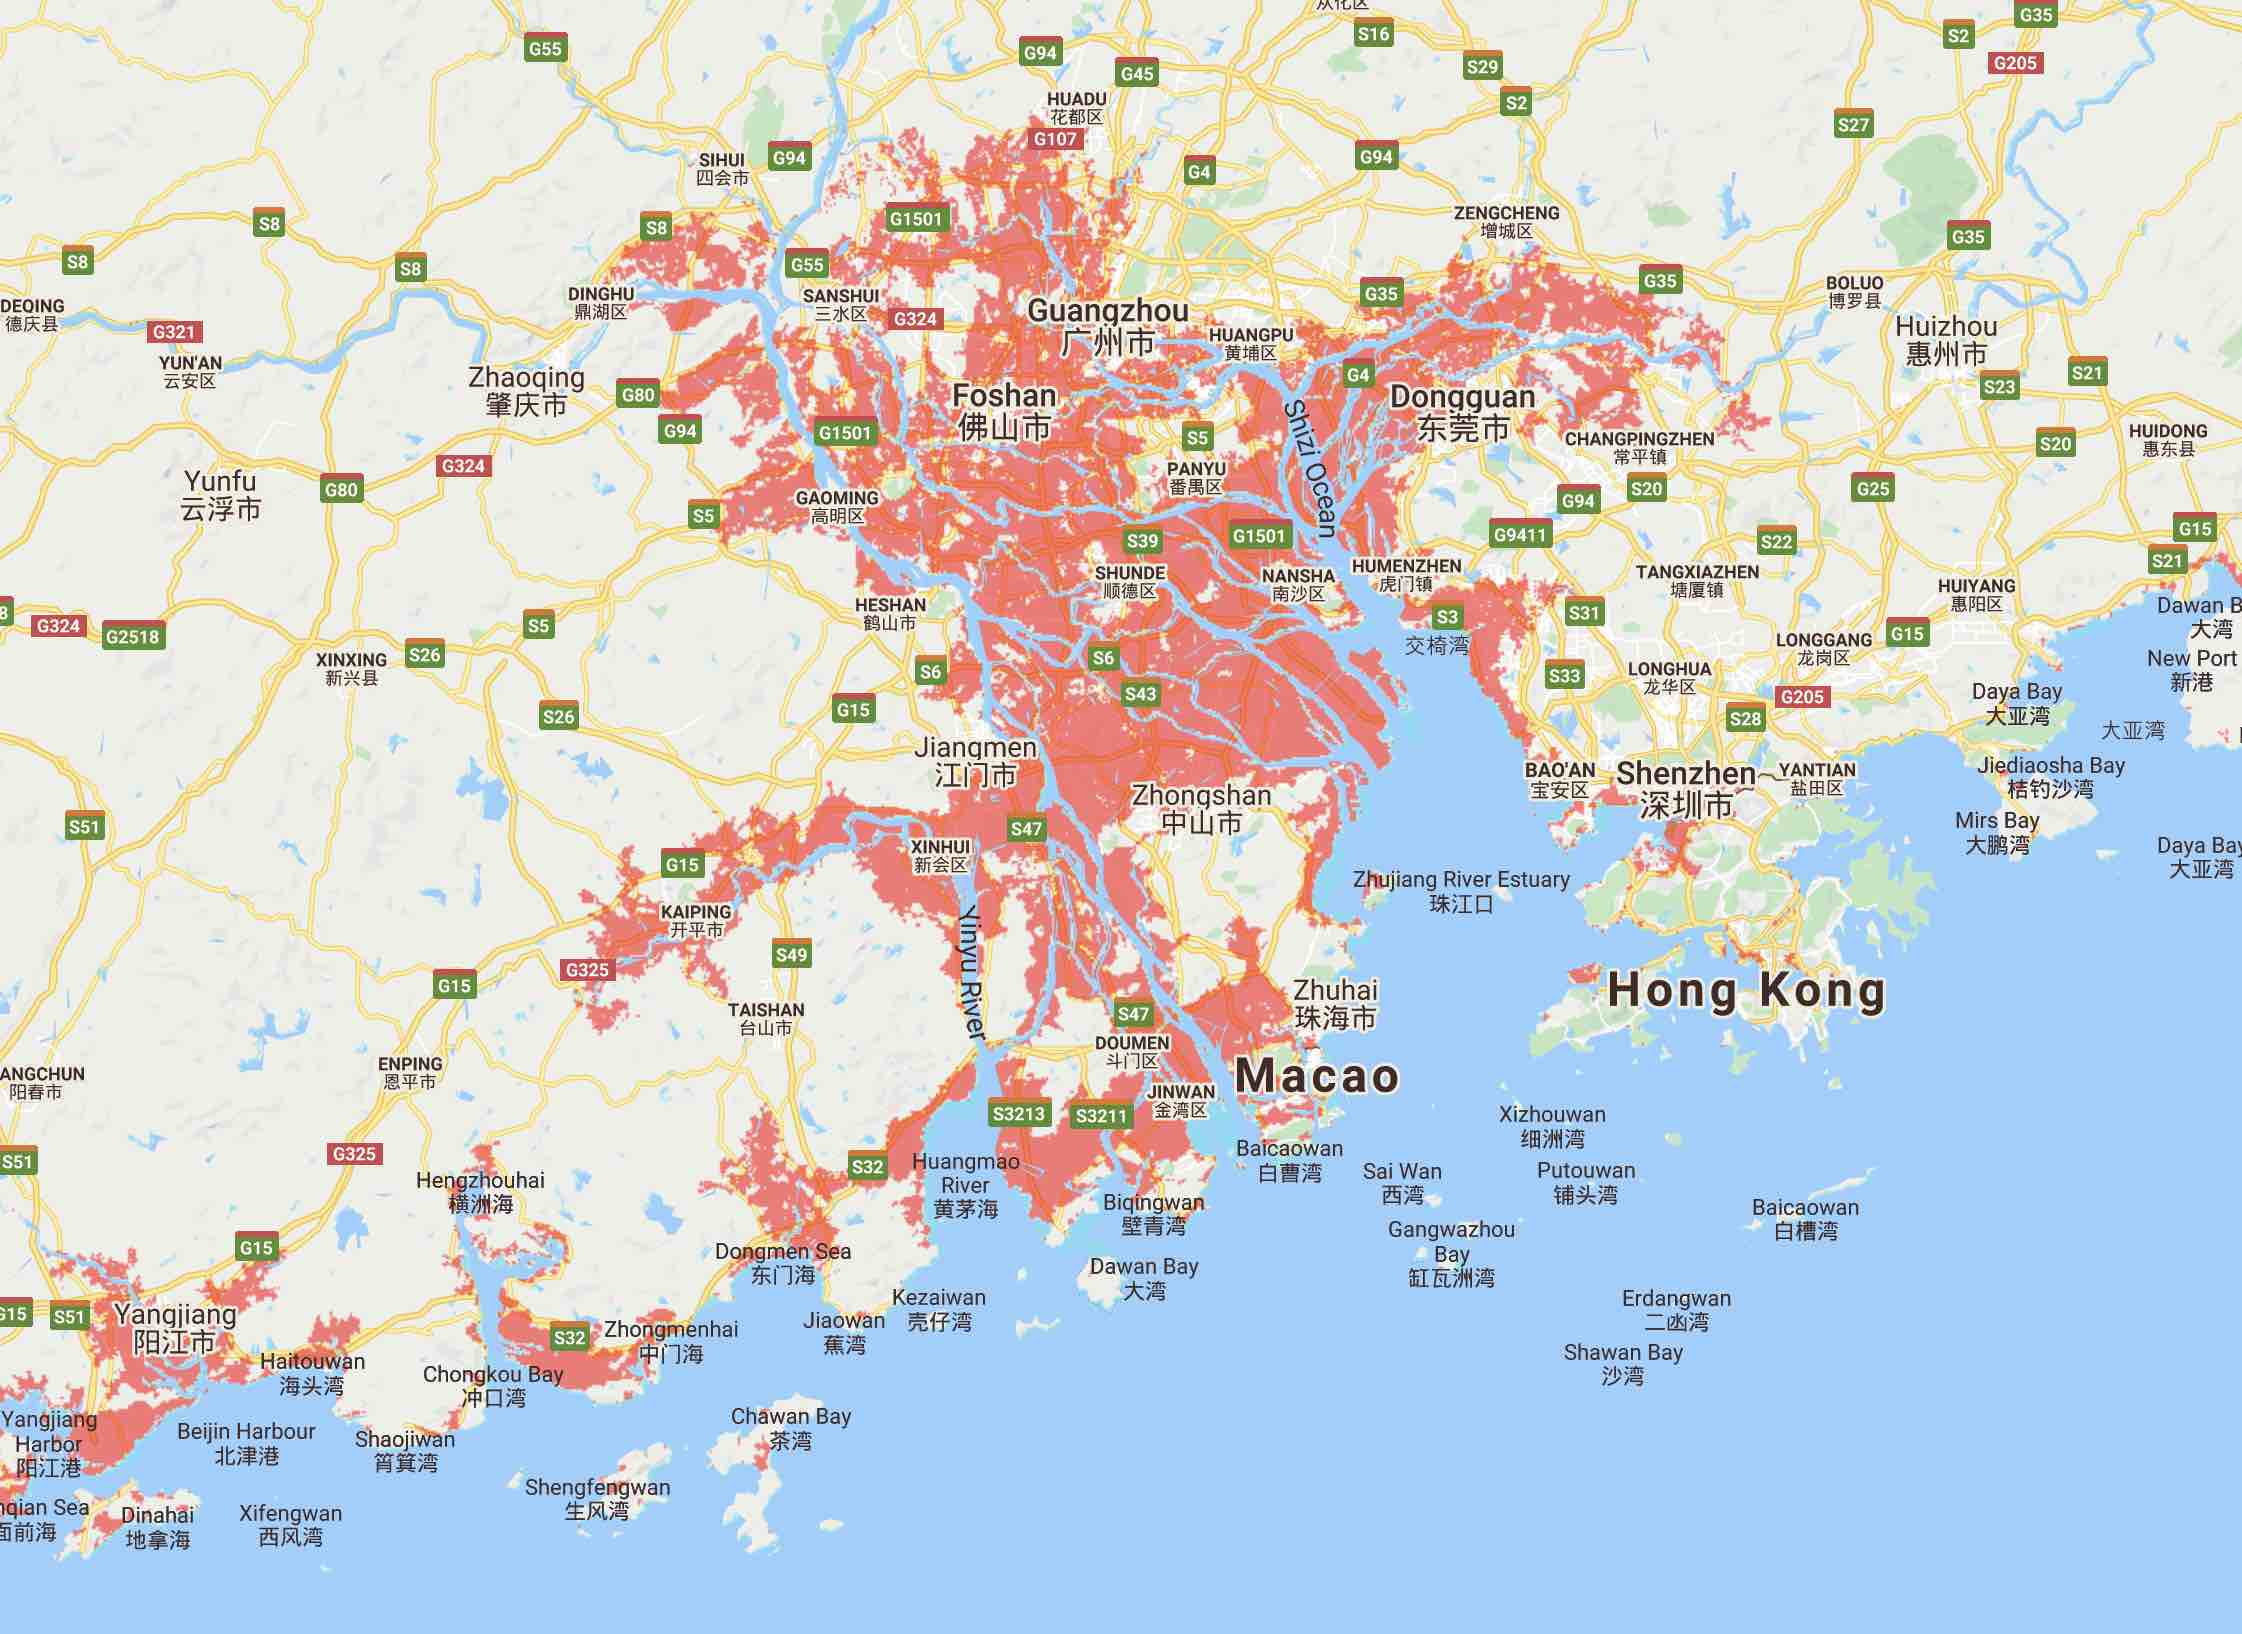
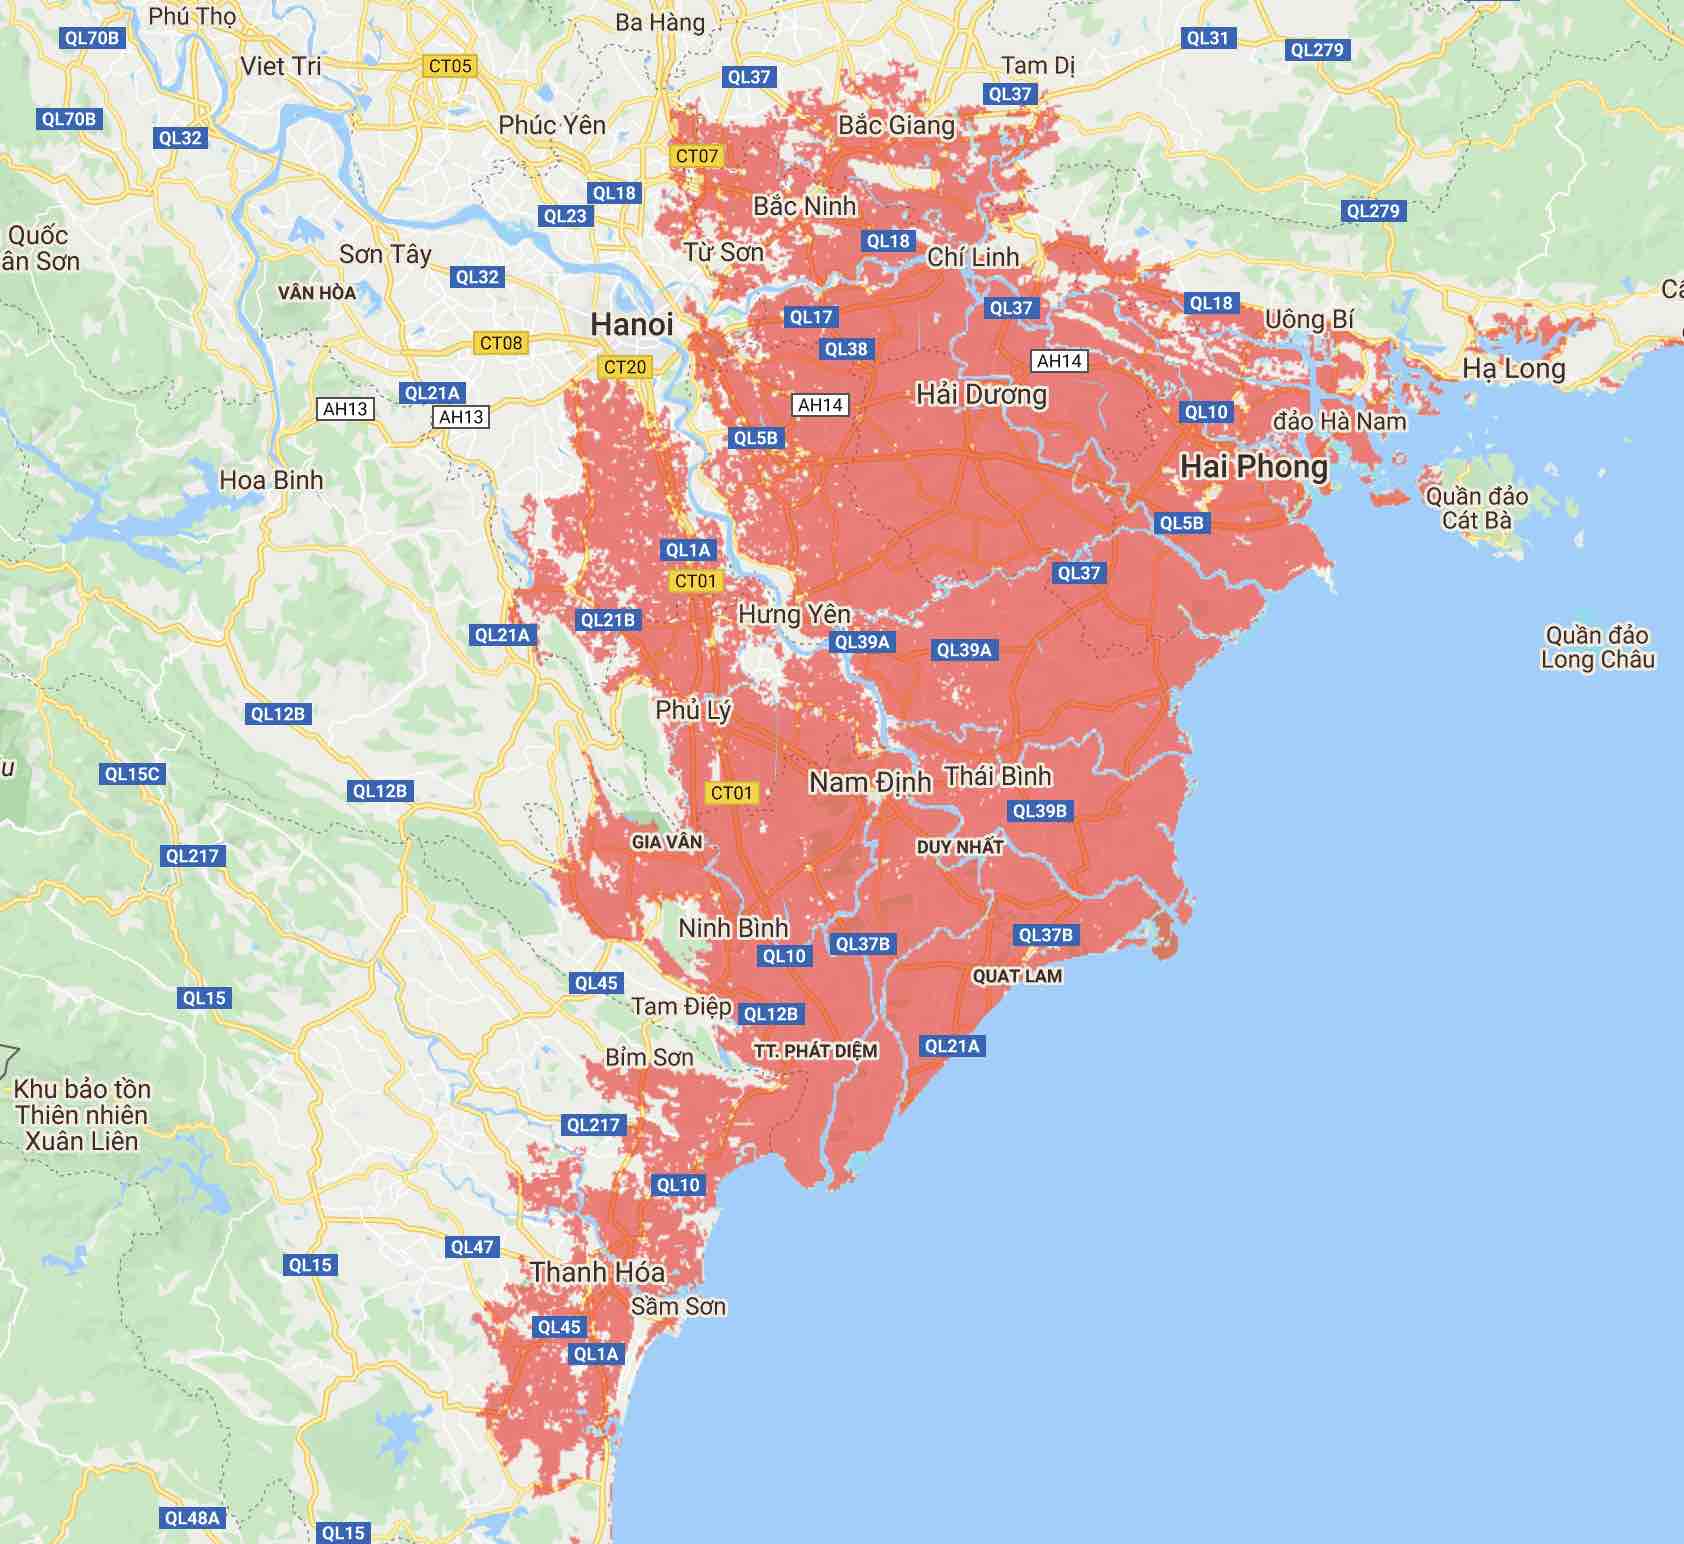
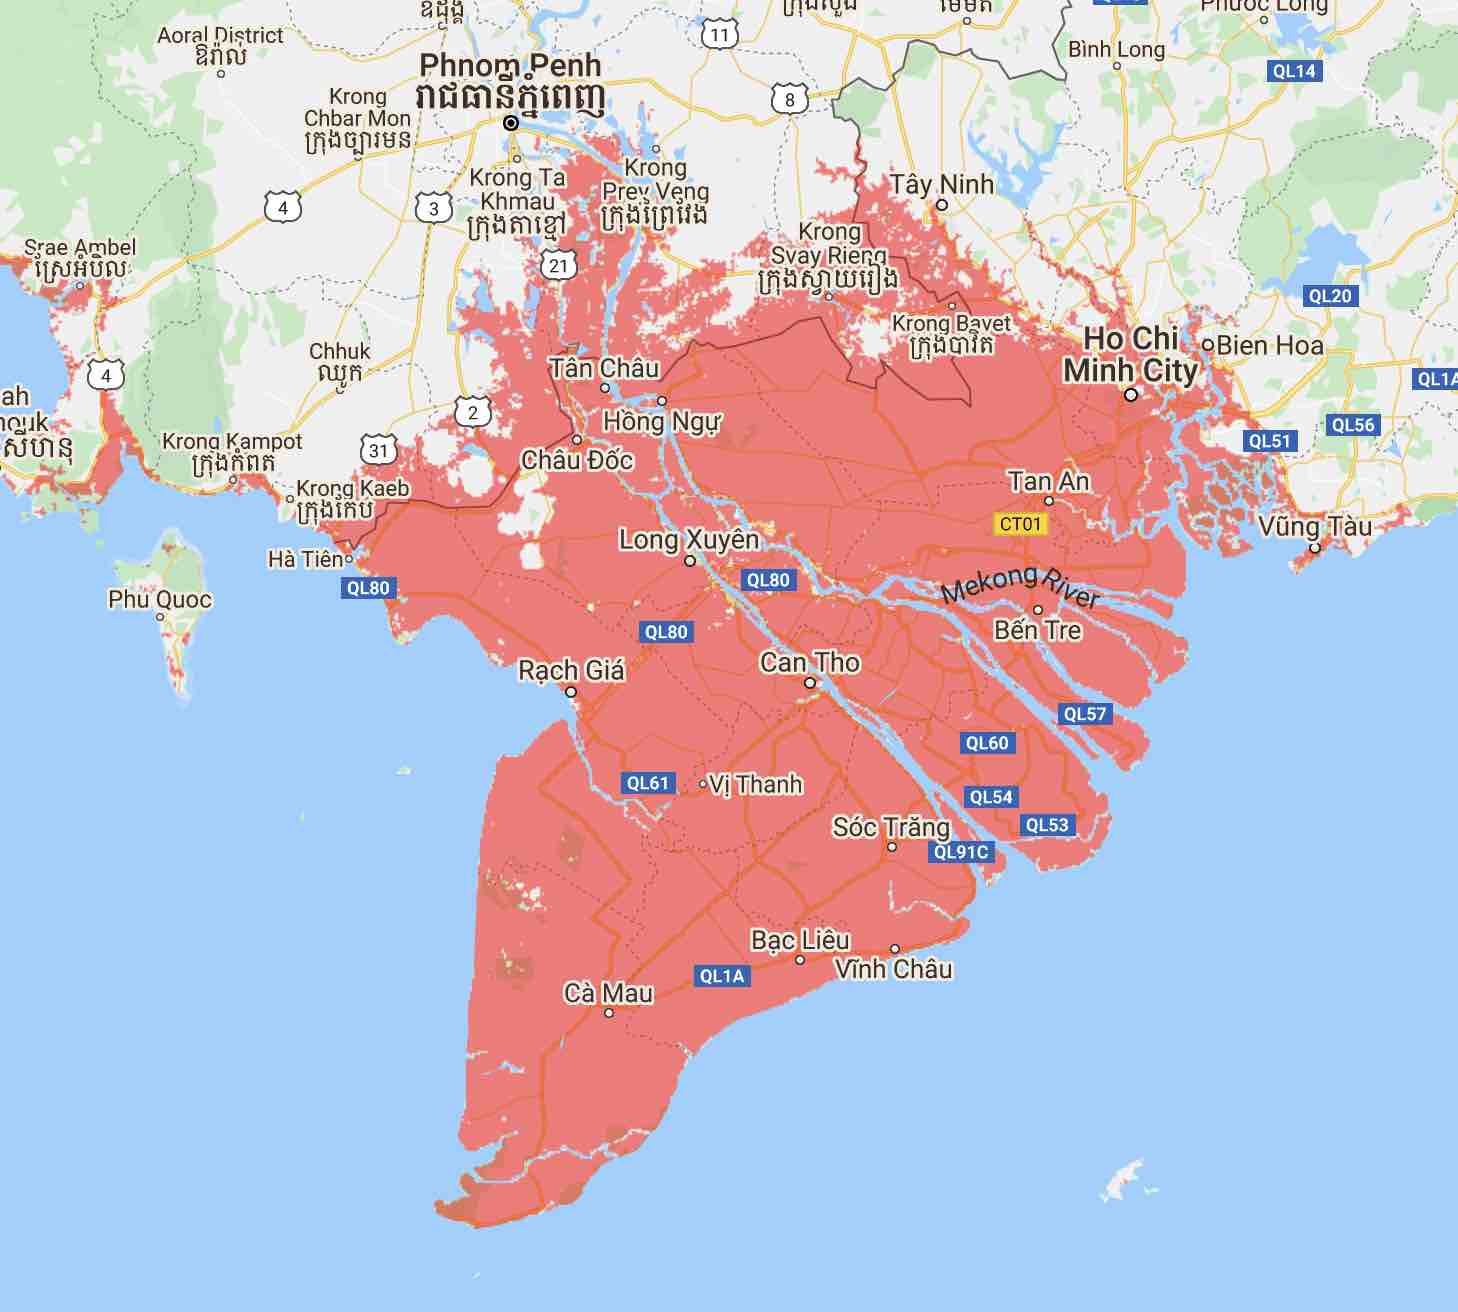
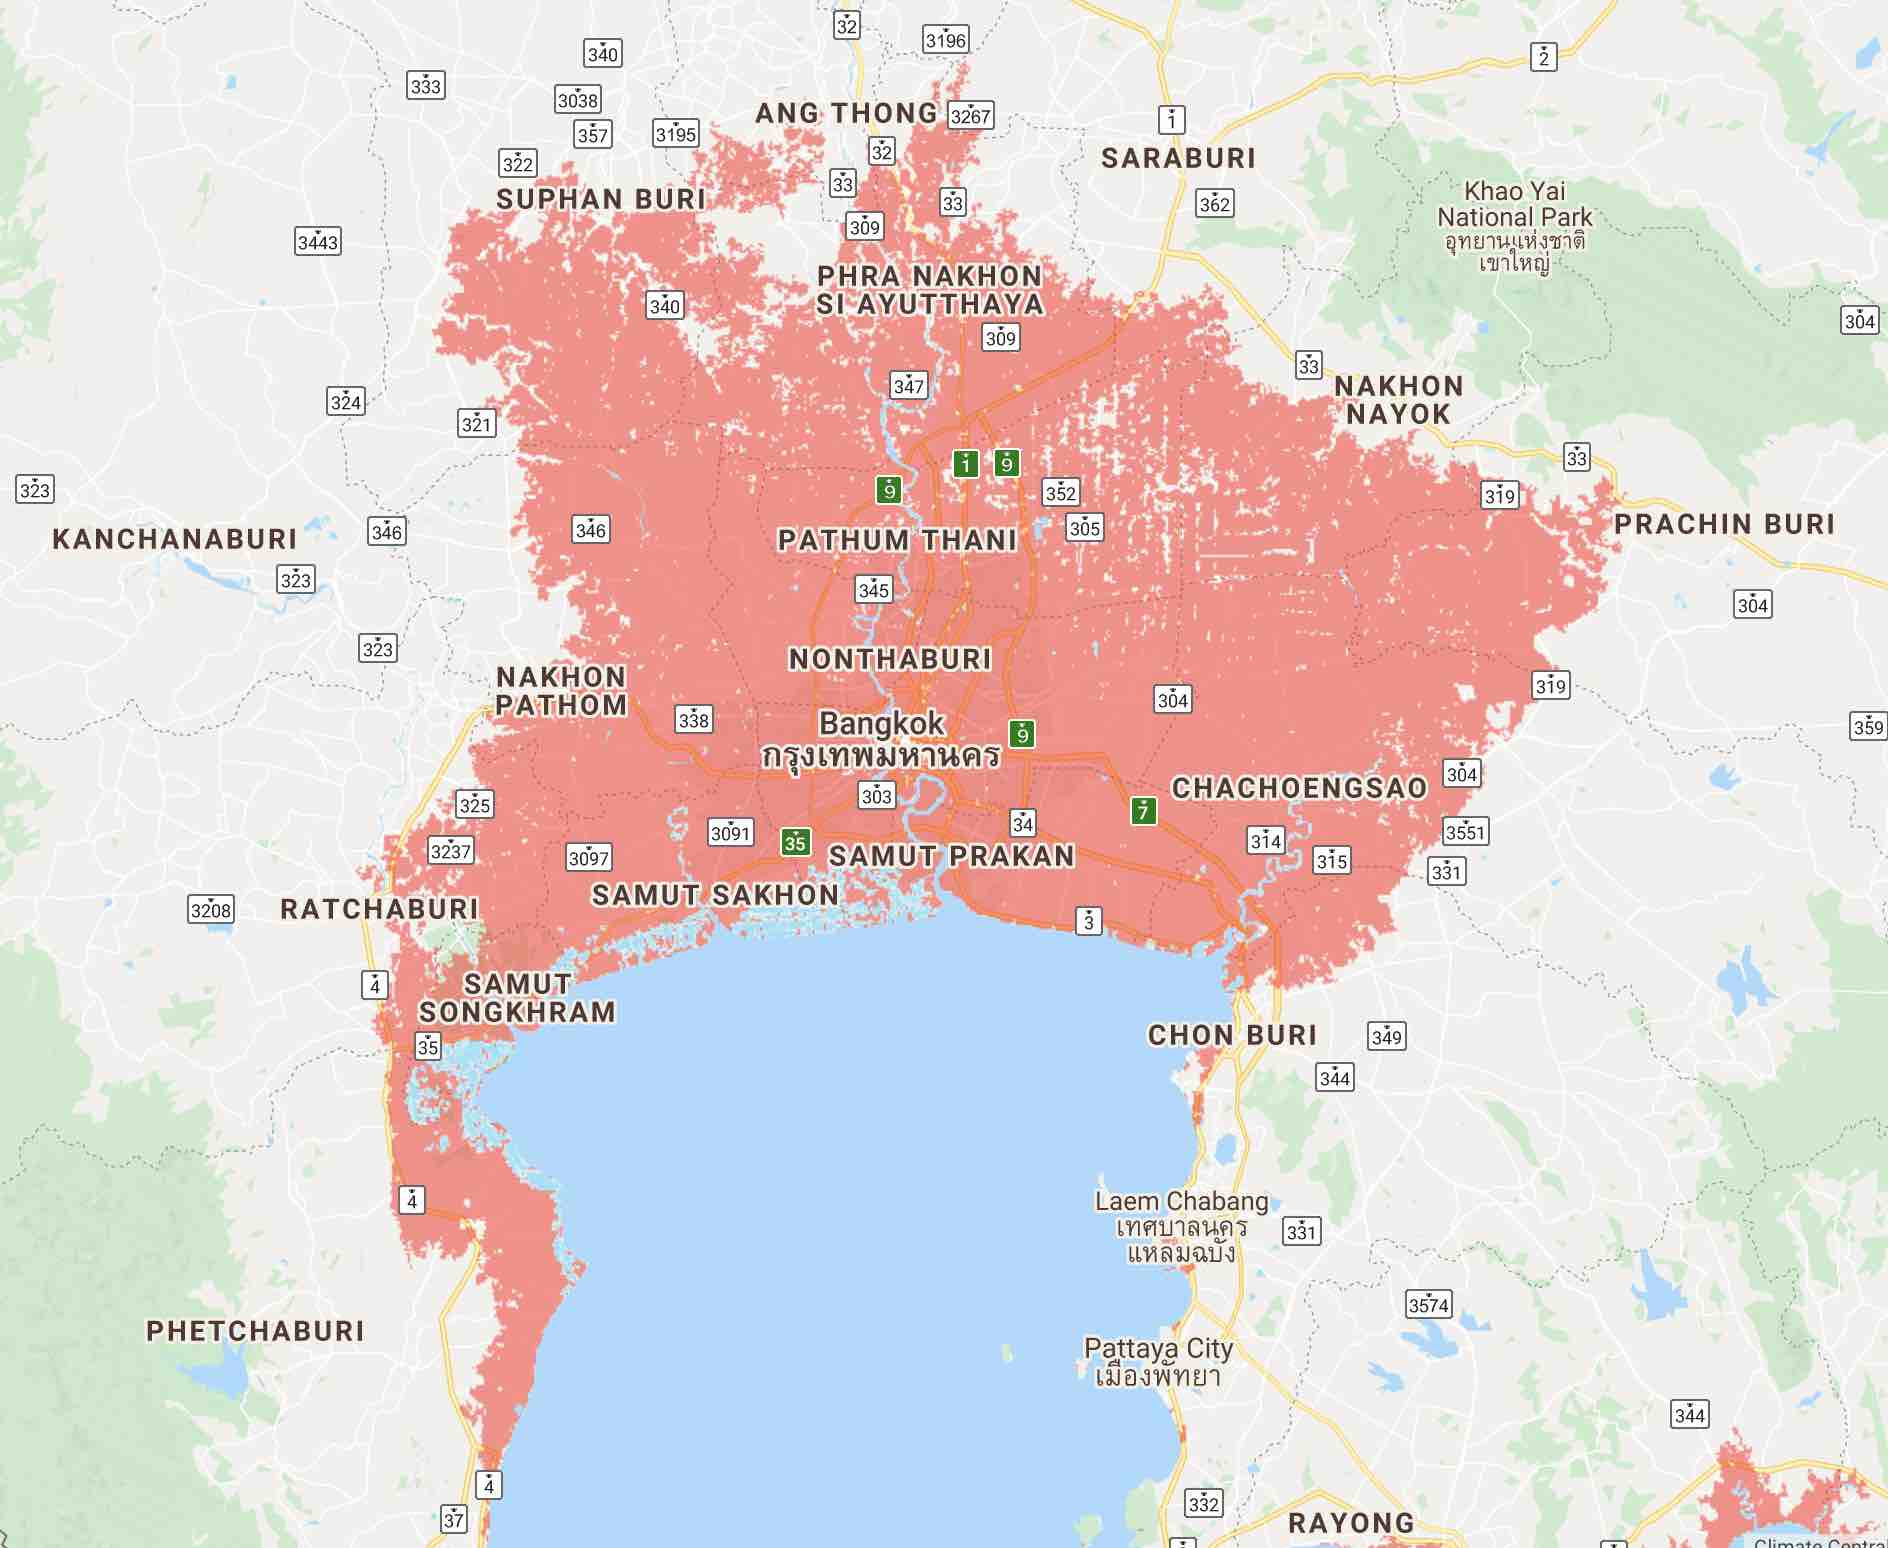
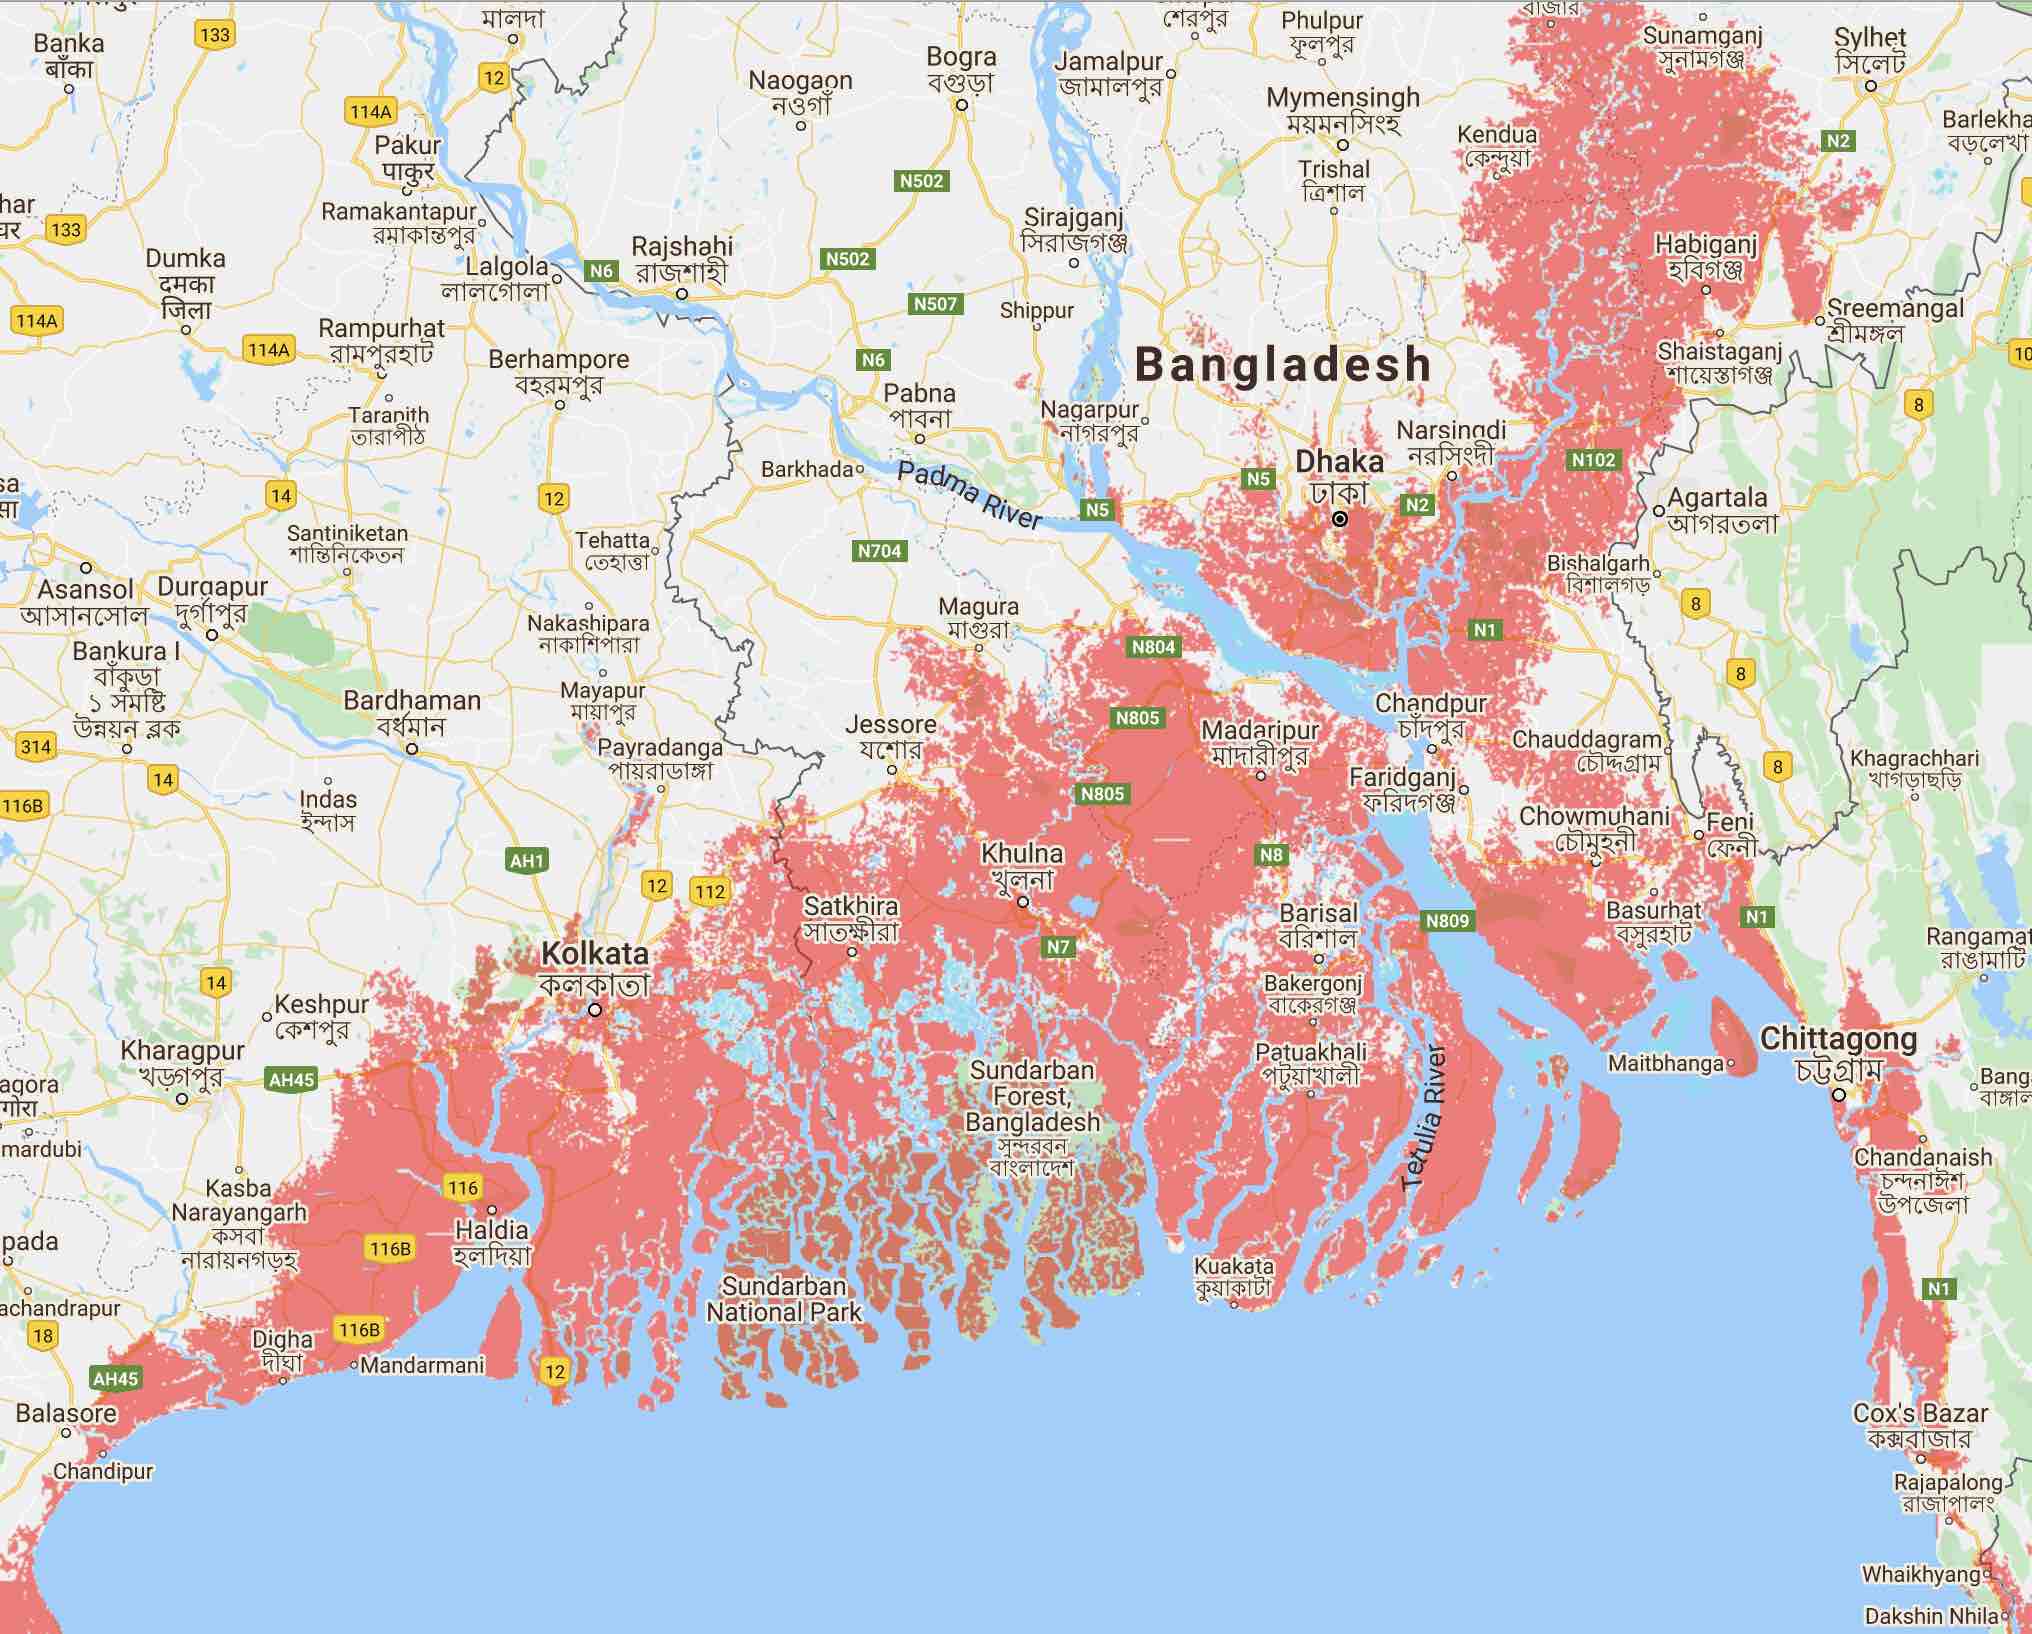
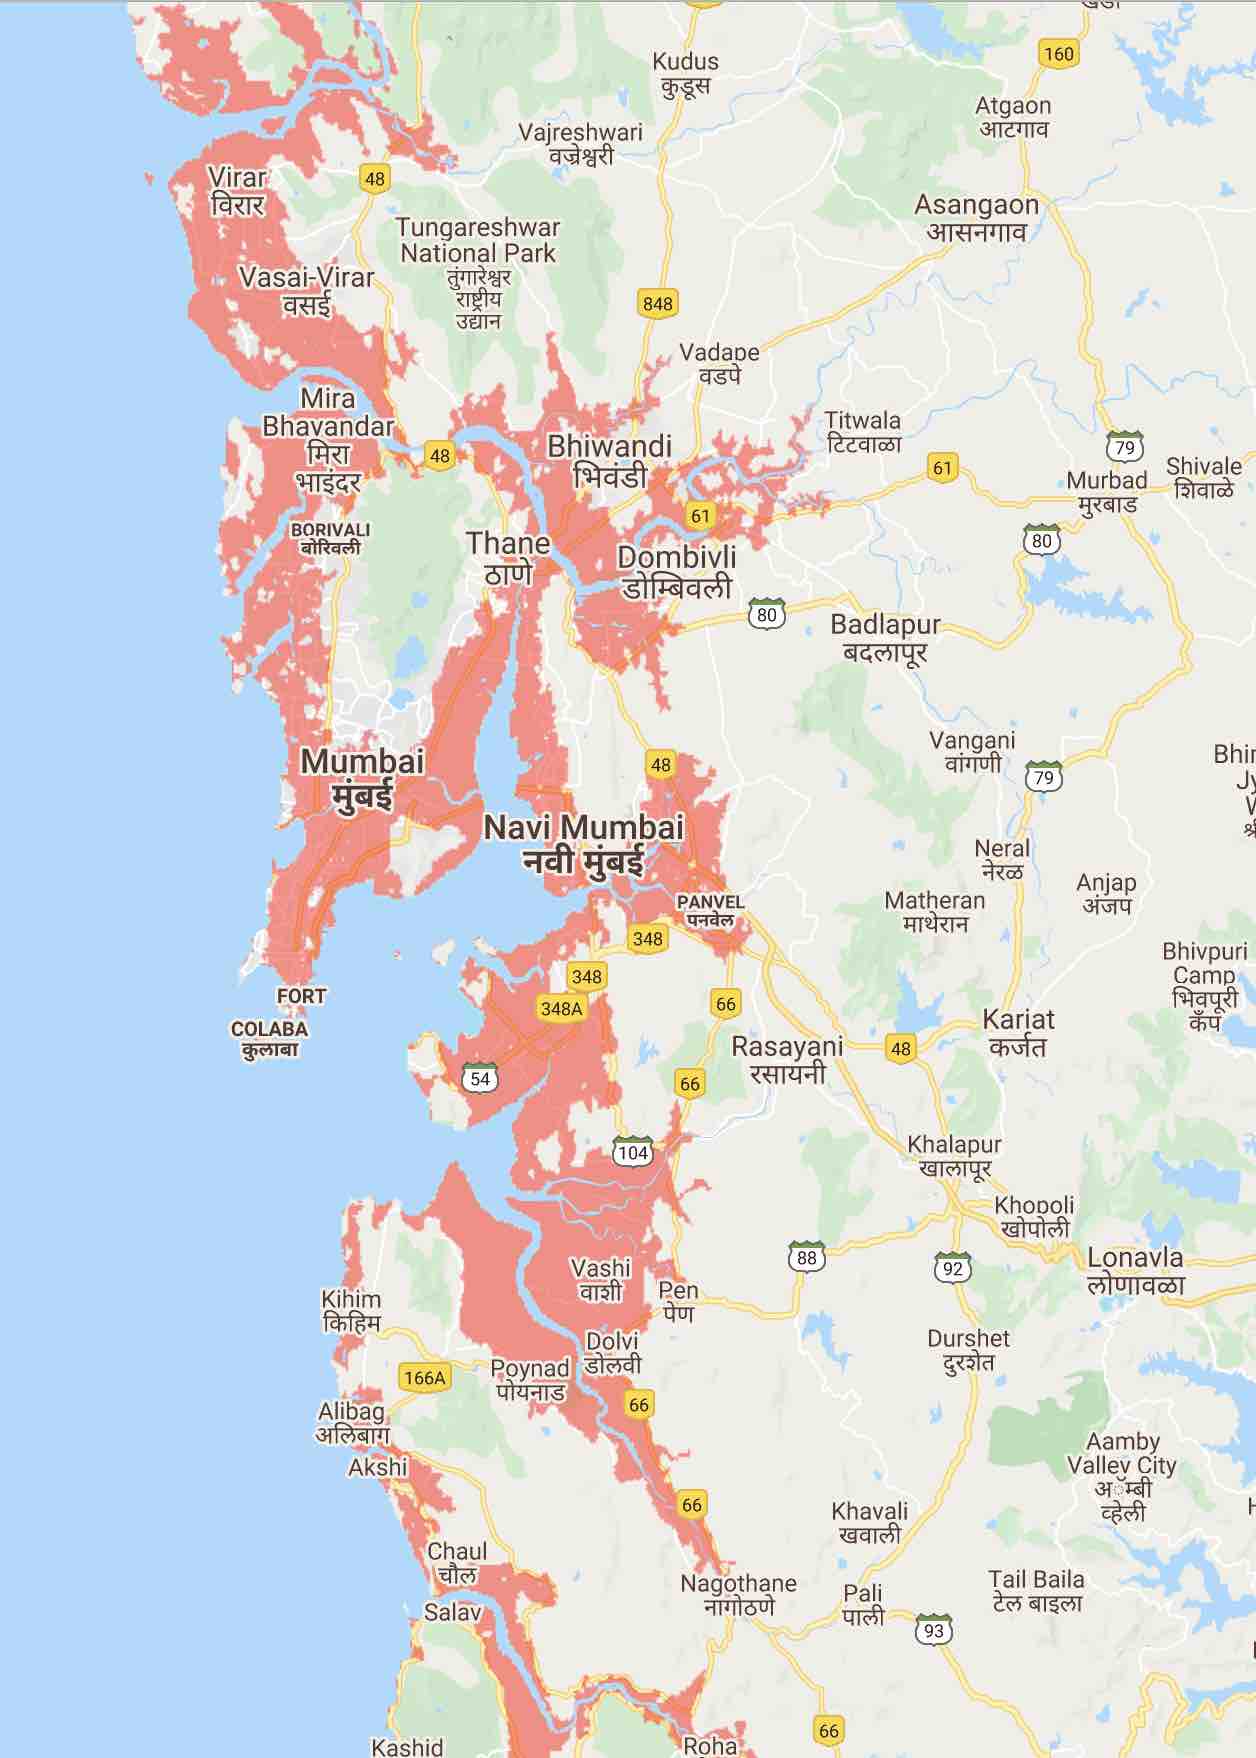
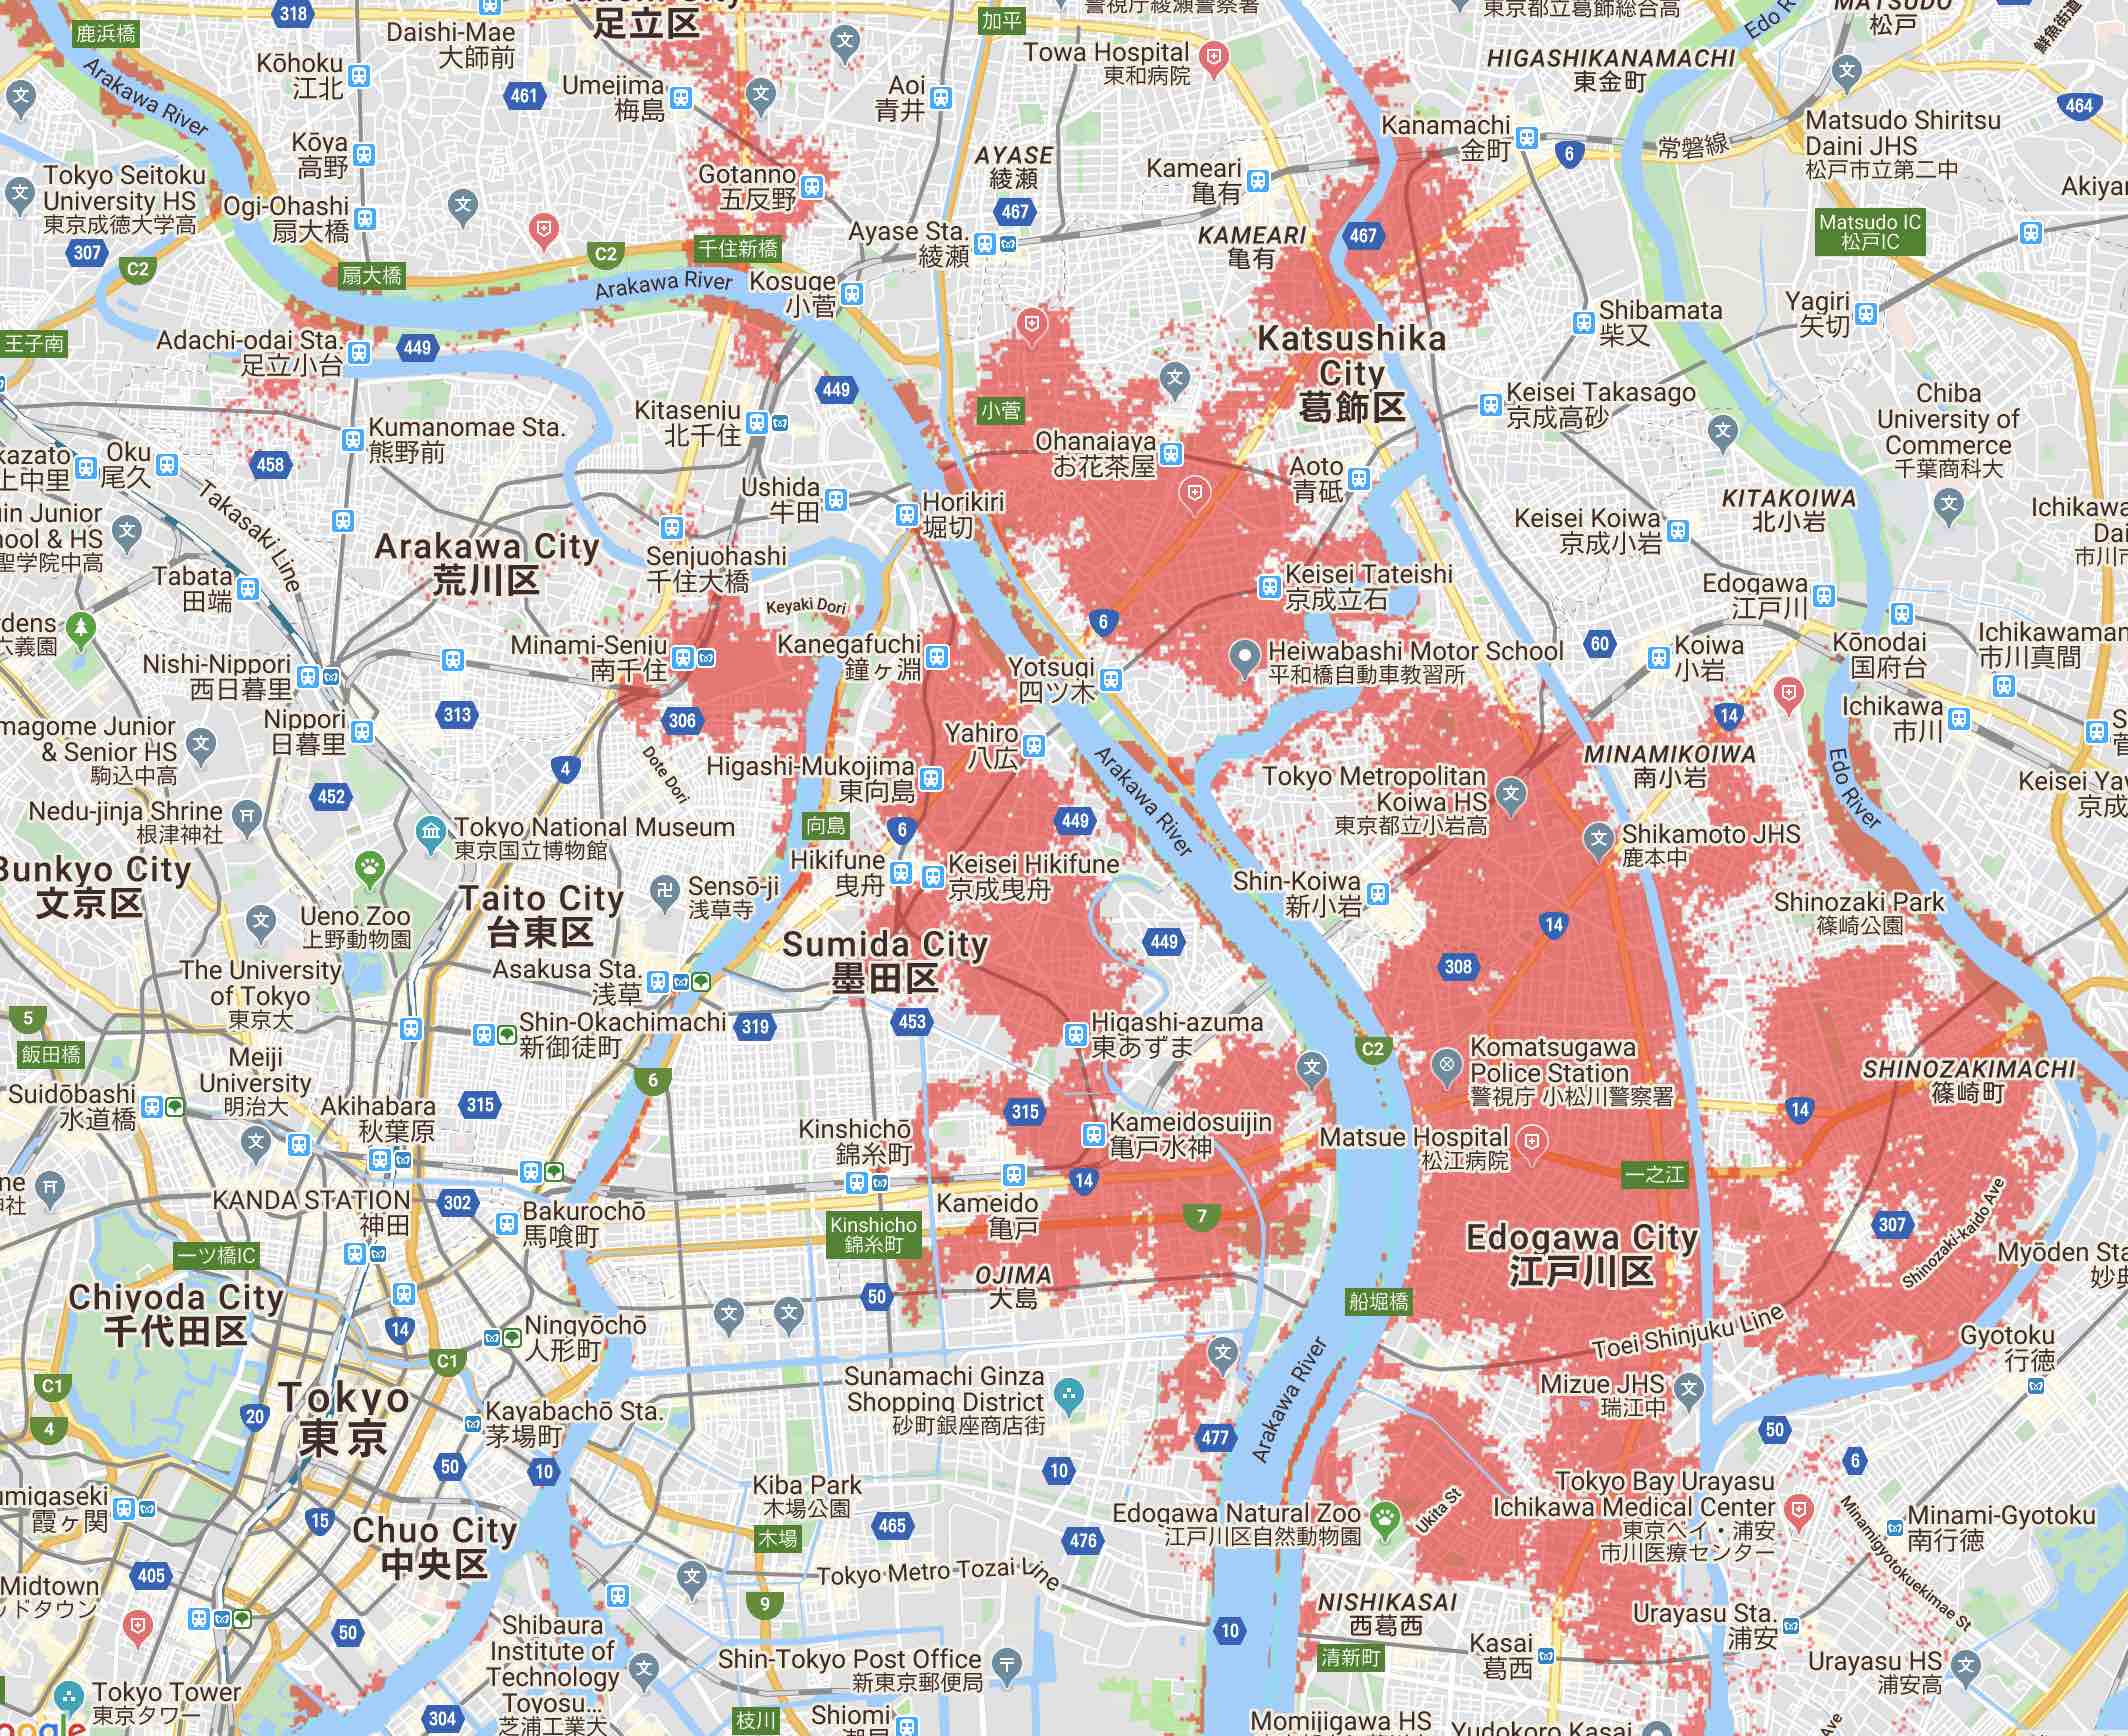
Maps do not account for: (i) existing levees or seawalls; (ii) precipitation nor river runoff, leading to lower flood risk determinations than would otherwise be the case in many areas; (iii) potential future changes in storm climatology due to climate change, such as storm intensification; future erosion nor marsh migration expected as sea levels rise; and (iv) potential development and coastal defence construction.
RCP4.5 is one of a set of future emission scenarios7. Details of RCP4.5 (numbers in brackets are relative to 2019 values): (i) radiative forcing stabilised in 2100 at 4.5 W/m2 (+45%); (ii) mean warming during 2080-2100 is +2.4˚C (+4.3˚F)8; and (iii) CO2 concentration increases to 526ppm (+30%) and fossil fuel and industry emissions peak in 2040 at 42GtCO2/yr (+14%)9.
In the past, Earth’s climate has alternated between ice ages and warm periods. Civilisation developed during the most recent warm period, known as the Holocene, that lasted 11,700 years. The prior warm period, known as the Eemian, occurred between 130,000 to 115,000 years ago10. The best estimate of the maximum temperature of the Eemian is 0.5–1.5℃ (0.9–2.7˚F) warmer than the period 1880–192011. The global surface temperature in 2020 was 1.2˚C warmer than 1850-1900 according to the World Meteorological Organisation12, and in 2019 was 1.2˚C (2.2˚F) warmer than 1880–1920 according to NASA Goddard Institute for Space Studies13. Therefore we’ve warmed the climate to well within our estimate of the Eemian temperature range.
We conclude that the modern trend line of global temperature crossed the early Holocene (smoothed) temperature maximum (+0.5℃) (+0.9˚F) in about 1985.
Hansen et al. (2017), Young people’s burden: requirement of negative CO2 emissions10.
We may have warmed the climate beyond that of the Eemian, or are about to leave the Eemian temperature range.
The Holocene, over 11,700 years in duration, had relatively stable climate, prior to the remarkable warming in the past half century. The Eemian, which lasted from about 130,000 to 115,000 years ago, was moderately warmer than the Holocene and experienced sea level rise to heights 6–9 m (20–30 ft) greater than today.
Hansen et al. (2017), Young people’s burden: requirement of negative CO2 emissions10.
Such sea level rise can only result from the collapse of Earth’s ice sheets, of which there are three – the Greenland, West Antarctic and East Antarctic ice sheets. Therefore the most pressing question is not “how much sea level rise?”, but “how fast?”.
Our greenhouse gas emissions
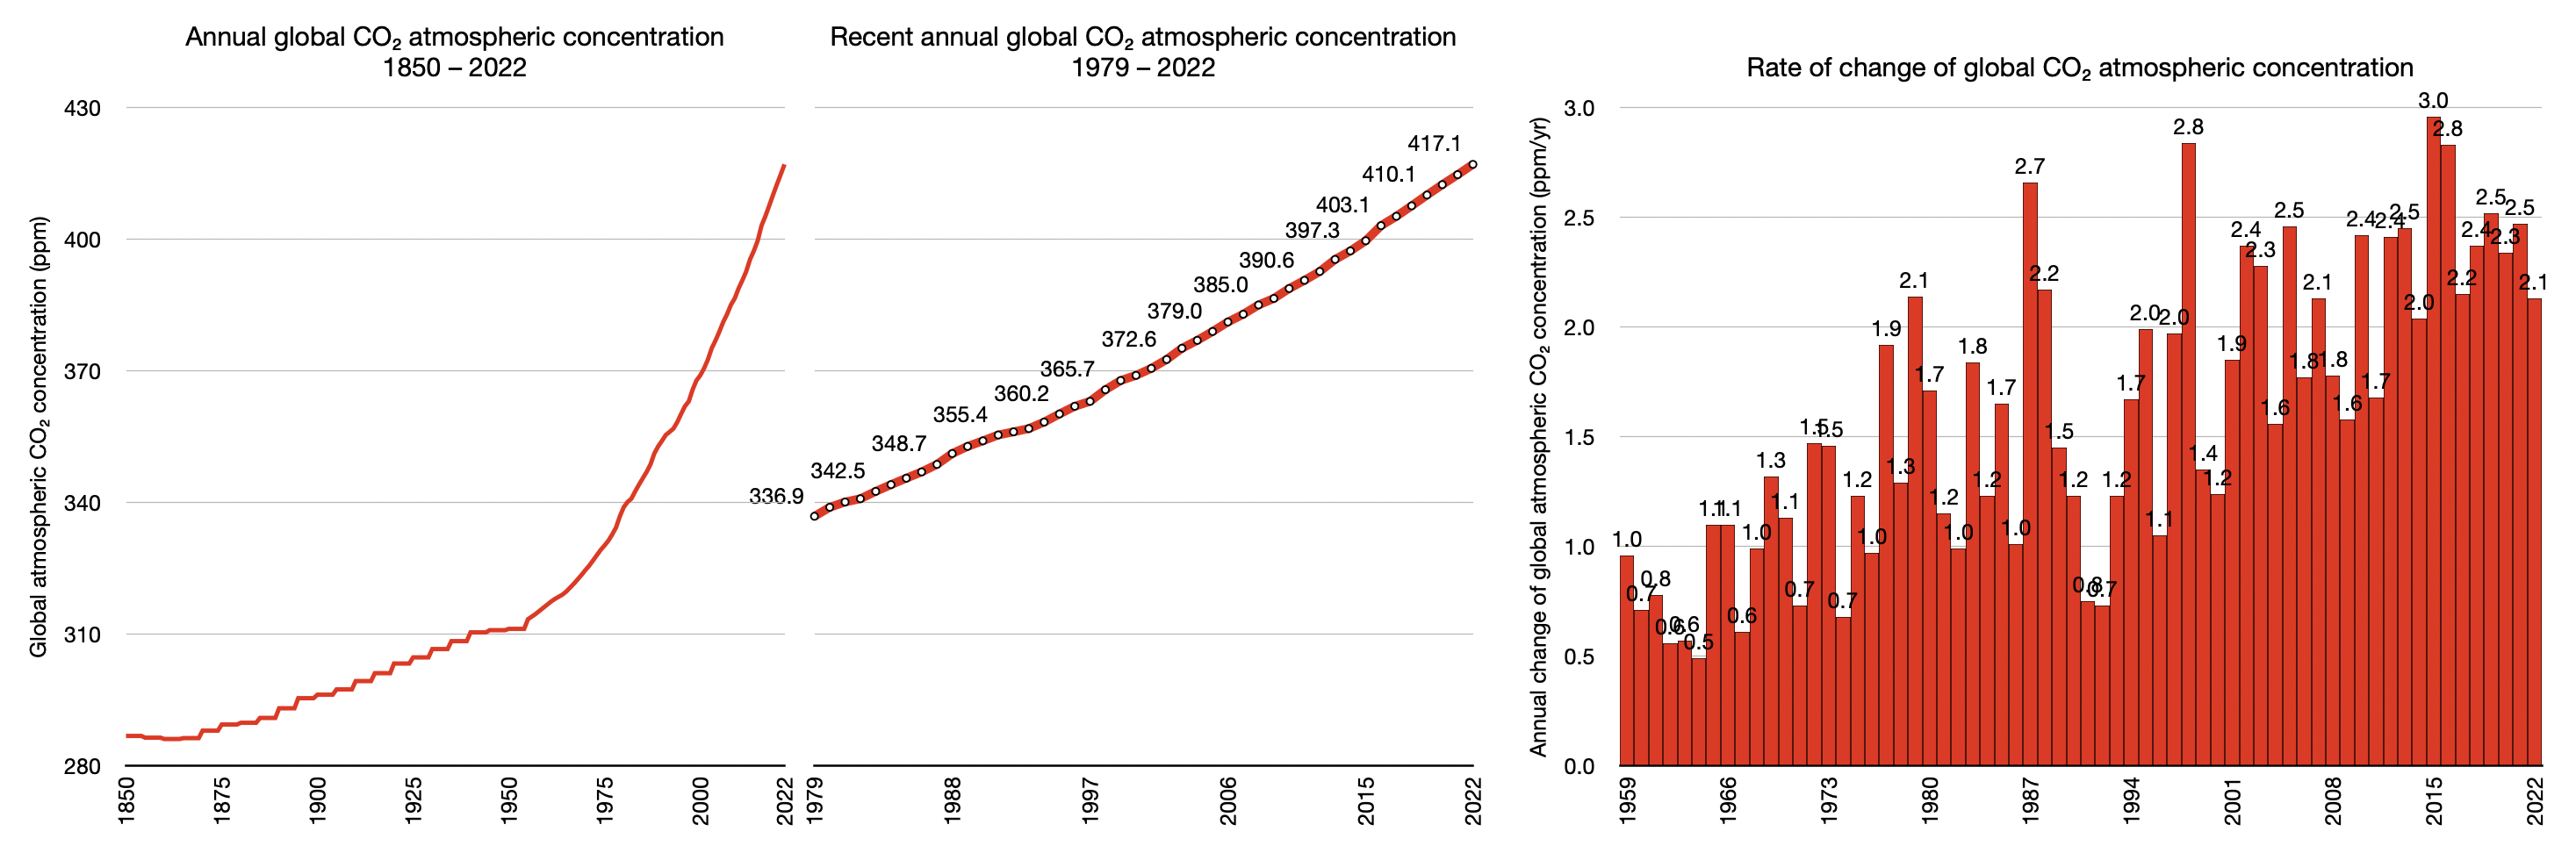
Cumulative long lived greenhouse gases (GHGs) solely determine our long-term warming commitment, simply because of their long lifetimes in the atmosphere14, and they can’t be removed and sequestered at necessary scale. Cumulative carbon dioxide (CO2) is almost the singular cause, and is increasing rapidly15 16 (nitrous oxide (N2O) is the only other significant contributor but accountable for about one tenth that of CO2, and is changing slowly).
The trend of global average atmospheric CO2 concentration now exceeds 416ppm17.
Periods of the past with a CO2 concentration similar to the current one can provide estimates for the associated “equilibrium” climate. In the mid-Pliocene, 3–5 million years ago, the last time that the Earth’s atmosphere contained 400ppm of CO2, global mean surface temperature was 2–3˚C warmer than today, the Greenland and West Antarctic ice sheets melted and even some of the East Antarctic ice was lost, leading to sea levels that were 10–20m (30–60ft) higher than they are today. During the mid-Miocene (15–17 million years ago), atmospheric CO2 reached 400–650ppm and global mean surface temperature was 3–4˚C warmer than today.
WMO, 2017, State of the Global Climate in 201718.
Half of all anthropogenic CO2 emissions have been emitted since 1983 (during the last 37 years)19, and almost all (86%) by the world’s energy system20. In every year since 2010, the annual growth of atmospheric CO2 has exceeded +2ppm/yr.
The progress of international climate negotiations has been astonishingly inept. In 2021, 6 years since the Paris Agreement, 27 years since the UNFCCC came into force, 33 years since the formation of the IPCC, and 41 years since the first joint scientific meeting about atmospheric CO2, annual CO2 emissions from fossil fuels and industry have soared. Between the first joint scientific meeting and the end of 2019, CO2 emissions from fossil fuels and industry increased 88%, and 56% since COP1 in 199523 24. To make matters worse: (i) as explained above, limiting warming to 1.5℃ (the goal of the Paris Agreement) is not safe because when earth was last warmed 1.5℃, seas were 6 to 9m (20 to 30ft) higher; (ii) the scale of emission reductions prescribed are beyond any historic precedent25; (iii) prescribed emission reductions depend on concurrent massive CO2 removal26; (iv) the annual growth of atmospheric CO2 persistently near record rate (see chart 1 above); (v) 1.5℃ is imminent;27 and (vi) carbon offsets are falsehoods28.
Charts 2 to 7 show annual CO2 emissions have persistently increased (except for the impact of the Global Financial Crisis29 and COVID-1930). Each dataset used in the following charts is the most recent available.
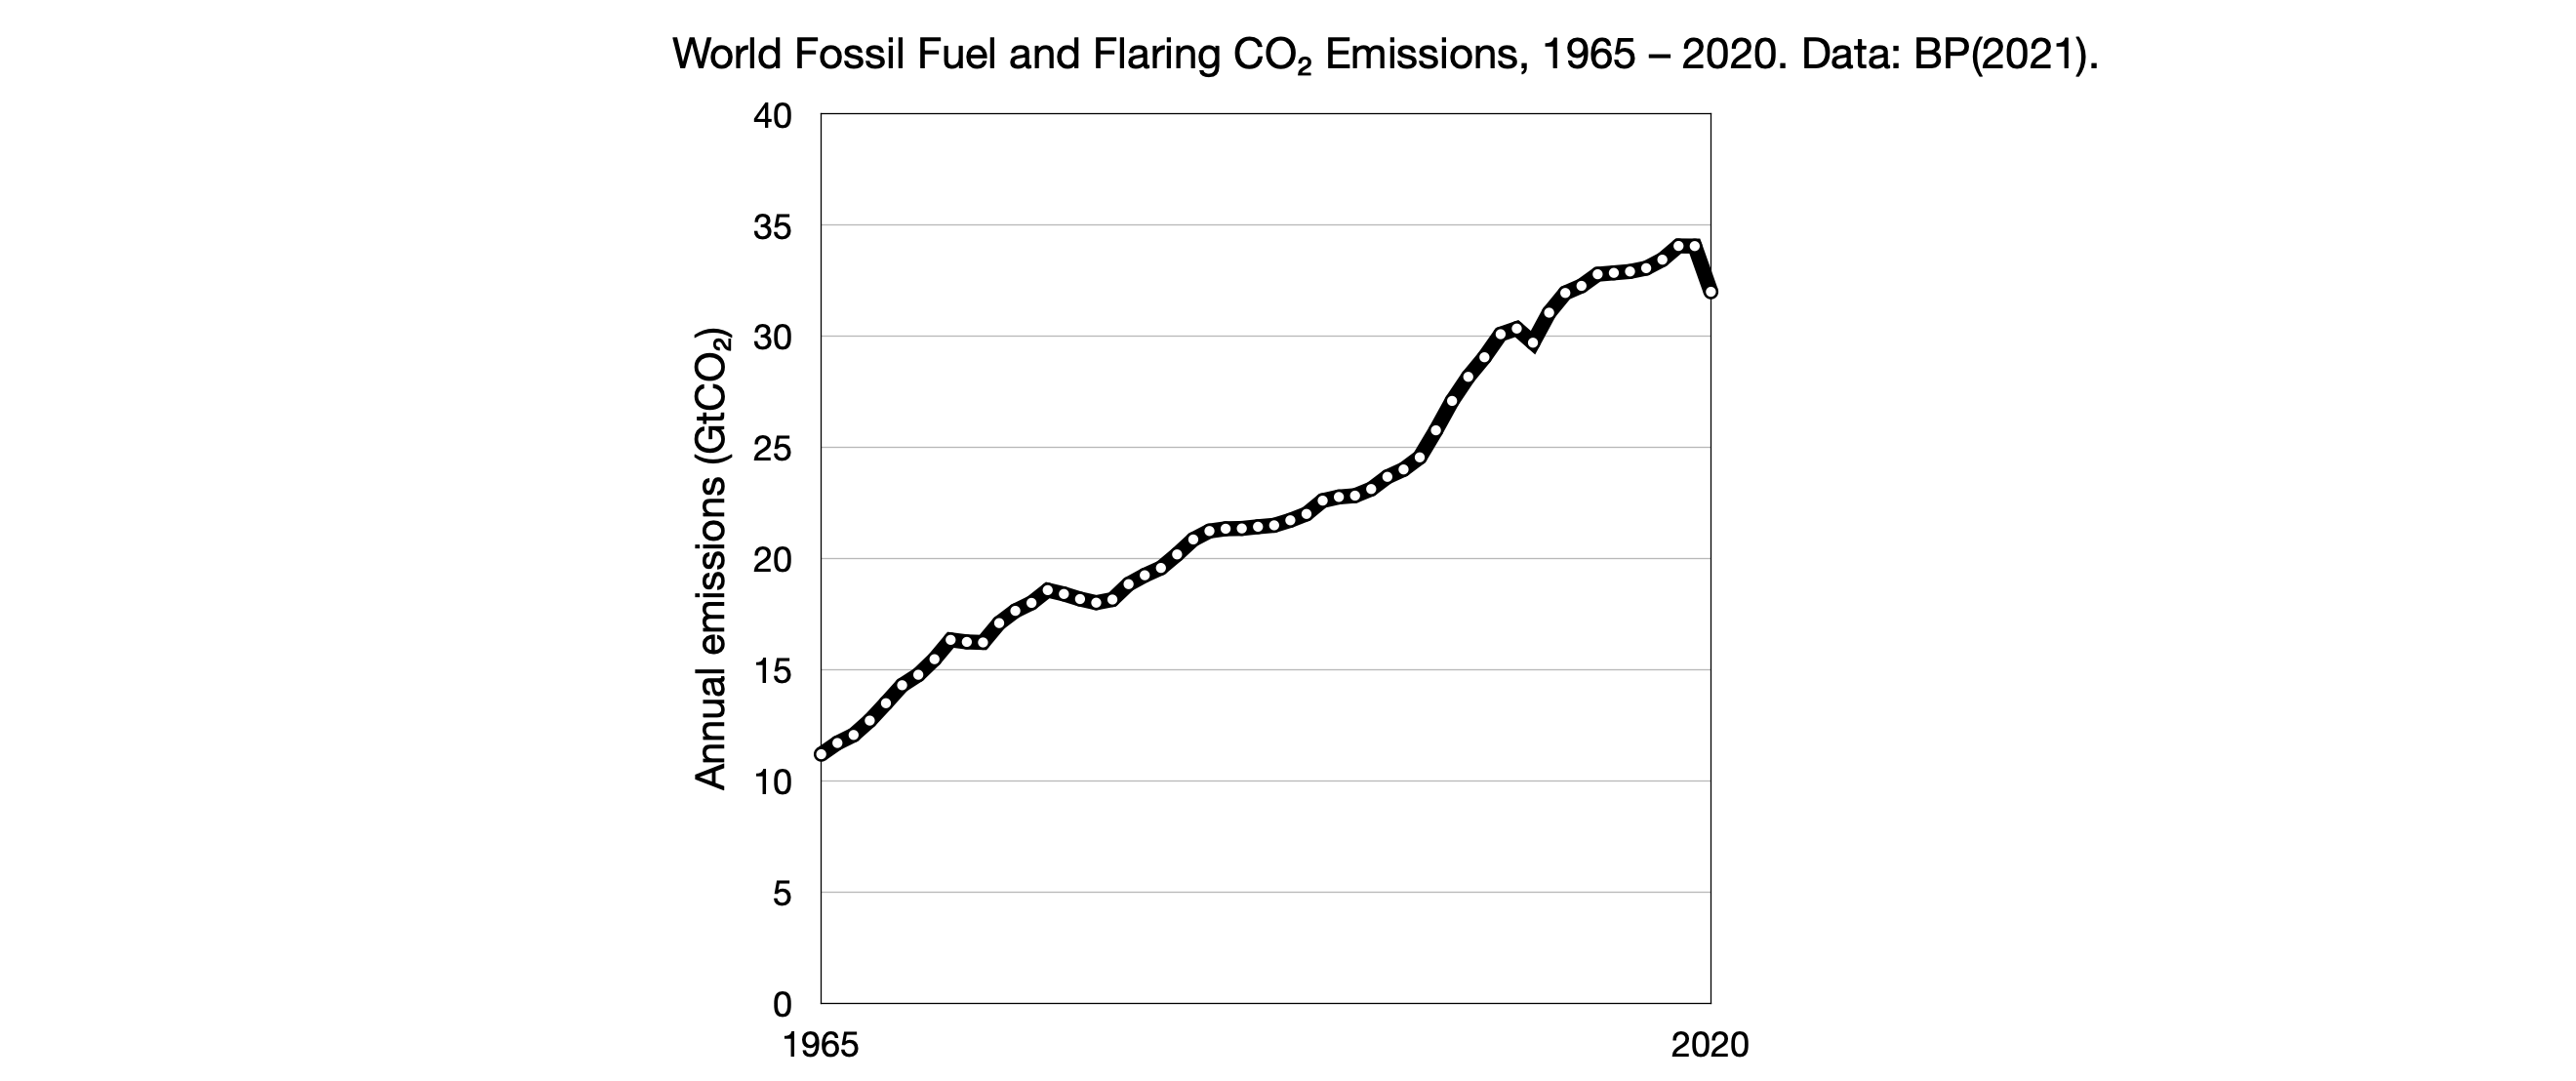
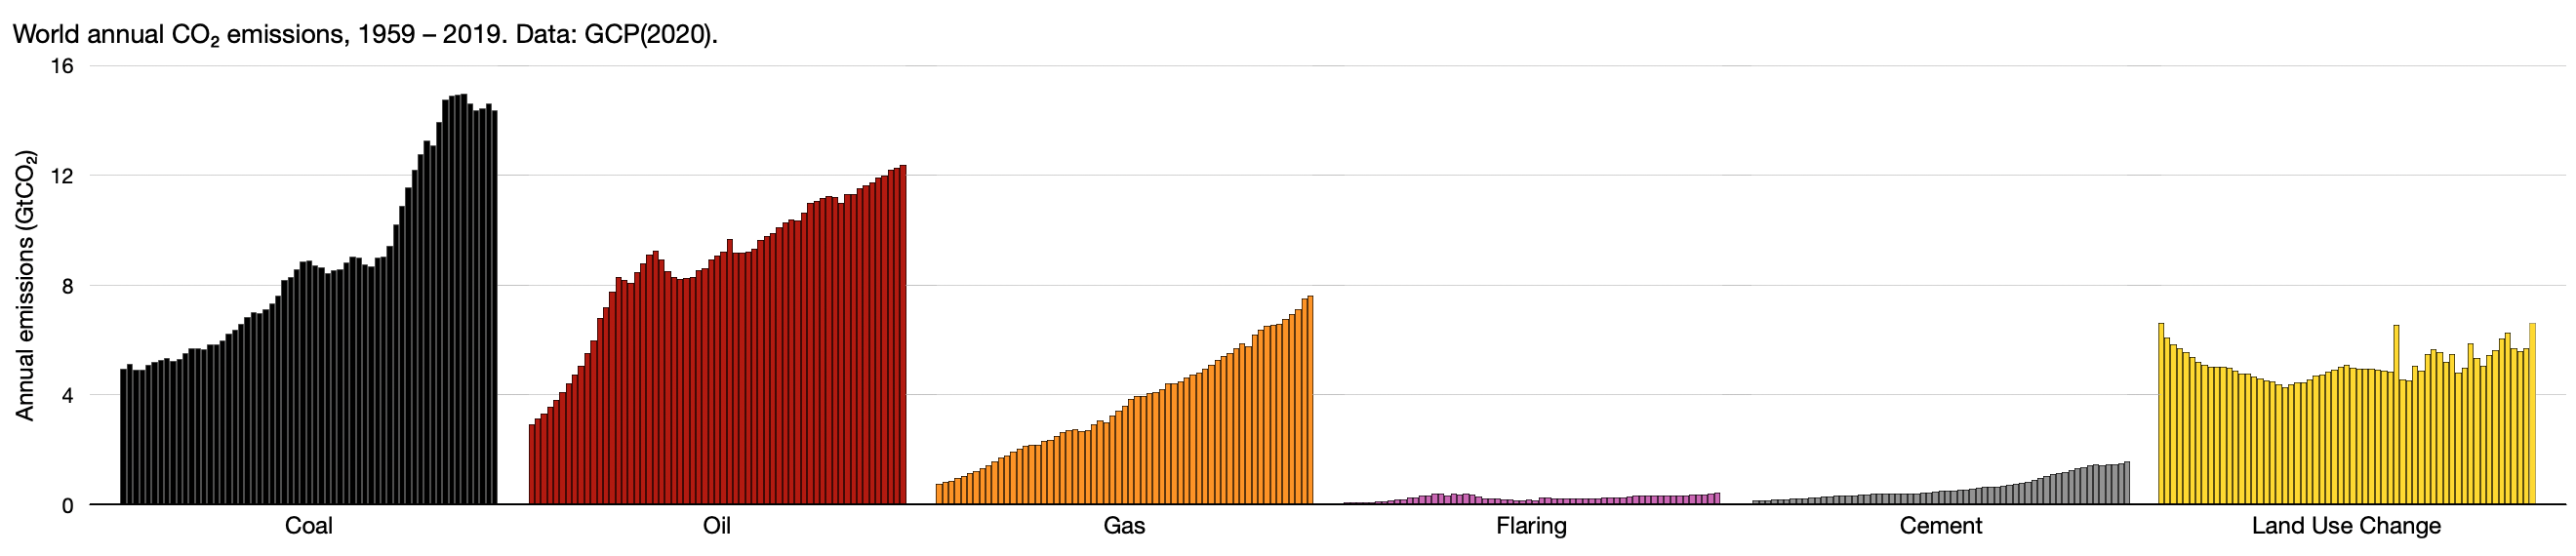
Chart 4 shows that excluding the impact of COVID-19, ‘every year energy use increases, & most of the increases come from fossil fuels’33.
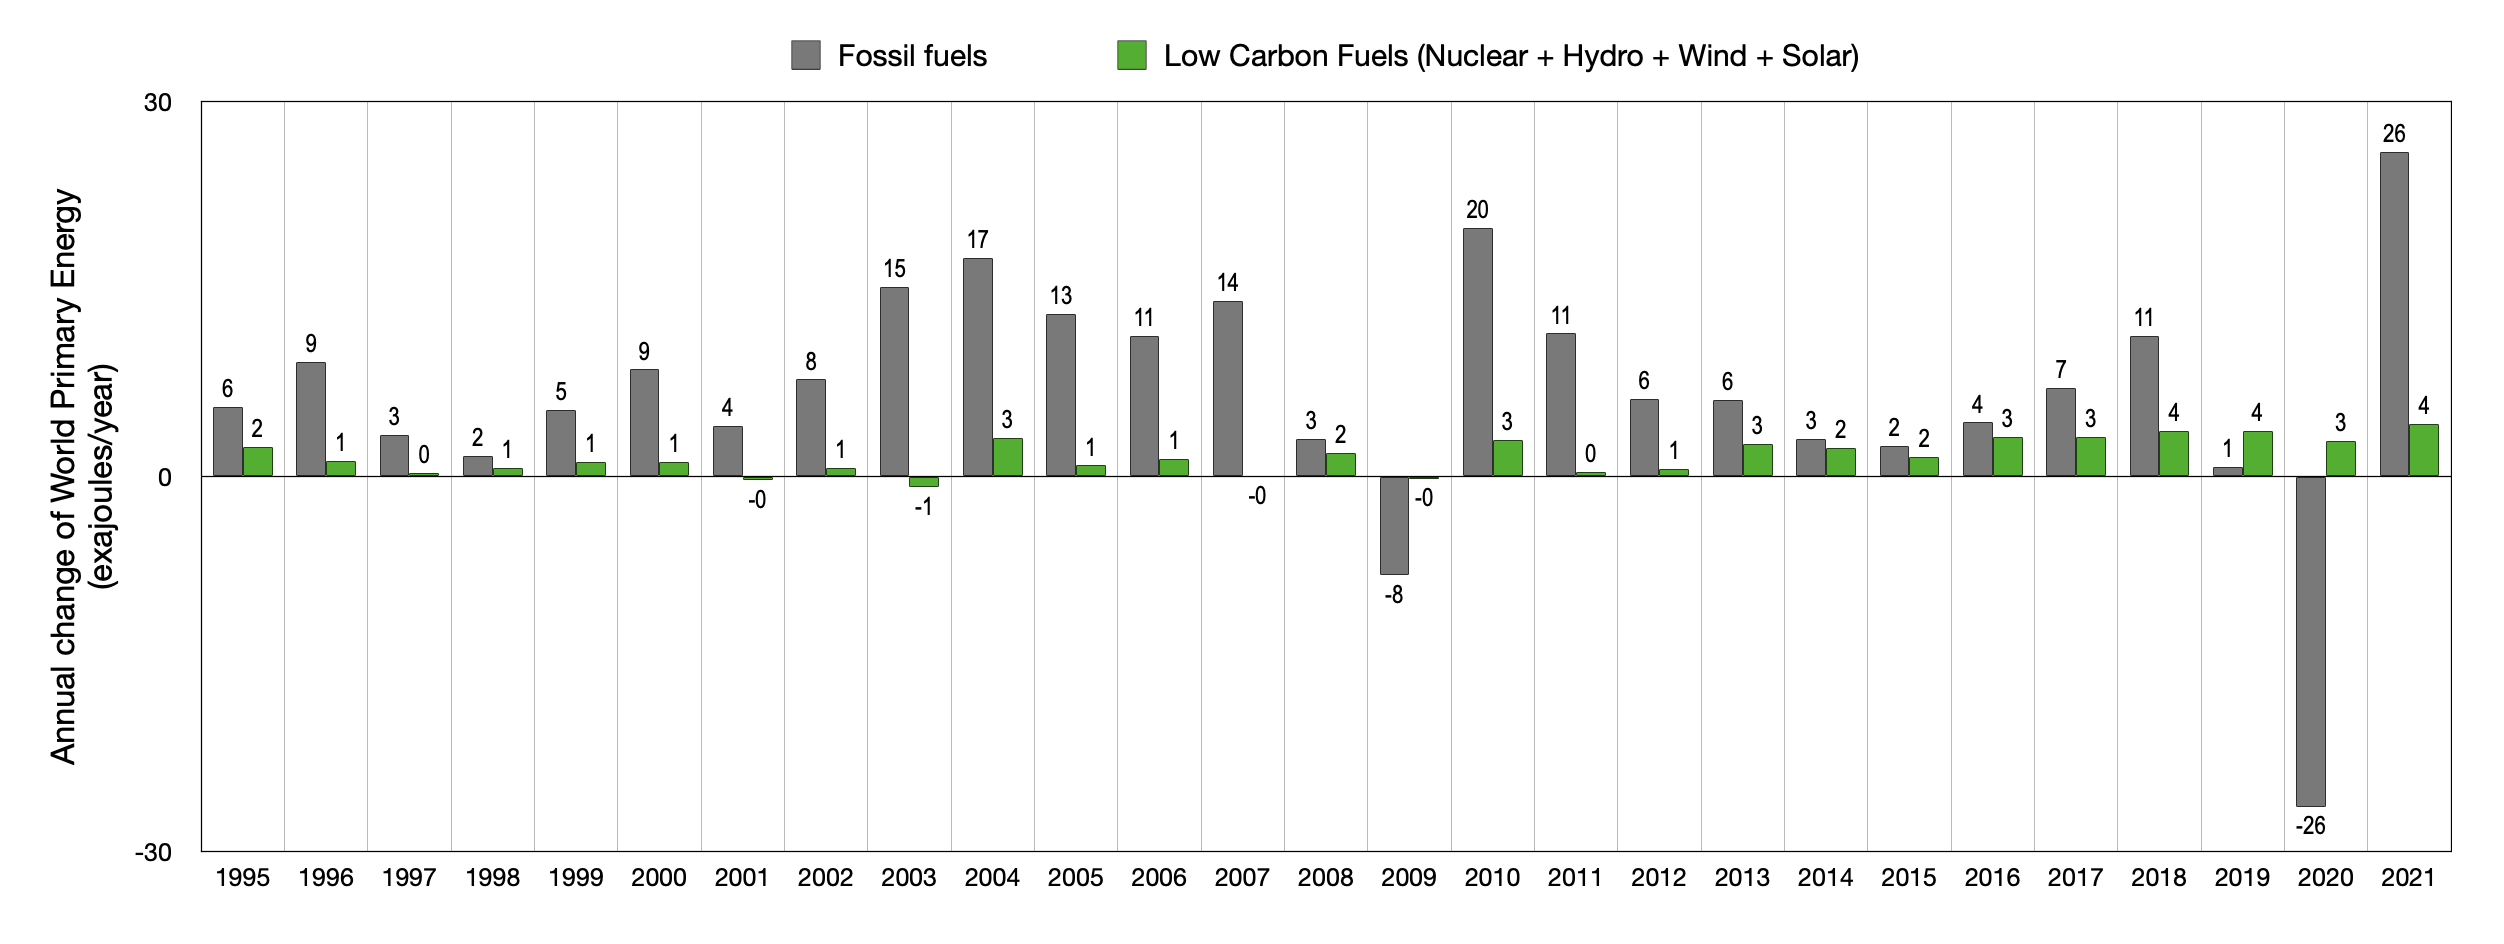
Data: bp Statistical Review of World Energy 202135 36 37.
Value shown at the top of columns is annual change, rounded, in units of exajoules per year.
Charts 5 to 7 show the change of fossil fuel CO2 emissions for regions and countries since 1995, the year of COP138.
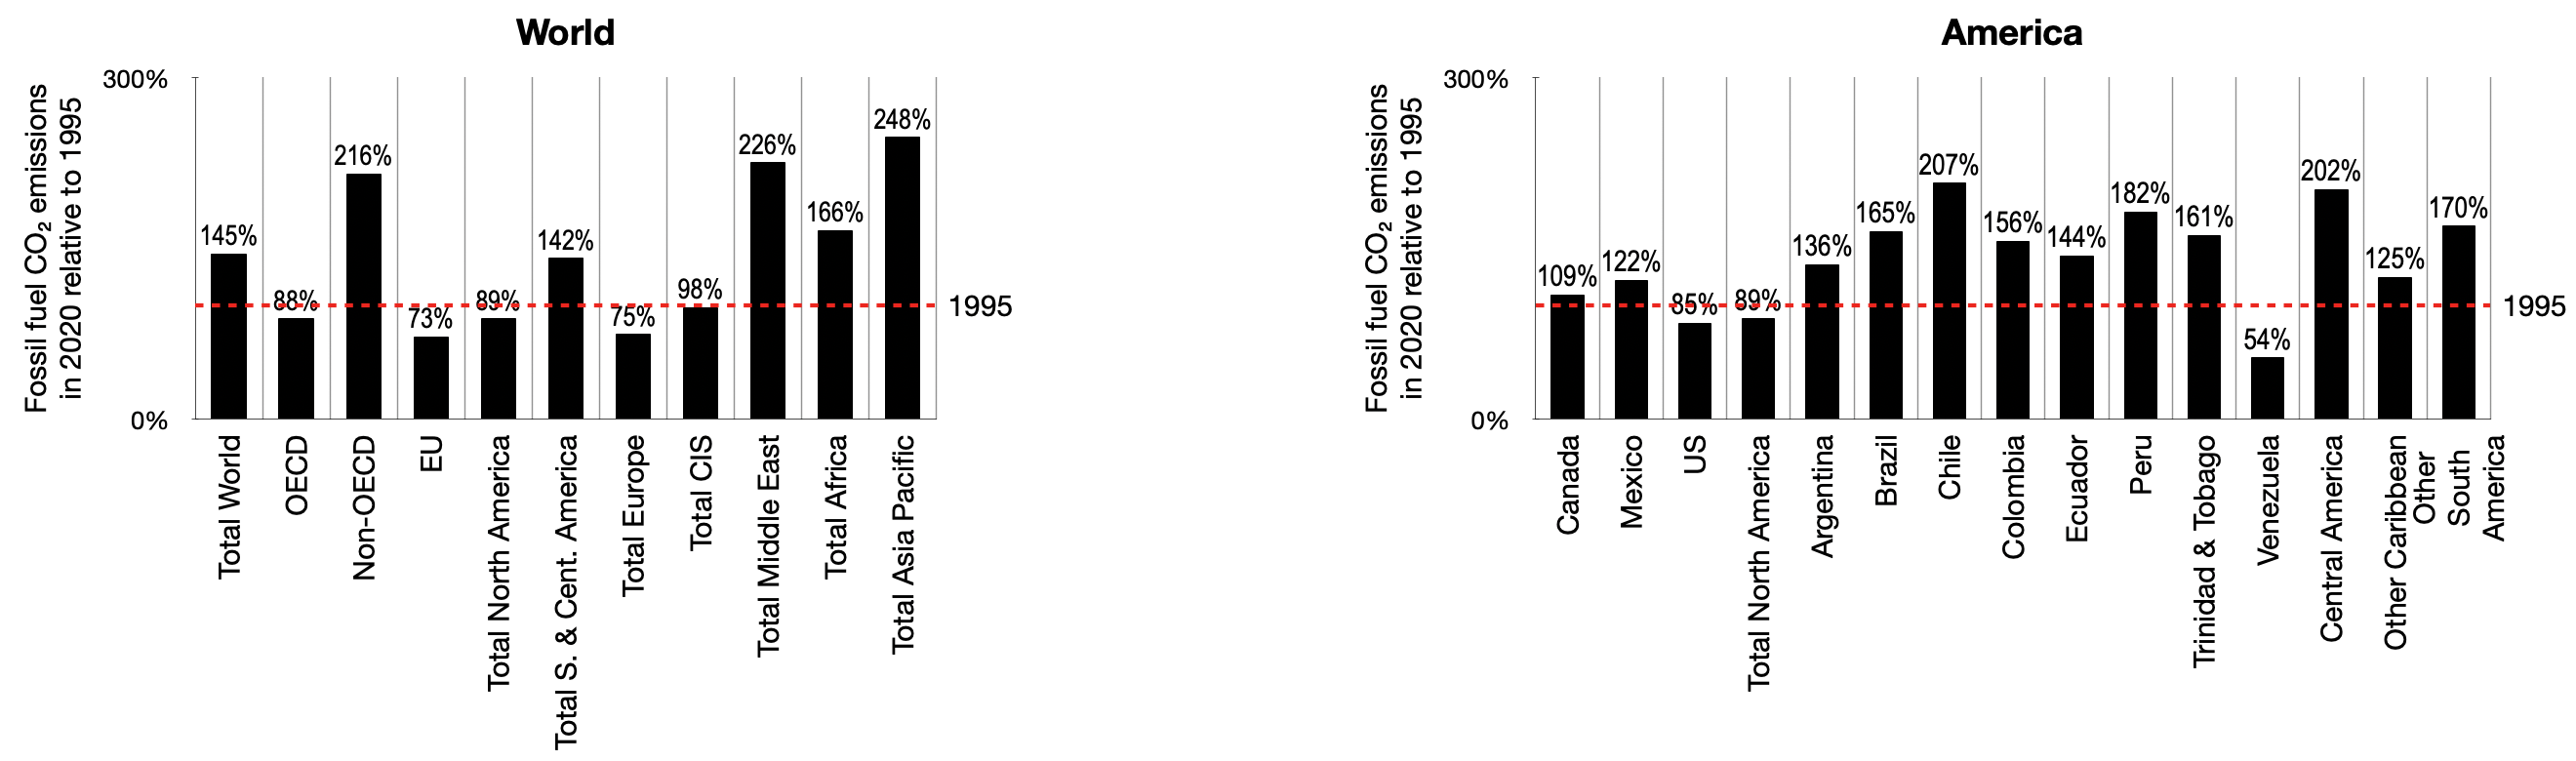
Data: Calculated using bp Statistical Review of World Energy 202131. Dashed line indicates 100% and therefore no change.
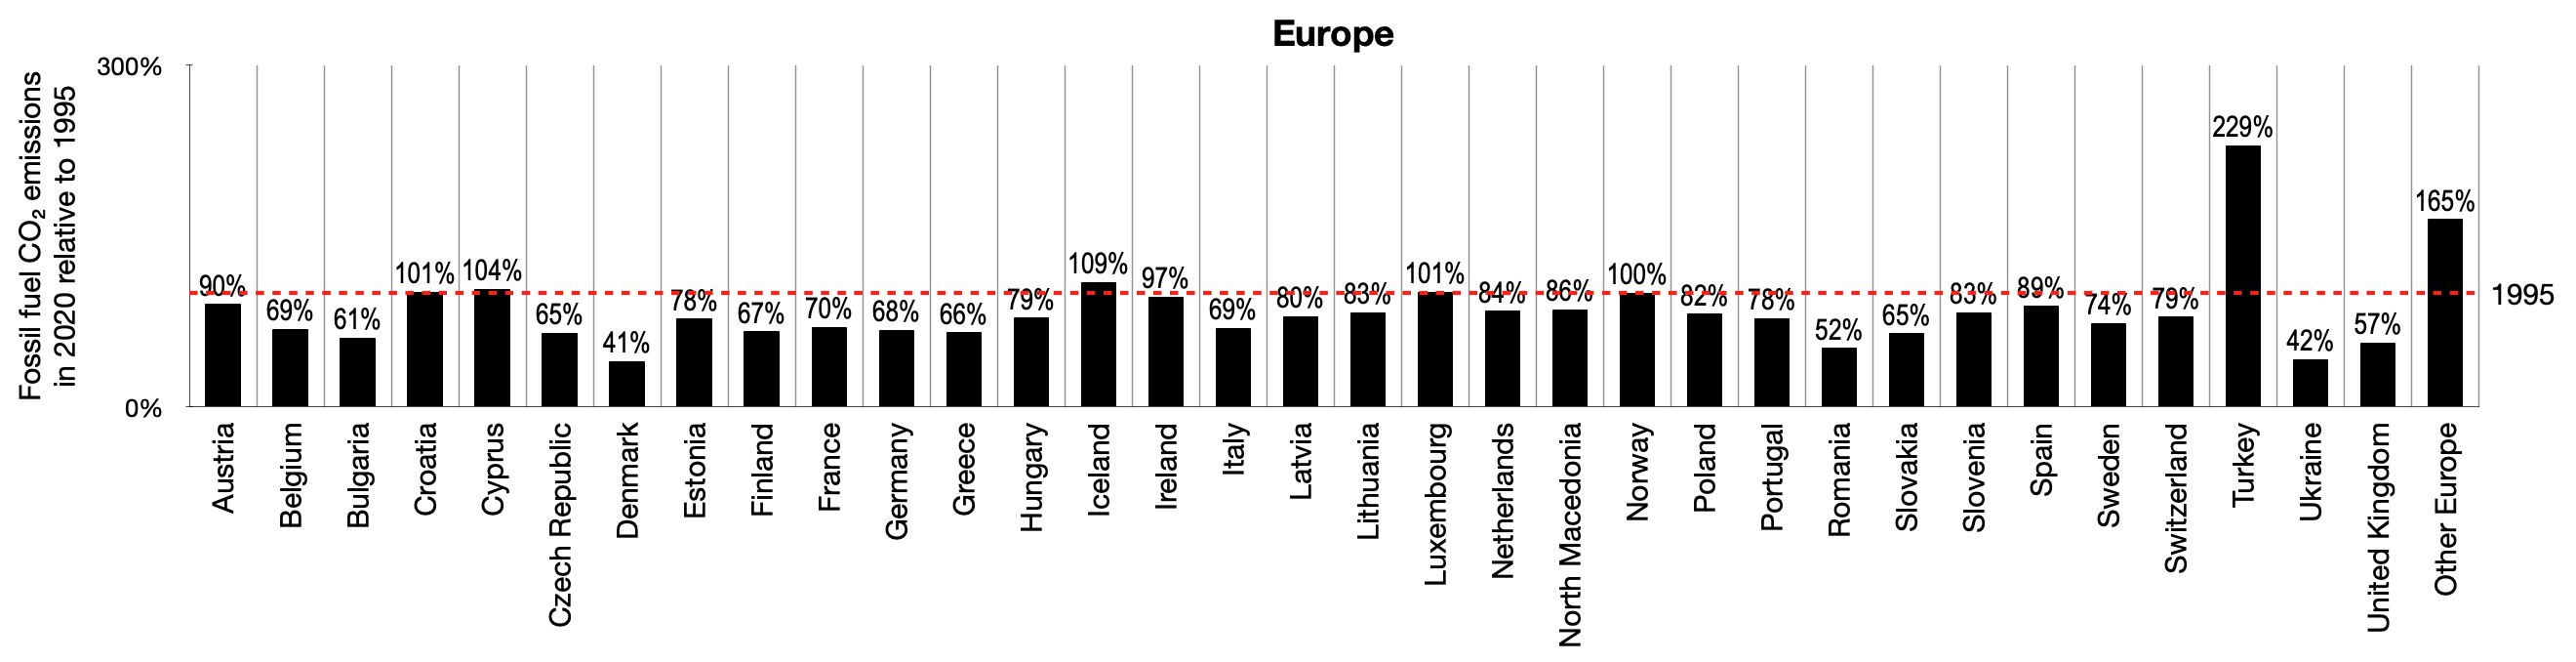
Data: Calculated using bp Statistical Review of World Energy 202131. Dashed line indicates 100% and therefore no change.
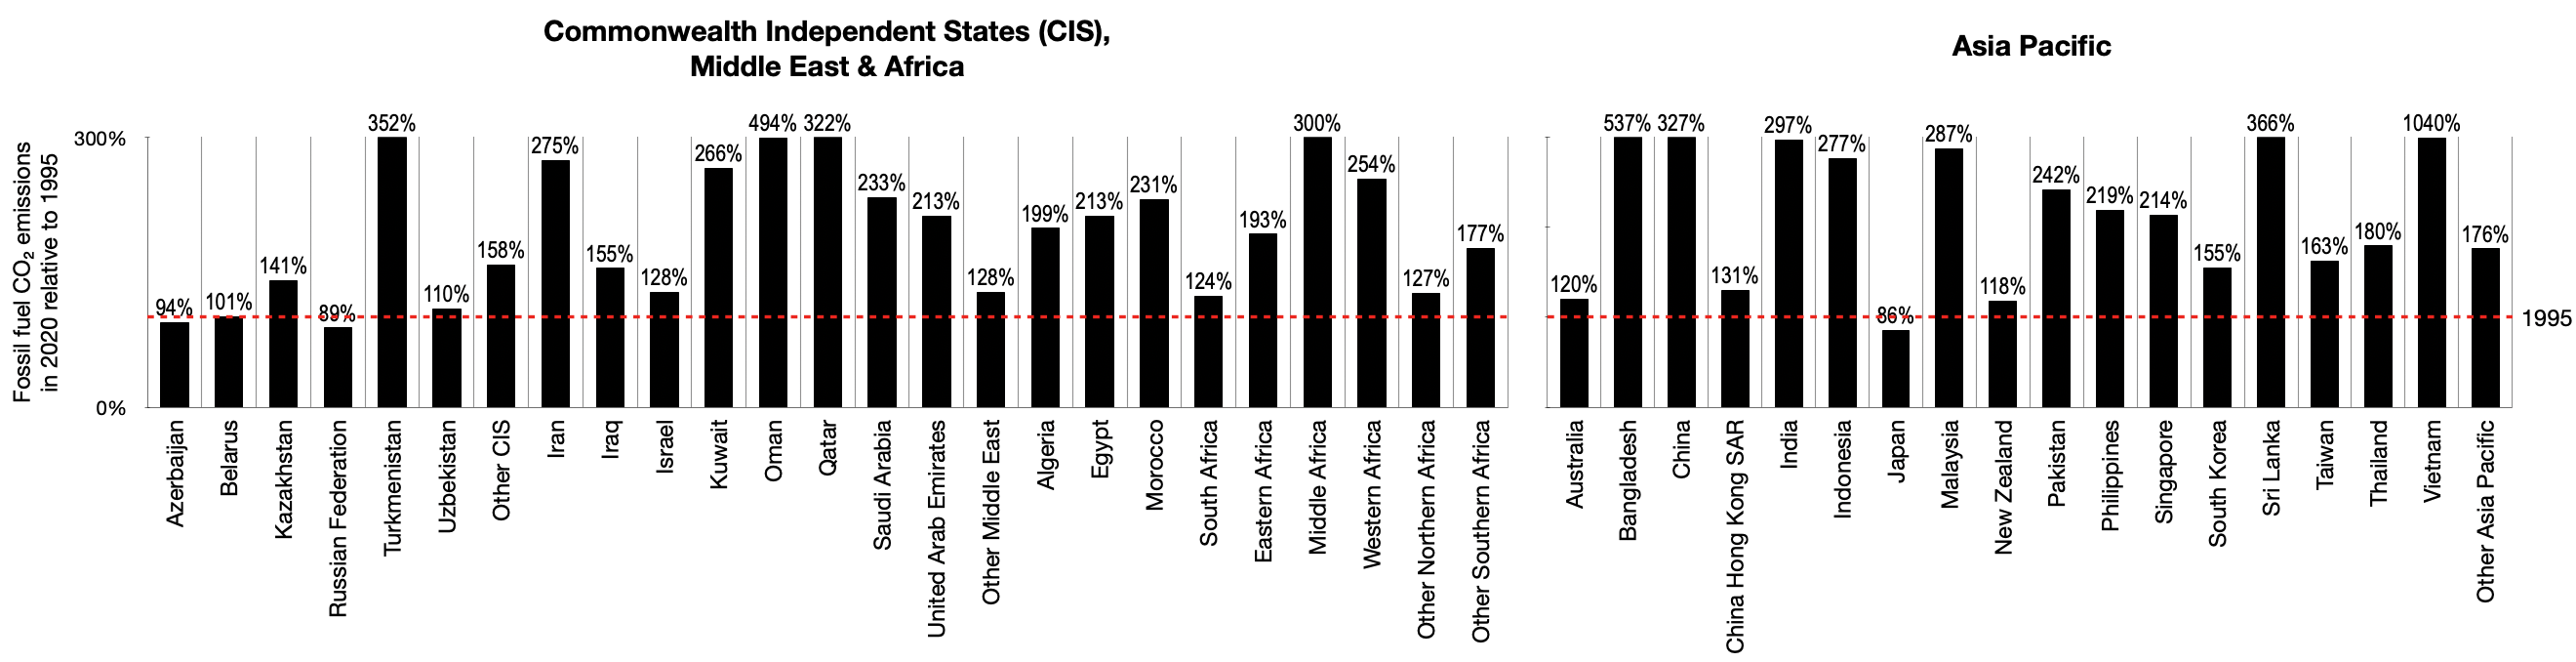
Data: Calculated using bp Statistical Review of World Energy 202131. Dashed line indicates 100% and therefore no change.
What to do?
Two prominent efforts have pursued solutions: the UN’s climate treaty relying on the science of the IPCC (explained in 1.5˚C), and the efforts of Dr James Hansen39 (explained in 350 ppm). The most important finding of both is that it’s too late for decarbonisaton alone, and now ‘negative emission technologies’ (NETs), also known as ‘carbon dioxide removal’ (CDR) methods, are now required (this includes measures to increase natural carbon sinks such as reforestation).
Negative emissions are a burden being imposed on young people.
Hansen, Young people’s burden: requirement of negative CO2 emissions40.
To stabilise our warming commitment, emissions of CO2 need to be made net-zero. Excluding geoengineering schemes designed to lower incoming solar radiation, this can only be achieved by decarbonising to the lowest level possible (i.e. a carbon-floor), and then balancing this level of emissions with NETs. To further lower warming, NETs must be scaled-up. The faster emissions are reduced, the smaller this negative emissions burden.
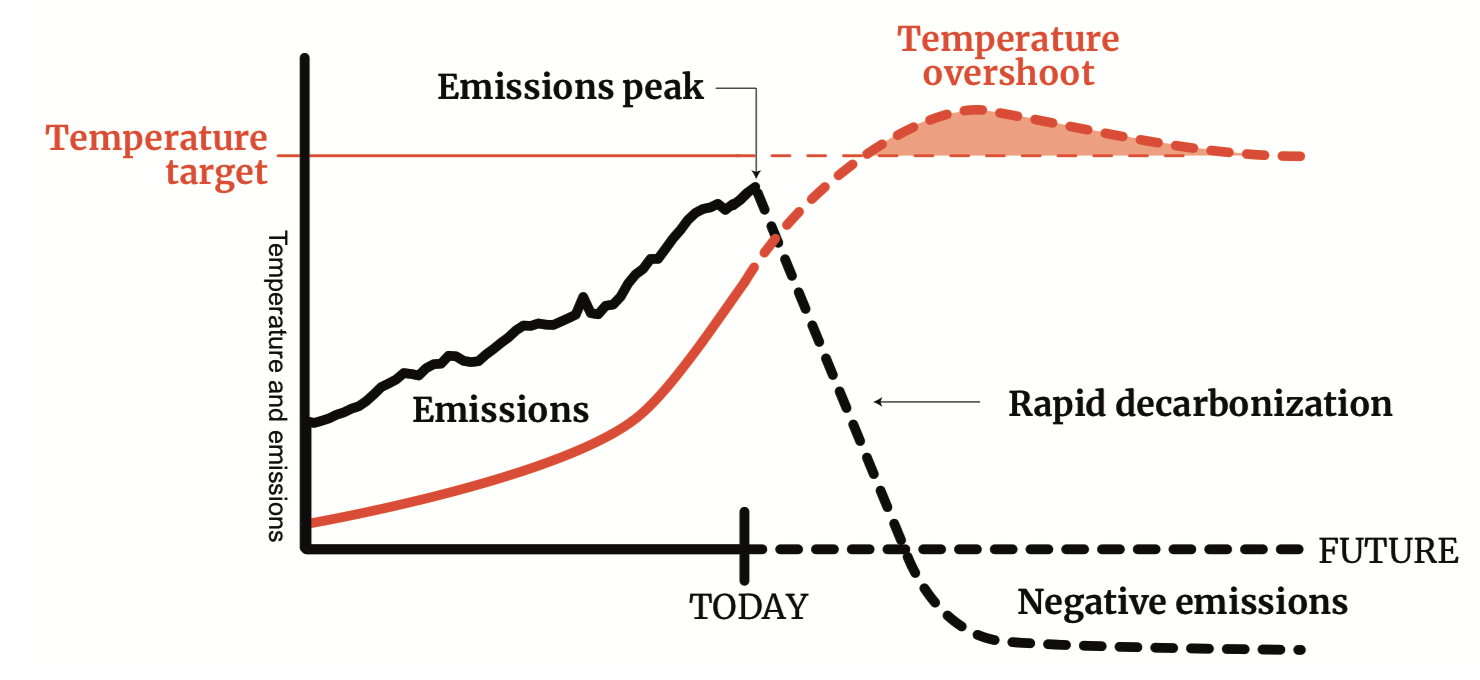
The scale of the decarbonisation challenge to meet the Paris Agreement is underplayed in the public arena. It will require precipitous emissions reductions within 40 years and a new carbon sink on the scale of the ocean sink. Even then, the world is extremely likely to overshoot. A catastrophic failure of policy, for example, waiting another decade for transformative policy and full commitments to fossil-free economies, will have irreversible and deleterious repercussions for humanity’s remaining time on Earth. Only a global zero carbon roadmap will put the world on a course to phase-out greenhouse gas emissions and create the essential carbon sinks for Earth-system stability, without which, world prosperity is not possible.
Rockström, J. et al. (2016), The world’s biggest gamble42.
The IPCC’s 1.5℃ pathways demand that CO2 emissions are roughly halved by 203043, and over the next 30 years negative emissions are ramped up so that by 2050, an amount of CO2 will have been removed from the atmosphere equivalent to that removed by the world’s ocean over a period of 15 years (about 150GtCO2). By this time, these negative emissions will need to be so vast that that the total annual removal of CO2 will be equivalent to that annually removed by the global ocean26. These pathways have only a 50% to 66% chance of success44 and large uncertainties remain concerning the feasibility and impact of large-scale deployment of negative emission technologies45.
Dr James Hansen39 prescribes changes needed to reduce atmospheric CO2 to less than 350 ppm, in order to limit global temperature close to the Holocene range. CO2 emissions must be reduced by one third by 2030 and the negative emissions burden is the same as that prescribed by the IPCC above46. Despite decarbonisation being slower than in the IPCC’s 1.5˚C pathways, Hansen’s modelling results in warming being limited to less than 1°C, hopefully averting multi-metre sea level rise.
What time remains?
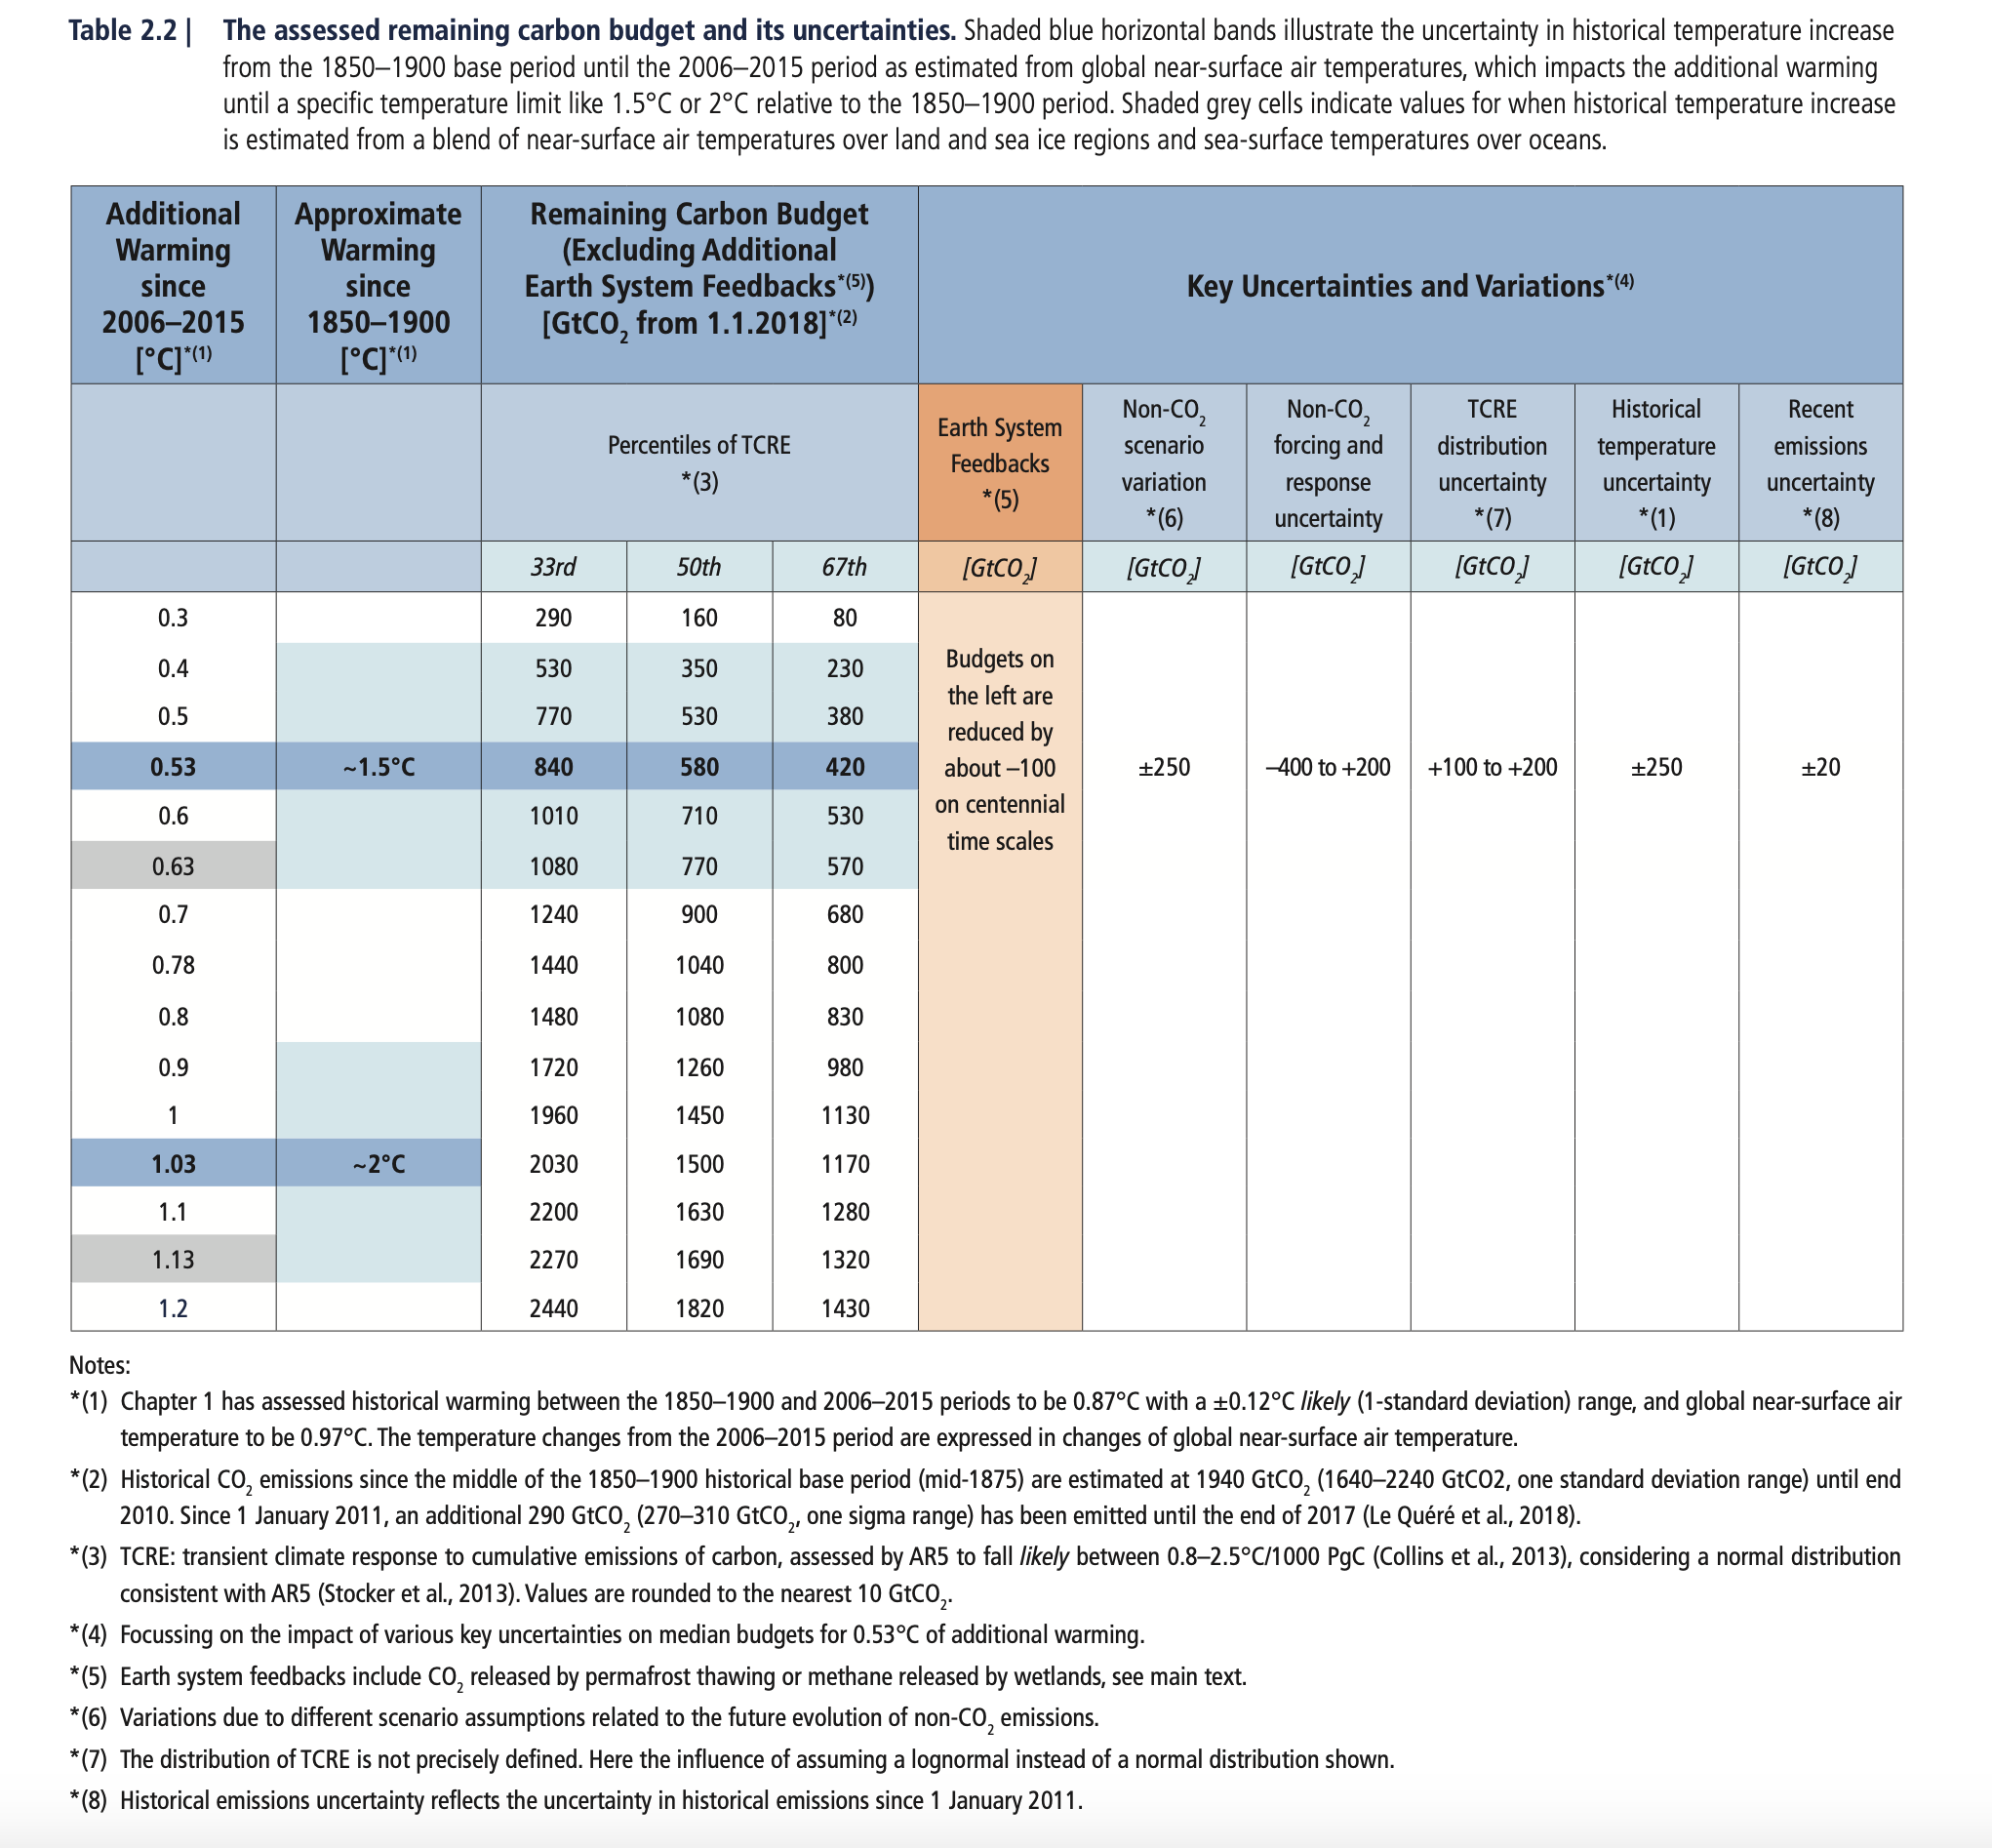
The remaining carbon budget from 2018 onwards is 580GtCO2 for a 50% chance of keeping warming below 1.5˚C. This is less than 15 years of global emissions at current rates47.
So, what does that mean?
This means that if we start reducing emissions steeply now and by the time we reach net-zero levels we have not emitted more than 580GtCO2, our best scientific understanding tells us have we expect a one-in-two chance that warming would be kept to 1.5˚C.
Moreover, if we want to be sure that this is also true until the end of the century, we’d have to aim to emit only 480GtCO2 until we reach net-zero instead. This is under 12 years of current emissions.
‘A new approach for understanding the remaining carbon budget’, Dr Joeri Rogelj, Prof Piers Forster, CarbonBrief 201948.
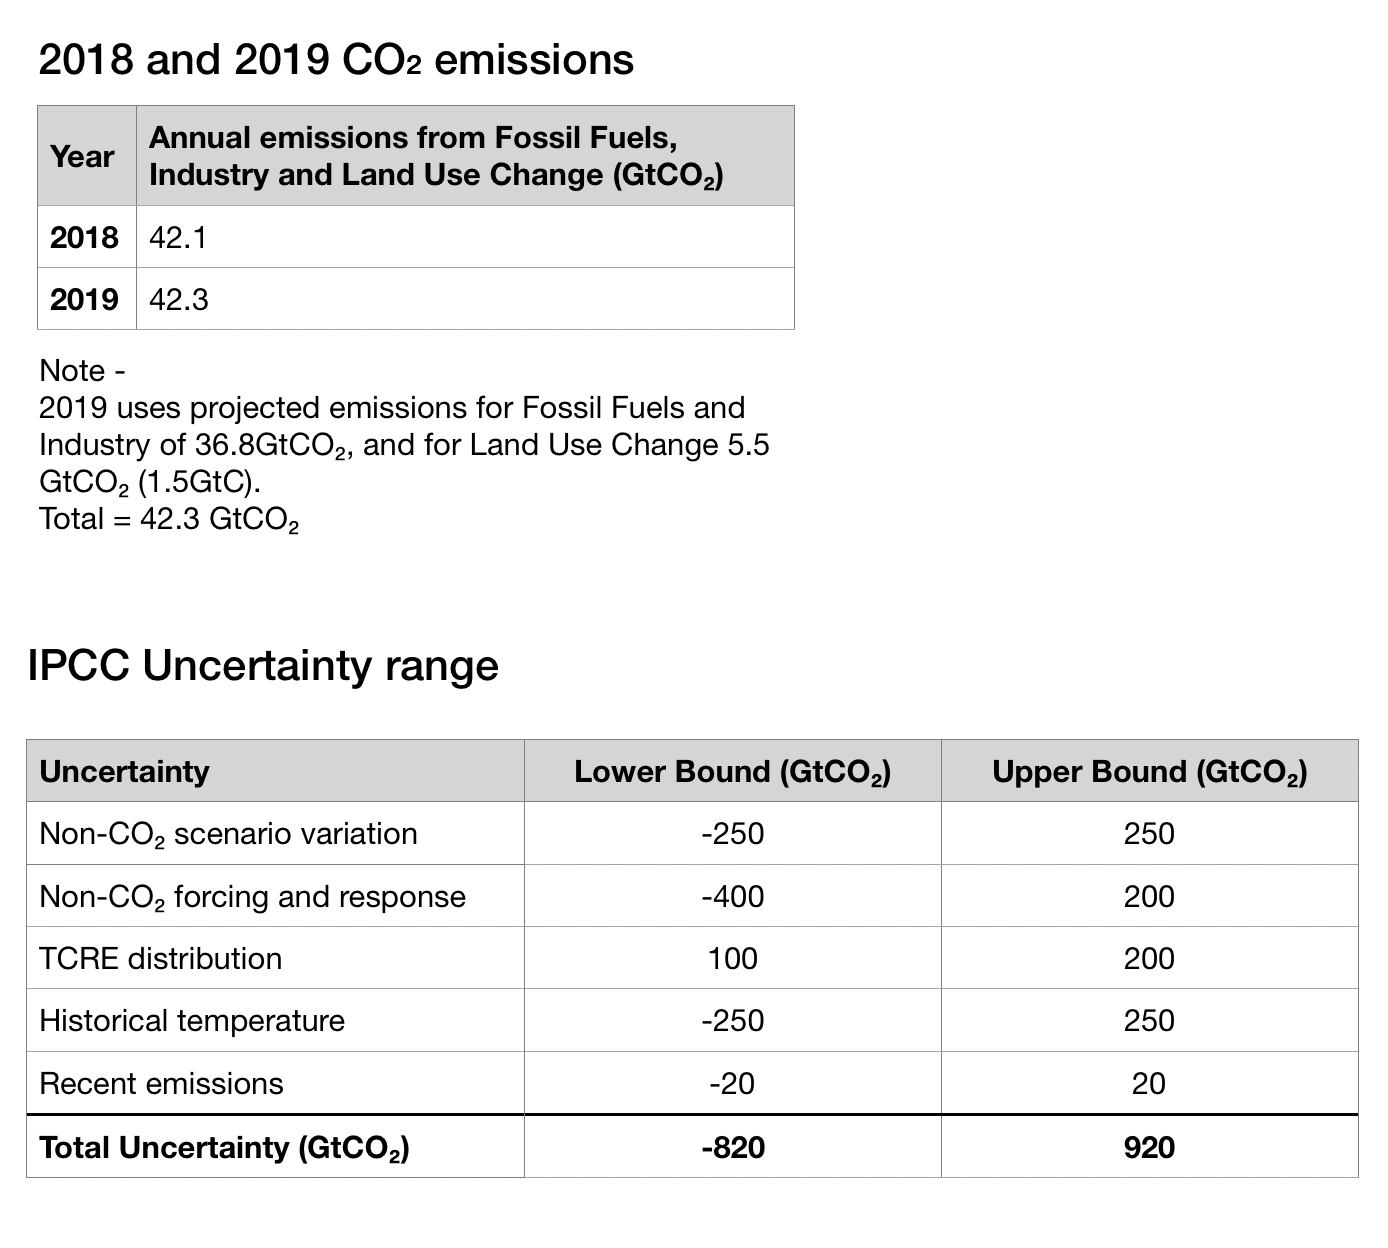
The remaining CO2 carbon budgets from 2020 onwards are listed below in table 1, calculated by subtracting the annual emissions of years 2018 and 2019 (shown in the supporting information below), away from the IPCC’s budgets shown in table 3. Also shown are the same remaining budgets with 50% of total uncertainties applied in either direction (50% was chosen because it would be unlikely for all uncertainties to align at an extremity). Note that 50th percentile of climate sensitivity refers to the most likely value.
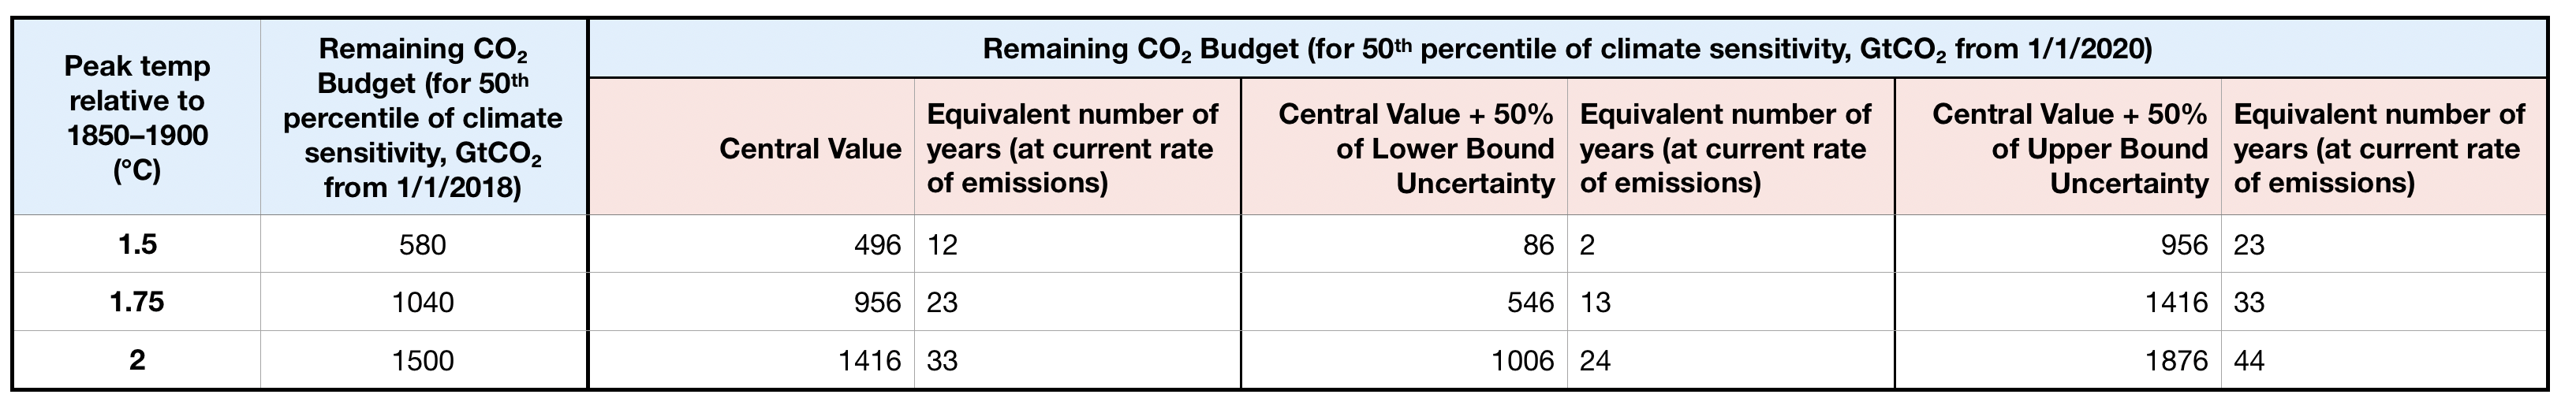
Table 1 shows the IPCC’s remaining CO2 budget for 1.5˚C may be spent by 2032. The usefulness of IPCC budgets is questionable because associated with each budget are very large uncertainties and warming that will trigger rapid and large sea level rise. Exceeding any budget doesn’t herald the end of our chance to limit and reduce warming. Instead it should be a very loud alarm that reminds us our greenhouse gas emissions remain dangerously excessive and unmanaged.
Sadly, the world’s energy system remains intensively fossil fuelled50, ‘every year energy use increases, & most of the increases come from fossil fuels’33, emission offsets are falsehoods51, and there is no time left for half-measures; ‘winning slowly is the same as losing’52.
Supporting information
- https://phys.org/news/2021-07-covid-recovery-all-time-emissions-high.html[↩]
- Kopp, R. E., R. M. Horton, C. M. Little, J. X. Mitrovica, M. Oppenheimer, D. J. Rasmussen, B. H. Strauss, and C. Tebaldi (2014), Probabilistic 21st and 22nd century sea-level projections at a global network of tide-gauge sites, Earth’s Future, 2, 383–406, doi:10.1002/2014EF000239, https://agupubs.onlinelibrary.wiley.com/doi/full/10.1002/2014EF000239[↩][↩]
- section titled ‘Sea Level Rise’, https://www.worldenergydata.org/existential-threat-pt1/[↩]
- https://phys.org/news/2021-08-global-paris-limit.html[↩]
- https://coastal.climatecentral.org[↩]
- https://coastal.climatecentral.org[↩]
- https://link.springer.com/article/10.1007/s10584-011-0151-4[↩]
- table 2,1. p. 60, AR5 Synthesis Report – Climate Change 2014
IPCC, 2014: Climate Change 2014: Synthesis Report. Contribution of Working Groups I, II and III to the Fifth Assessment Report of the Intergovernmental Panel on Climate Change [Core Writing Team, R.K. Pachauri and L.A. Meyer (eds.)]. IPCC, Geneva, Switzerland, 151 pp., https://www.ipcc.ch/report/ar5/syr/[↩] - https://tntcat.iiasa.ac.at/RcpDb/dsd?Action=htmlpage&page=compare[↩]
- p 581, Hansen, J., Sato, M., Kharecha, P., von Schuckmann, K., Beerling, D. J., Cao, J., Marcott, S., Masson-Delmotte, V., Prather, M. J., Rohling, E. J., Shakun, J., Smith, P., Lacis, A., Russell, G., and Ruedy, R.: Young people’s burden: requirement of negative CO2 emissions, Earth Syst. Dynam., 8, 577-616, https://doi.org/10.5194/esd-8-577-2017, 2017[↩][↩][↩]
- p. 581-582, Hansen, J., Sato, M., Kharecha, P., von Schuckmann, K., Beerling, D. J., Cao, J., Marcott, S., Masson-Delmotte, V., Prather, M. J., Rohling, E. J., Shakun, J., Smith, P., Lacis, A., Russell, G., and Ruedy, R.: Young people’s burden: requirement of negative CO2 emissions, Earth Syst. Dynam., 8, 577-616, https://doi.org/10.5194/esd-8-577-2017, 2017[↩]
- https://public.wmo.int/en/our-mandate/climate/wmo-statement-state-of-global-climate[↩]
- Global Temperature in 2019, http://www.columbia.edu/~jeh1/mailings/2020/20200115_Temperature2019.pdf[↩]
- chart 4, https://www.worldenergydata.org/ghgs/[↩]
- Matthews, H.D., Gillett, N.P., Stott, P.A. and Zickfeld, K., 2009. The proportionality of global warming to cumulative carbon emissions. Nature, 459(7248), p.829., http://indiaenvironmentportal.org.in/files/The proportionality of global warming.pdf[↩]
- charts 1 and 3, https://www.worldenergydata.org/ghgs/[↩]
- Black trend line at https://www.esrl.noaa.gov/gmd/ccgg/trends/global.html[↩]
- WMO Statement on the State of the Global Climate in 2017, http://public.wmo.int/en/our-mandate/climate/wmo-statement-state-of-global-climate[↩]
- Chart 2 of https://www.worldenergydata.org/anthropogenic-co2-emissions/[↩]
- Chart 9 of https://www.worldenergydata.org/ghg-emissions/[↩]
- Data from 1850 to 1978 inclusive: p. 1404, Table AII.1.2 IPCC, 2013: Annex II: Climate System Scenario Tables [Prather, M., G. Flato, P. Friedlingstein, C. Jones, J.-F. Lamarque, H. Liao and P. Rasch (eds.)]. In: Climate Change 2013: The Physical Science Basis. Contribution of Working Group I to the Fifth Assessment Report of the Intergovernmental Panel on Climate Change [Stocker, T.F., D. Qin, G.-K. Plattner, M. Tignor, S.K. Allen, J. Boschung, A. Nauels, Y. Xia, V. Bex and P.M. Midgley (eds.)]. Cambridge University Press, Cambridge, United Kingdom and New York, NY, USA. https://www.ipcc.ch/site/assets/uploads/2017/09/WG1AR5_AnnexII_FINAL.pdf. Data from 1979 to 2021 inclusive: Ed Dlugokencky and Pieter Tans, NOAA/ESRL, https://www.esrl.noaa.gov/gmd/ccgg/trends/gl_data.html[↩]
- Ed Dlugokencky and Pieter Tans, NOAA/ESRL, https://www.esrl.noaa.gov/gmd/ccgg/trends/gl_data.html[↩][↩]
- CO2 emissions from fossil fuel combustion and cement: (i) in 1980 = 5.29GtC; (ii) in 1995 = 6.37GtC; and (iii) in 2019 = 9.95GtCO2. 2019 with respect to 1980 = 9.95/5.29 = +88%, and 2019 with respect to 1995 = 9.95/6.37 = +56%[↩]
- Global Carbon Project (2020). Supplemental data of Global Carbon Budget 2020 (Version 1.0) [Data set]. Global Carbon Project, https://www.icos-cp.eu/science-and-impact/global-carbon-budget/2020, download labelled ‘2020 Global Budget v1.0’[↩]
- p.16, C.2.1, https://report.ipcc.ch/sr15/pdf/sr15_spm_final.pdf[↩]
- chart 6, https://www.worldenergydata.org/1-5c/[↩][↩]
- https://www.theguardian.com/environment/planet-oz/2017/may/09/planet-could-breach-15c-warming-limit-within-10-years-but-be-aware-of-caveats[↩]
- https://www.worldenergydata.org/unfccc/[↩]
- https://en.wikipedia.org/wiki/Financial_crisis_of_2007%E2%80%932008[↩]
- https://en.wikipedia.org/wiki/COVID-19[↩]
- https://www.bp.com/en/global/corporate/energy-economics/statistical-review-of-world-energy.html[↩][↩][↩][↩]
- Global Carbon Project (2020). Supplemental data of Global Carbon Budget 2020 (Version 1.0) [Data set]. Global Carbon Project, https://www.icos-cp.eu/science-and-impact/global-carbon-budget/2020, download labelled ‘2020 Global Budget v1.0’.[↩]
- Glen Peters, Research Director at Center for International Climate Research, https://twitter.com/peters_glen/status/1149219271236415489[↩][↩]
- https://en.wikipedia.org/wiki/United_Nations_Climate_Change_conference#1995:_COP_1,_Berlin,_Germany[↩]
- https://www.bp.com/en/global/corporate/energy-economics/statistical-review-of-world-energy.html[↩]
- bp does not fully account for biofuels, and these may not be carbon-neutral, as explained at https://www.worldenergydata.org/biofuels/[↩]
- Biofuels on this website are the summation of solid and liquid biofuels, and therefore ‘Biofuels + Other + Geothermal’ equals the summation of bp’s data for ‘Geo, Biomass and Other’ and ‘Biofuels’.[↩]
- https://en.wikipedia.org/wiki/United_Nations_Climate_Change_conference#1995:_COP_1,_Berlin,_Germany[↩][↩][↩][↩]
- http://www.columbia.edu/~jeh1/[↩][↩]
- https://www.earth-syst-dynam.net/8/577/2017/[↩]
- https://library.wmo.int/doc_num.php?explnum_id=5188[↩]
- p. 1, Rockström, J. et al. (2016), The world’s biggest gamble, Earth’s Future, 4, 465 – 470, doi:10.1002/2016EF000392, https://agupubs.onlinelibrary.wiley.com/doi/full/10.1002/2016EF000392[↩]
- chart 3, https://www.worldenergydata.org/1-5c/[↩]
- table 1, https://www.worldenergydata.org/1-5c/[↩]
- p. 121, IPCC Special Report on 1.5°C, J. Rogelj, D. Shindell, K. Jiang, S. Fifita, P. Forster, V. Ginzburg, C. Handa, H. Kheshgi, S. Kobayashi, E. Kriegler, L. Mundaca, R. Séférian, M. V. Vilariño, 2018, Mitigation pathways compatible with 1.5°C in the context of sustainable development. In: Global warming of 1.5°C. An IPCC Special Report on the impacts of global warming of 1.5°C above pre-industrial levels and related global greenhouse gas emission pathways, in the context of strengthening the global response to the threat of climate change, sustainable development, and efforts to eradicate poverty [V. Masson-Delmotte, P. Zhai, H. O. Pörtner, D. Roberts, J. Skea, P. R. Shukla, A. Pirani, W. Moufouma-Okia, C. Péan, R. Pidcock, S. Connors, J. B. R. Matthews, Y. Chen, X. Zhou, M. I. Gomis, E. Lonnoy, T. Maycock, M. Tignor, T. Waterfield (eds.)]. In Press. https://www.ipcc.ch/site/assets/uploads/sites/2/2018/11/SR15_Chapter2_Low_Res.pdf[↩]
- https://www.worldenergydata.org/350ppm/[↩]
- https://www.carbonbrief.org/analysis-fossil-fuel-emissions-in-2018-increasing-at-fastest-rate-for-seven-years[↩]
- https://www.carbonbrief.org/guest-post-a-new-approach-for-understanding-the-remaining-carbon-budget[↩]
- Global Carbon Project (2020). Supplemental data of Global Carbon Budget 2020 (Version 1.0) [Data set]. Global Carbon Project, https://www.icos-cp.eu/science-and-impact/global-carbon-budget/2020, download labelled ‘2020 Global Budget v1.0’.[↩]
- https://www.worldenergydata.org/world-total-energy-supply/[↩]
- https://www.worldenergydata.org/responsibilities/[↩]
- https://www.rollingstone.com/politics/politics-news/bill-mckibben-winning-slowly-is-the-same-as-losing-198205/[↩]
- p. 108, table 2.2, IPCC, 2018: Global Warming of 1.5°C. An IPCC Special Report on the impacts of global warming of 1.5°C above pre-industrial levels and related global greenhouse gas emission pathways, in the context of strengthening the global response to the threat of climate change, sustainable development, and efforts to eradicate poverty [Masson-Delmotte, V., P. Zhai, H.-O. Pörtner, D. Roberts, J. Skea, P.R. Shukla, A. Pirani, W. Moufouma-Okia, C. Péan, R. Pidcock, S. Connors, J.B.R. Matthews, Y. Chen, X. Zhou, M.I. Gomis, E. Lonnoy, T. Maycock, M. Tignor, and T. Waterfield (eds.)]. In Press. https://www.ipcc.ch/sr15/[↩]