Updated January 2024.
Final energy accounts the consumption of energy in final forms, consequently accounting for electricity separately from heat (e.g oil products conumed by transport). This is opposed to other measures such as ‘Primary energy’ that accounts for energy prior to conversions to electricity (see the introduction for explanation).
This page uses IEA data to display final energy (i.e energy consumption), for which the most recent year at time of publishing (Jan 2024), is 2021. Alternative and more recent data from The Energy Institute, used on this site’s other pages is unsuitable for displaying final energy.
World final energy is shown below for years 1990, 2020 and 2021, with the electricity share expanded to show shares of generation from each fuel category.
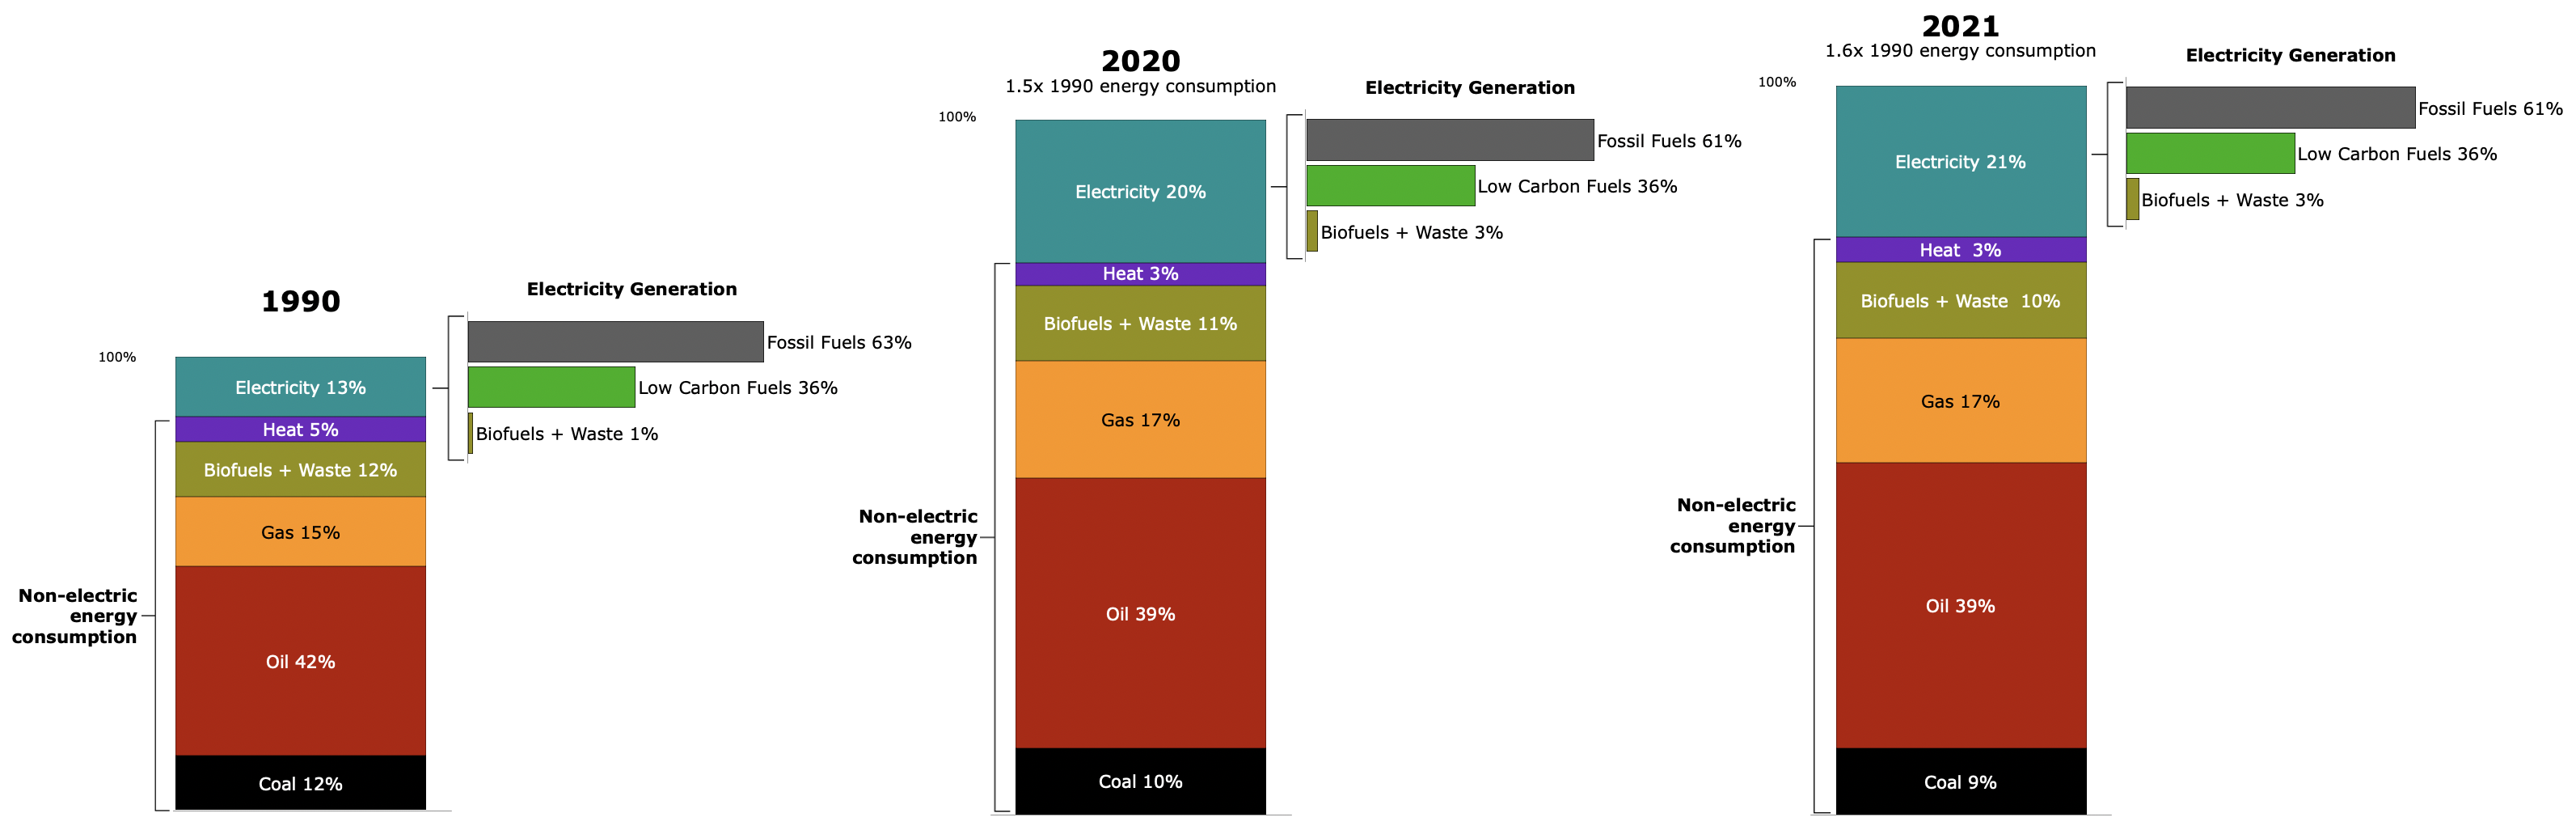
Total of displayed shares will not equal 100% because, for clarity, values are rounded and segments <1% share are not shown.
The Heat share refers to consumed heat produced by combined heat and power plants, and chemical reactions etc.
The height of each column is the total annual energy consumption relative to 1990.
Hydrogen (H₂) consumption is not specifically tallied in the IEA’s energy data. Perhaps it’s tallied in the “Heat” segment, but this isn’t clarified in the IEA’s definitions2, nor do their definitions reference hydrogen.
H₂ production in 2022 was 95Mt (https://www.iea.org/reports/hydrogen). At the rated energy content of 120 MJ/kg3, this was equivalent to 2.7% of world total final energy in 2021.
Low-emission hydrogen was less than 1% of global hydrogen production in 20224, equivalent to less than 0.027% of world final energy in 2021 (about one fortieth of one percent).
Little changed between 1990 and 2021, except for the increase of total annual energy consumption, as shown by the increased column heights. Decarbonisation requires a much greater share of electricity, but that grew from only 13 to 21%.
The share of low carbon electricity generation in 2021 matched that in 1990, mainly because the increased share of wind and solar was only enough to replace the share lost by nuclear and hydro, as shown in chart 4 of World Electricity Generation (note that page uses a different data set showing more recent values).
- https://www.iea.org/data-and-statistics/data-tools/energy-statistics-data-browser?country=WORLD&fuel=Energy%20supply&indicator=TESbySource[↩]
- https://iea.blob.core.windows.net/assets/25266100-859c-4b9c-bd46-cc4069bd4412/WORLDBAL_Documentation.pdf[↩]
- https://www.energy.gov/eere/fuelcells/hydrogen-storage[↩]
- https://www.iea.org/reports/hydrogen[↩]