Updated December 2023.
To help explain how the increase of anthropogenic (of human origin) greenhouse gases (GHGs) heat the planet, physicist John Tyndall used a dam as an analogy1; if water continually flows into a dam and the dam’s wall is made higher, the dam holds more water than before, until it again overflows. In the same manner, the sun’s radiation continually enters Earth’s atmosphere, humanity has increased the atmospheric concentration of greenhouse gases, this will cause the atmosphere to hold more heat until again the same amount of energy arriving from the sun is released to space.
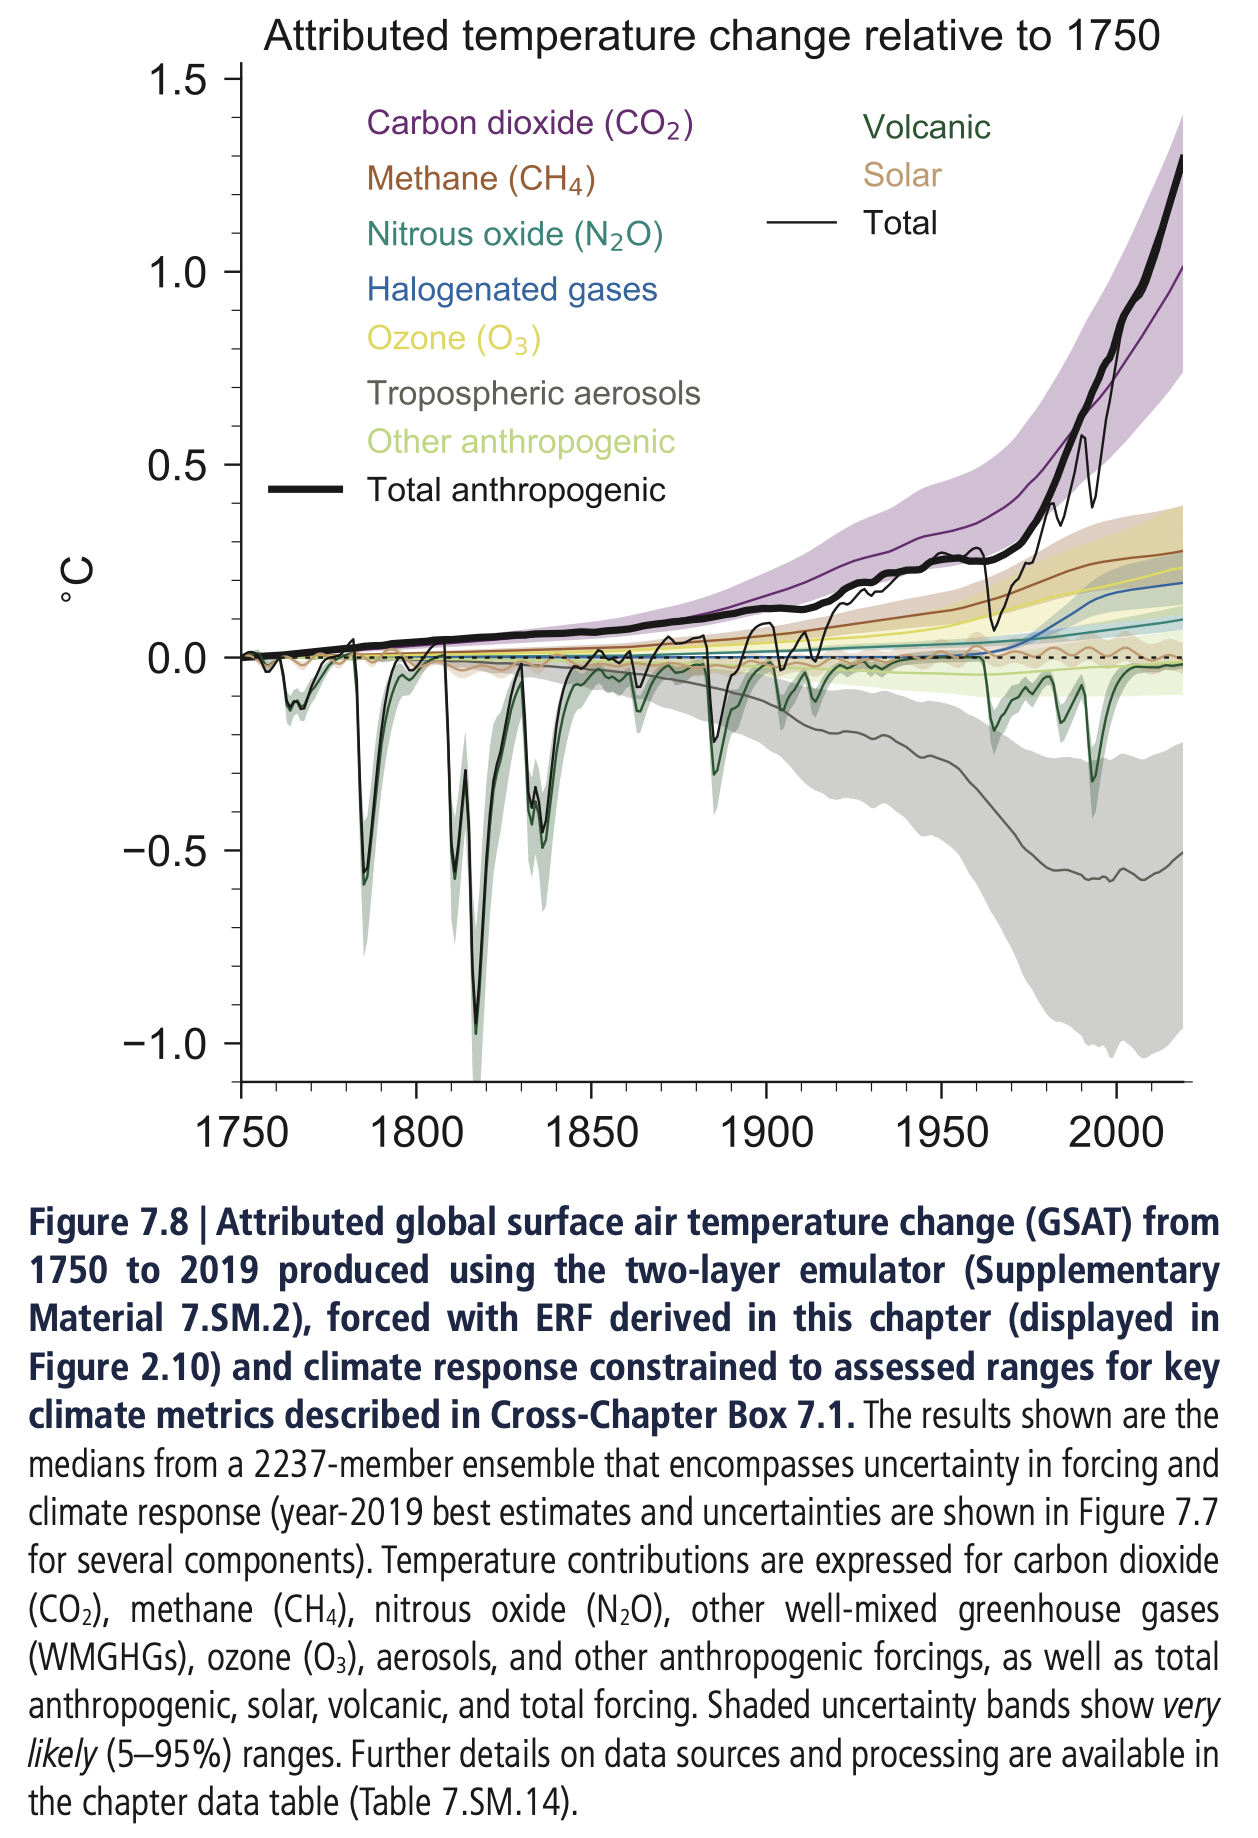
The temperature impact of each of our GHG emissions is shown below. Most recent values are shown on the left (2019 relative to 1750), and over time since 1750 on the right, indicating that carbon dioxide (CO2) is the only rapidly changing contributor.
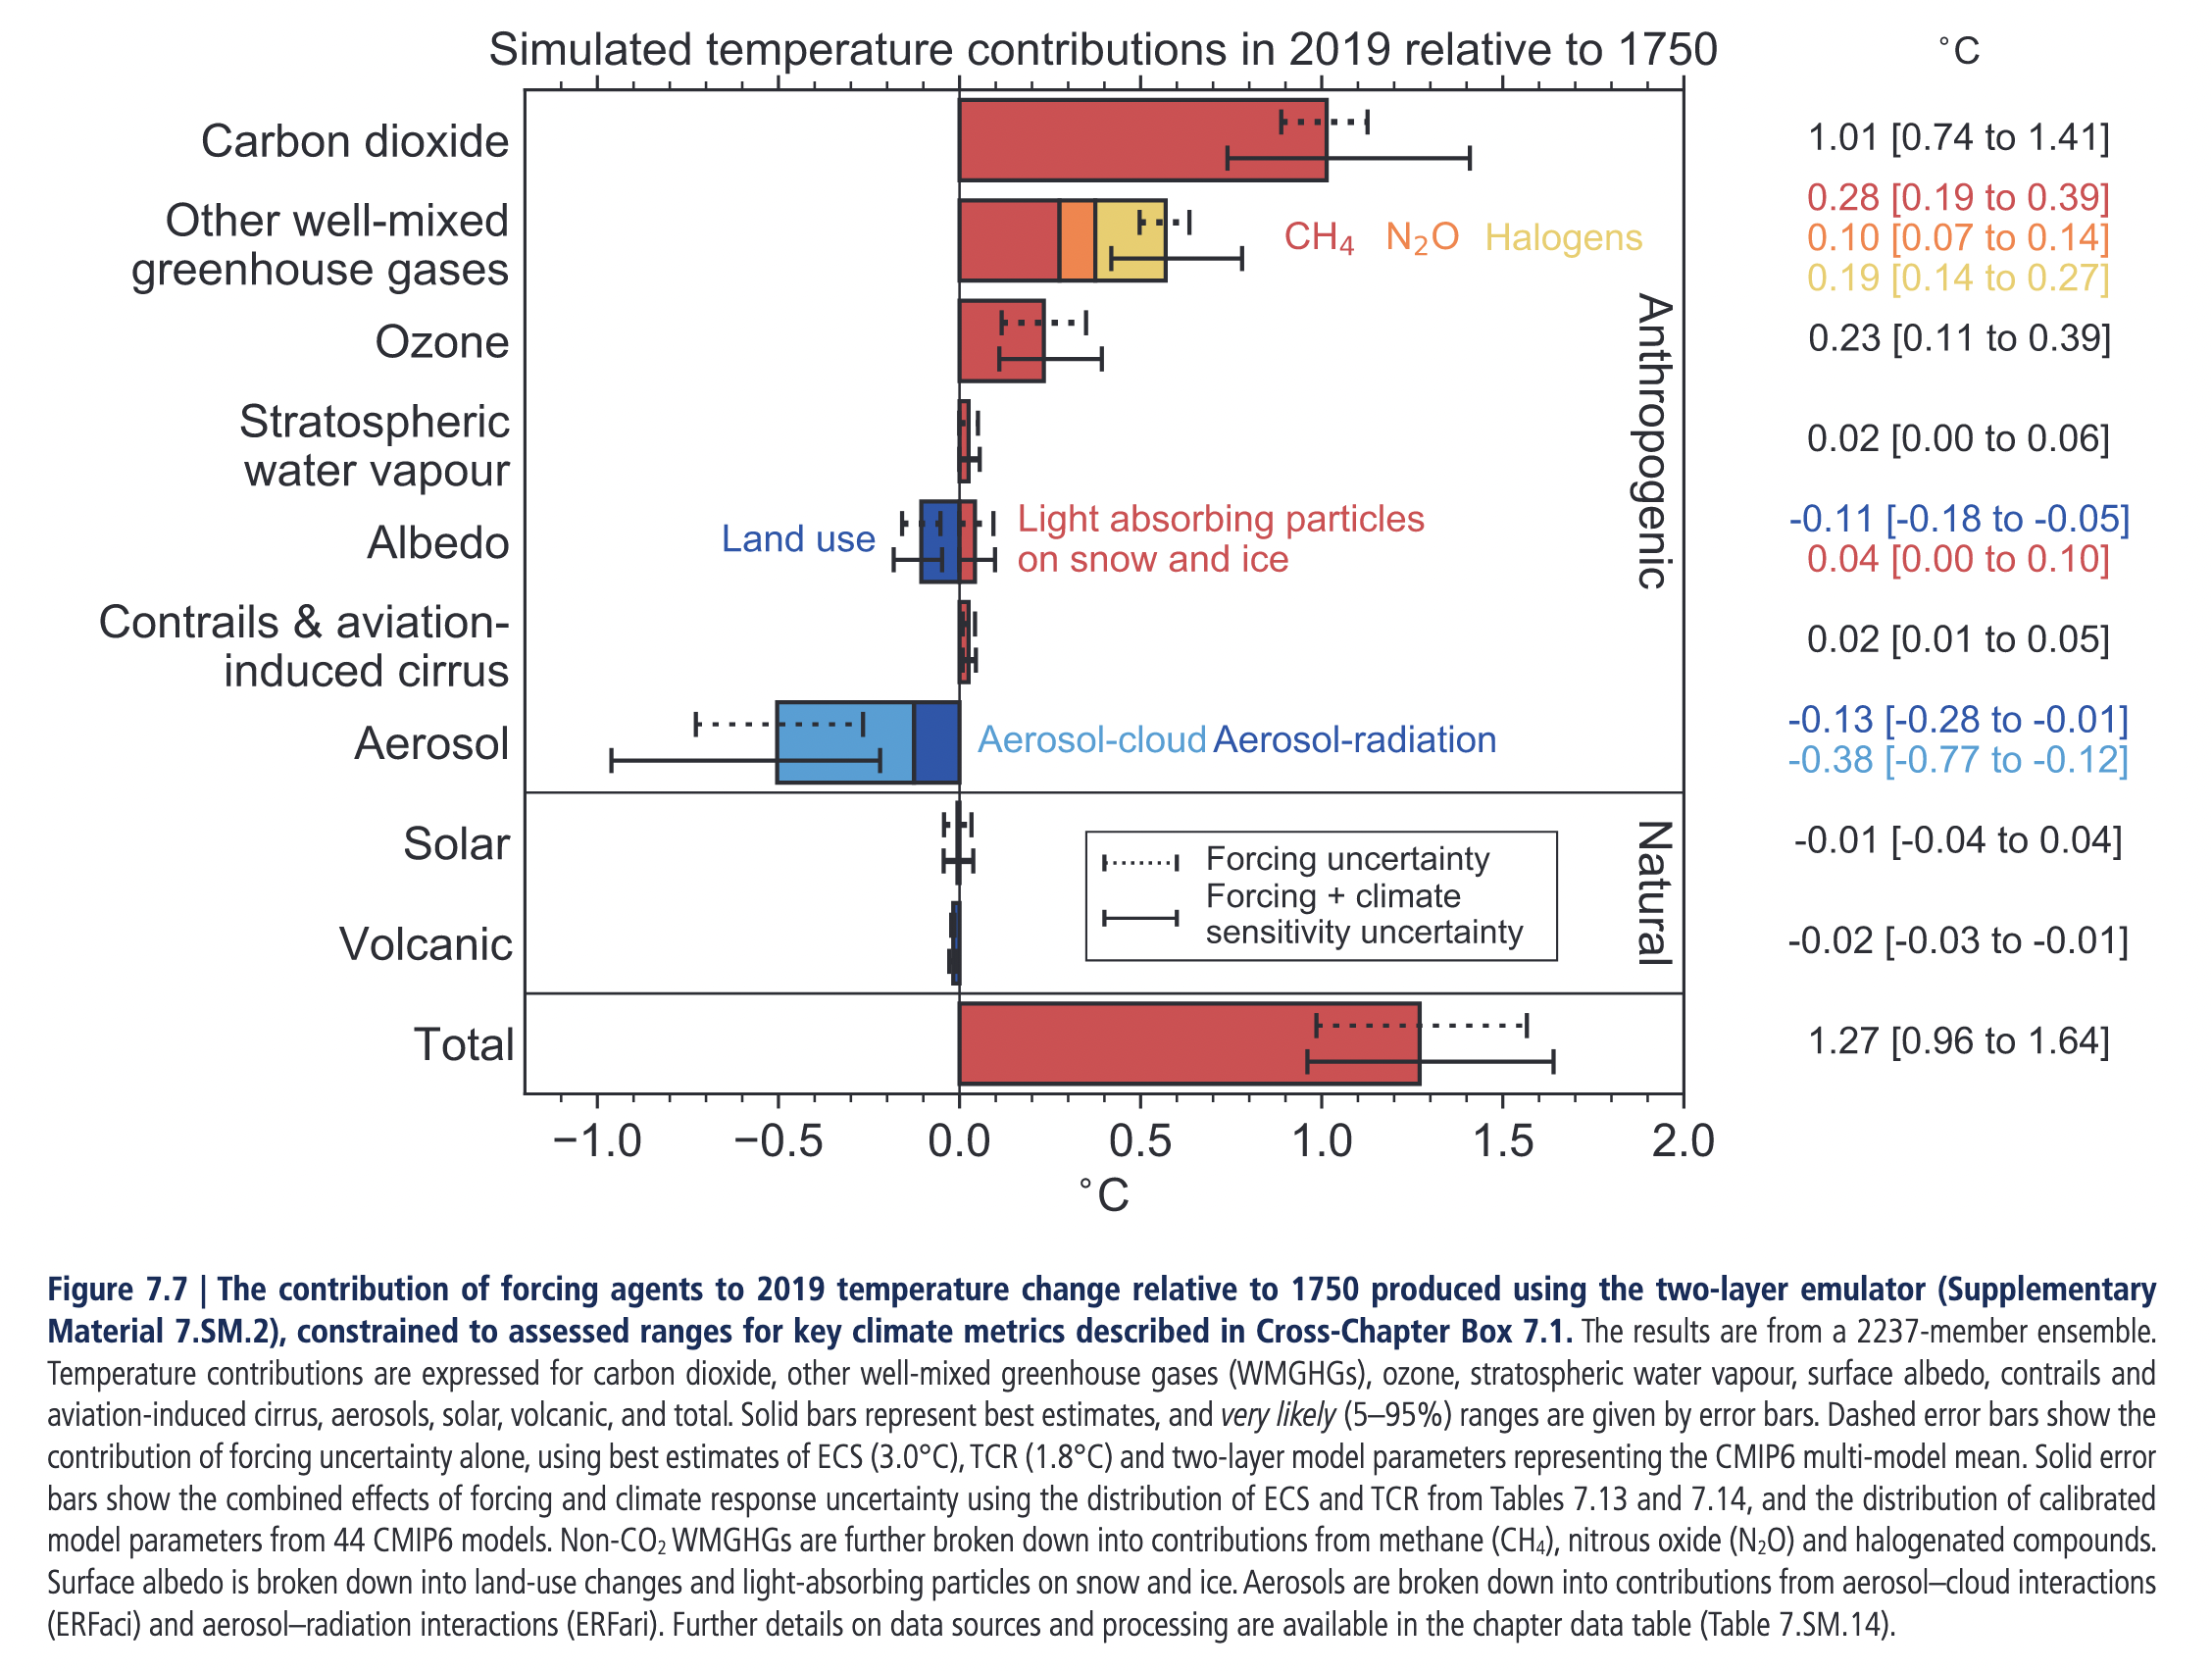
Chart 1. Contributions to warming in 2019 relative to 1750. Reference: IPCC, AR6, WG1, chapter 7, The Earth’s Energy Budget, Climate Feedbacks, and Climate Sensitivity2.
The total human forced global surface air temperature change from 1750 to 2019 is calculated to be 1.29 [1.00 to 1.65]°C (high confidence).
IPCC, AR6, WG1, chapter 7, The Earth’s Energy Budget, Climate Feedbacks, and Climate Sensitivity2.
Note that while the aim of the “Paris Agreement”4 is to hold the global average temperature to well below 2 °C above pre-industrial levels and to pursue efforts to limit the temperature increase to 1.5 °C above pre-industrial levels, it does not define “pre-industrial”. The IPCC’s “Special Report on Global Warming of 1.5˚C” states –
This IPCC Special Report on Global Warming of 1.5°C uses the reference period 1850–1900 to represent pre-industrial temperature. This is the earliest period with near-global observations and is the reference period used as an approximation of pre-industrial temperatures in the IPCC Fifth Assessment Report.
IPCC, FAQ Chapter 1, FAQ 1.25.
Carbon dioxide (CO2) accounts for 80% of warming6, methane (CH₄) 22%, and nitrous oxide (N₂O) 10%, all with a high level of confidence2. Cooling by aerosols accounts for -0.5˚C, with medium confidence2.
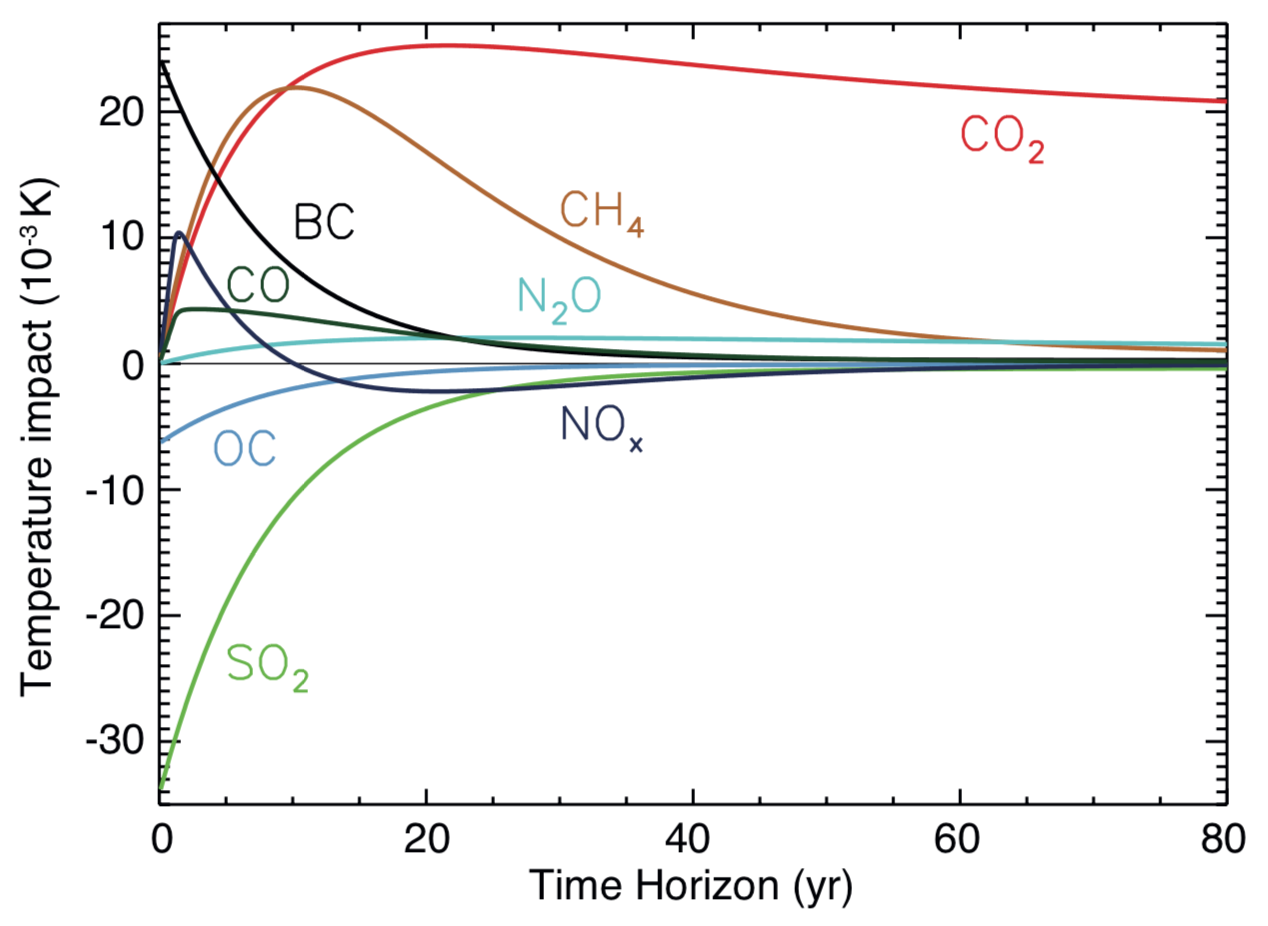
CO2 is a long-lived GHG, as shown by chart 3. Earth’s long term warming commitment is therefore almost solely determined by cumulative CO2 emissions (N2O7 is also a long-lived greenhouse gas that contributes to the warming commitment, but has a much smaller contribution as detailed above).
Chart 3 shows the warming response to a GHG emissions pulse, and chart 4 shows the warming response to sustained emissions (note that different colours are used in each). On a century–long timescale:
- a pulse emission of CO2 causes a stabilised value of warming;
- sustained emissions of CO2 causes ever increasing warming;
- a pulse emission of a short-lived GHG (e.g. methane, CH₄) causes a pulse of warming; and
- a sustained emission of a short-lived GHG causes a stabilised value of warming.
Therefore, in theory, elimination of short-lived GHG emissions would lower warming, and elimination of long-lived GHG emissions (CO2 and N₂O) would cause warming to stop increasing. To further lower warming, CO2 and N₂O would need to removed from the atmosphere. In practice, elimination of all anthropogenic sources of GHGs is not being proposed, and instead humanity will lower emissions of all GHGs to a ‘carbon floor’ to be managed within the planetary carbon budget (the ‘net-zero’ concept).
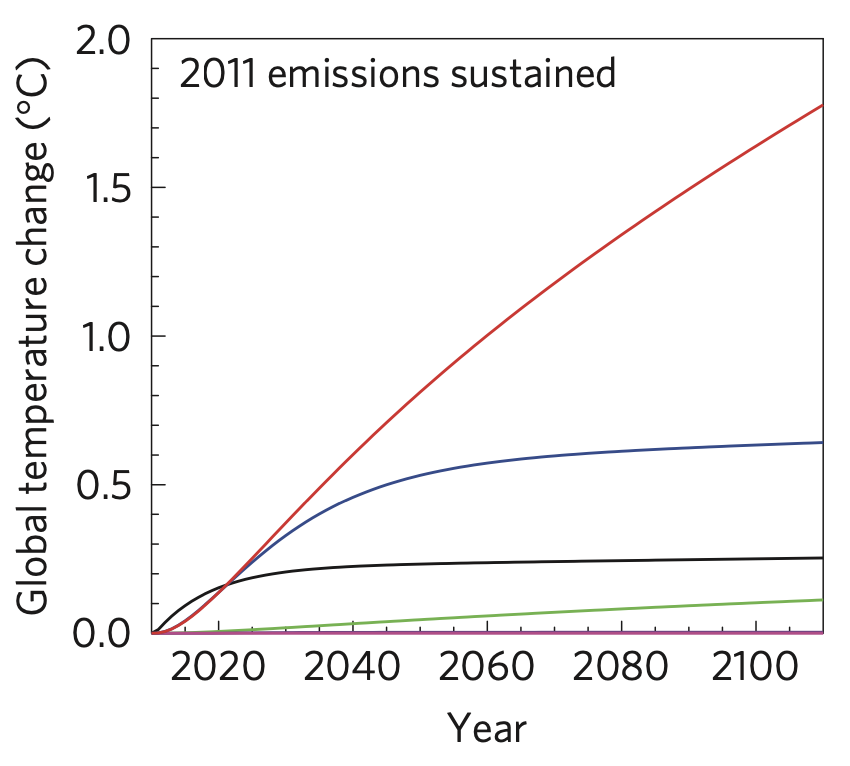
The warming impact of the cumulative pollutants, CO2 and nitrous oxide, increases steadily as long as these emissions persist, whereas sustained emissions of methane and organic and black carbon aerosols cause temperatures to warm rapidly at first, and then stabilize. A permanent reduction of 50–75% in these SLCPs (short lived climate pollutants) could reduce global temperatures by over 0.5˚C by mid-century, comparable to the impact on these timescales of similar-magnitude reductions of CO2 emissions and, it has been argued, at much lower cost. Stabilizing global temperatures, however, requires net emissions of cumulative pollutants, predominantly CO2, to be reduced to zero.
Allen, M., Fuglestvedt, J., Shine, K. et al. New use of global warming potentials to compare cumulative and short-lived climate pollutants.10.
After 500 years, about a third of a CO2 emission pulse remains in the atmosphere11.
World anthropogenic CO2 emissions from fossil fuels and cement, shown in chart 5, rebounded strongly in 2021, reaching a record 36.88 billion tonnes in 202212.
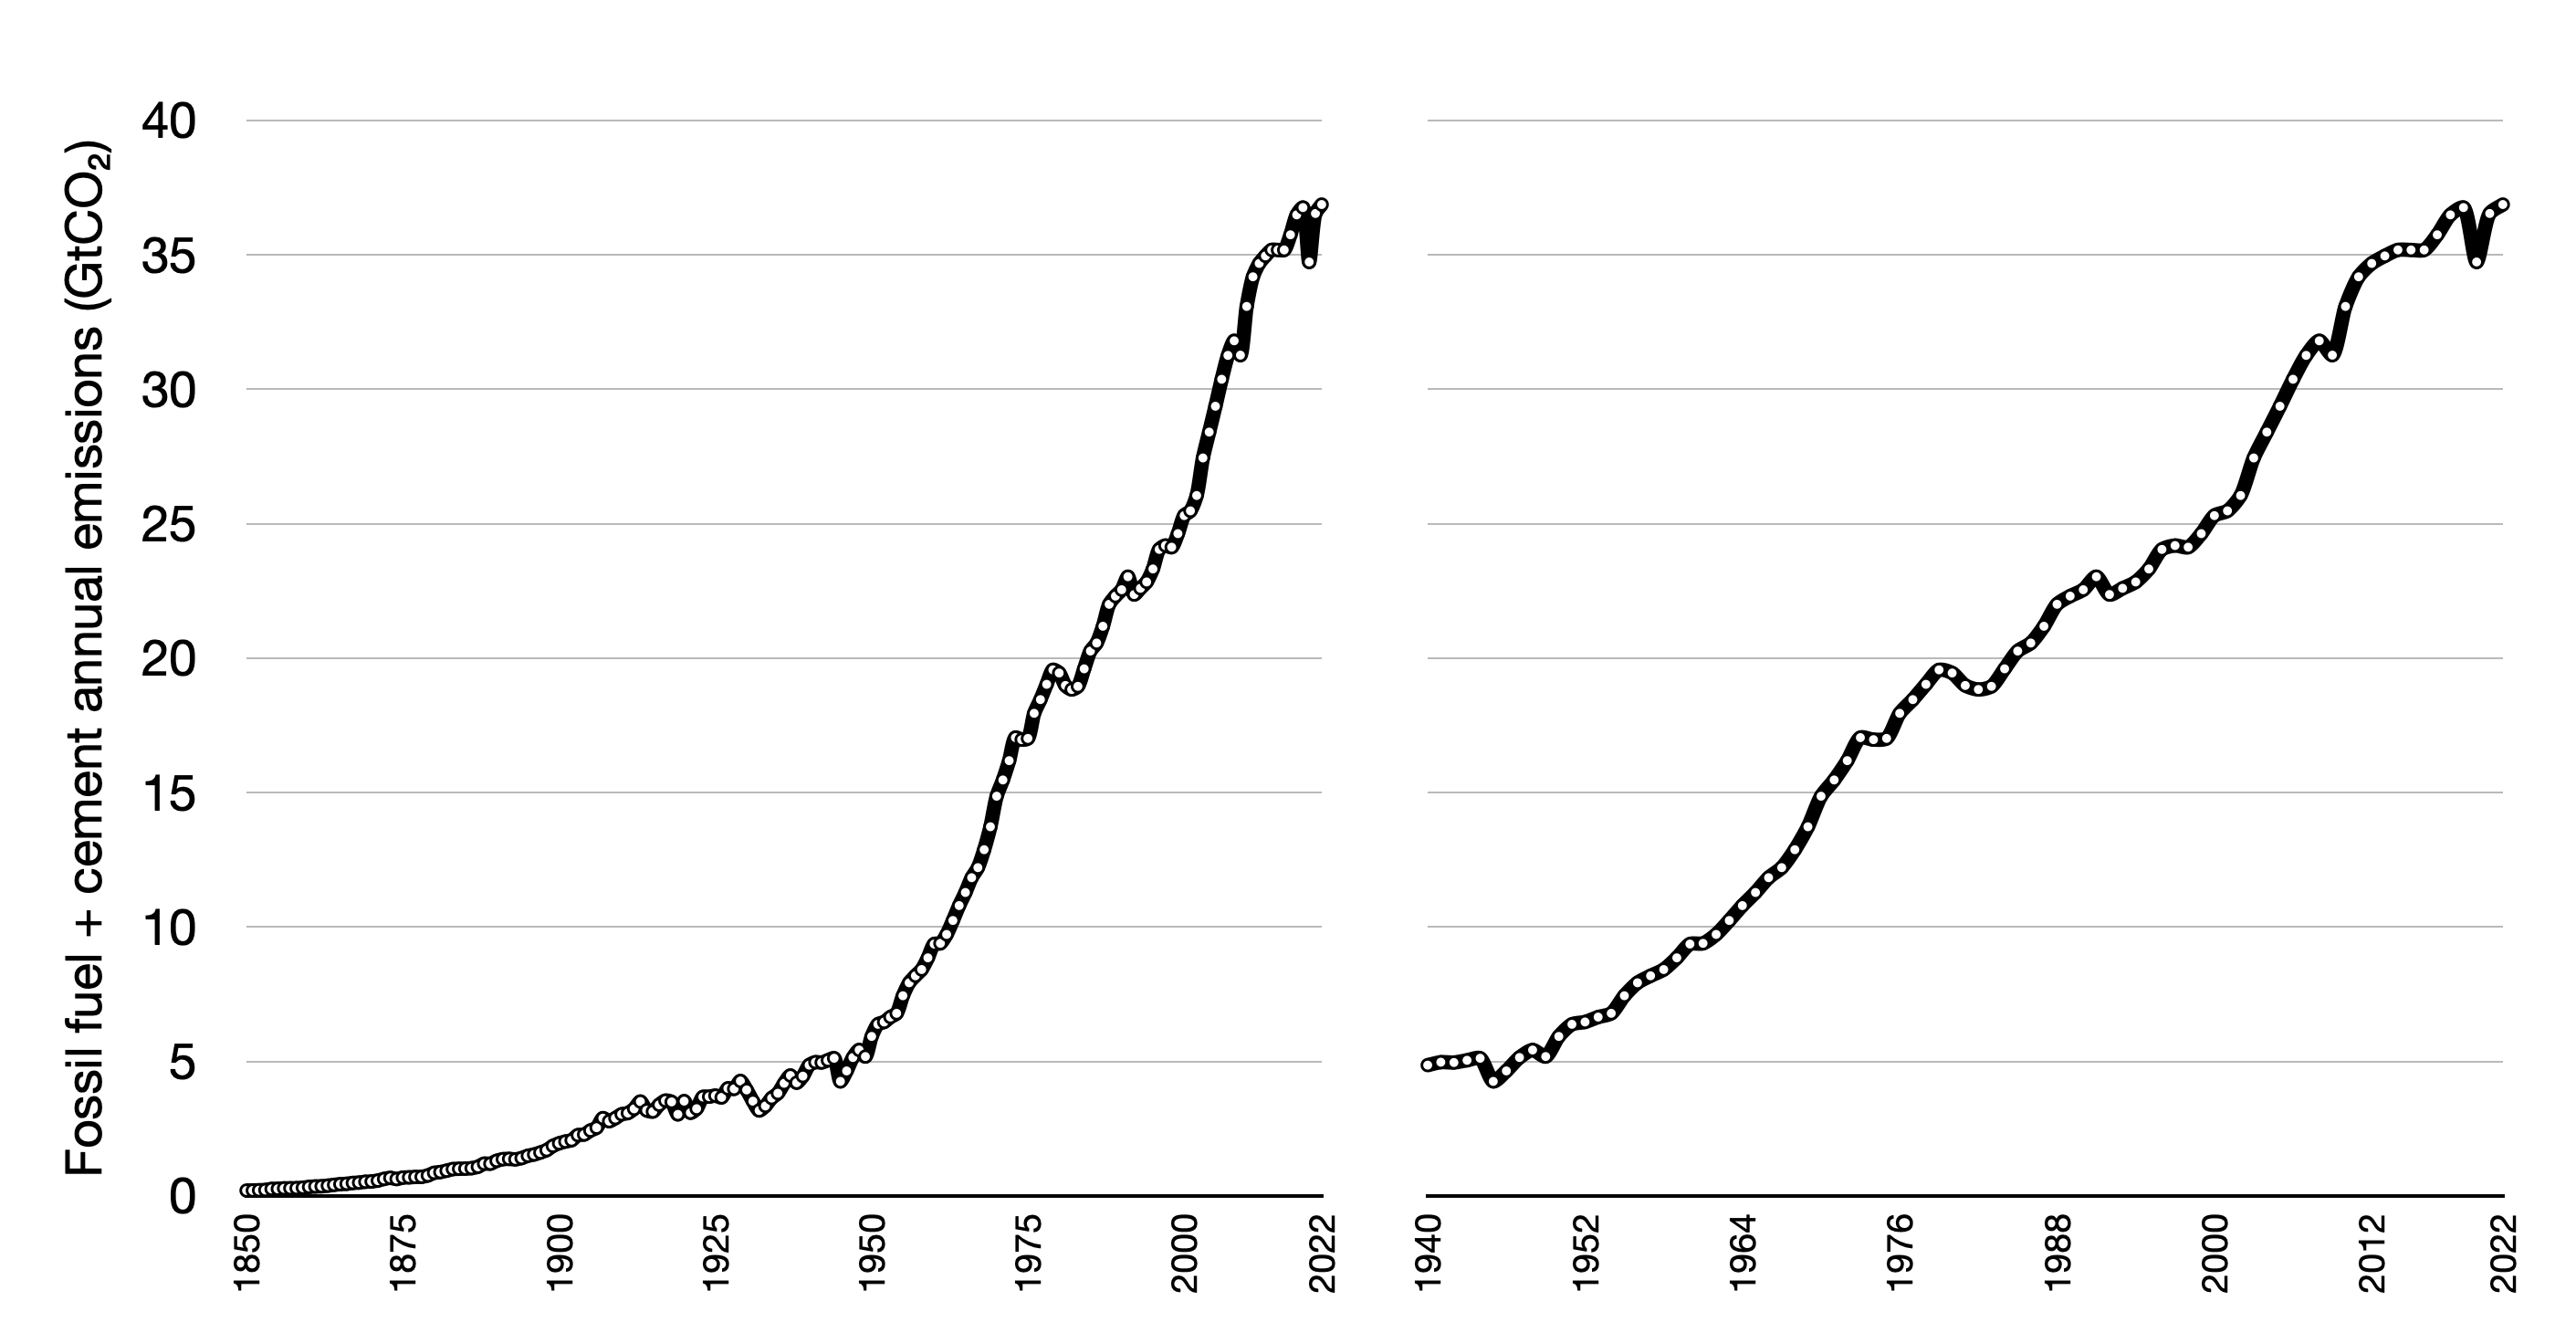
Current emission trends are so rapid that, if maintained, the quantity of CO2 to be emitted between 2010 and 2030 will be equivalent to that emitted between 1750 and 1970 –
It has taken society nearly 220 years (from 1750 to 1970) to emit the first trillion tons of CO2 and only another 40 years (1970–2010) to emit the next trillion tons. The third trillion tons, under current emission trends, would be emitted by 2030 and the fourth trillion tons before 2050.
Xu, Yangyang, and Veerabhadran Ramanathan, “Well below 2 C: Mitigation strategies for avoiding dangerous to catastrophic climate changes”14.
The consequential increase of atmospheric CO2 concentration is shown in chart 6. Rapid growth began in 1955. The rightmost chart shows that the atmospheric concentration of CO2 has increased by more than 1.5ppm for the past 22 consecutive years.
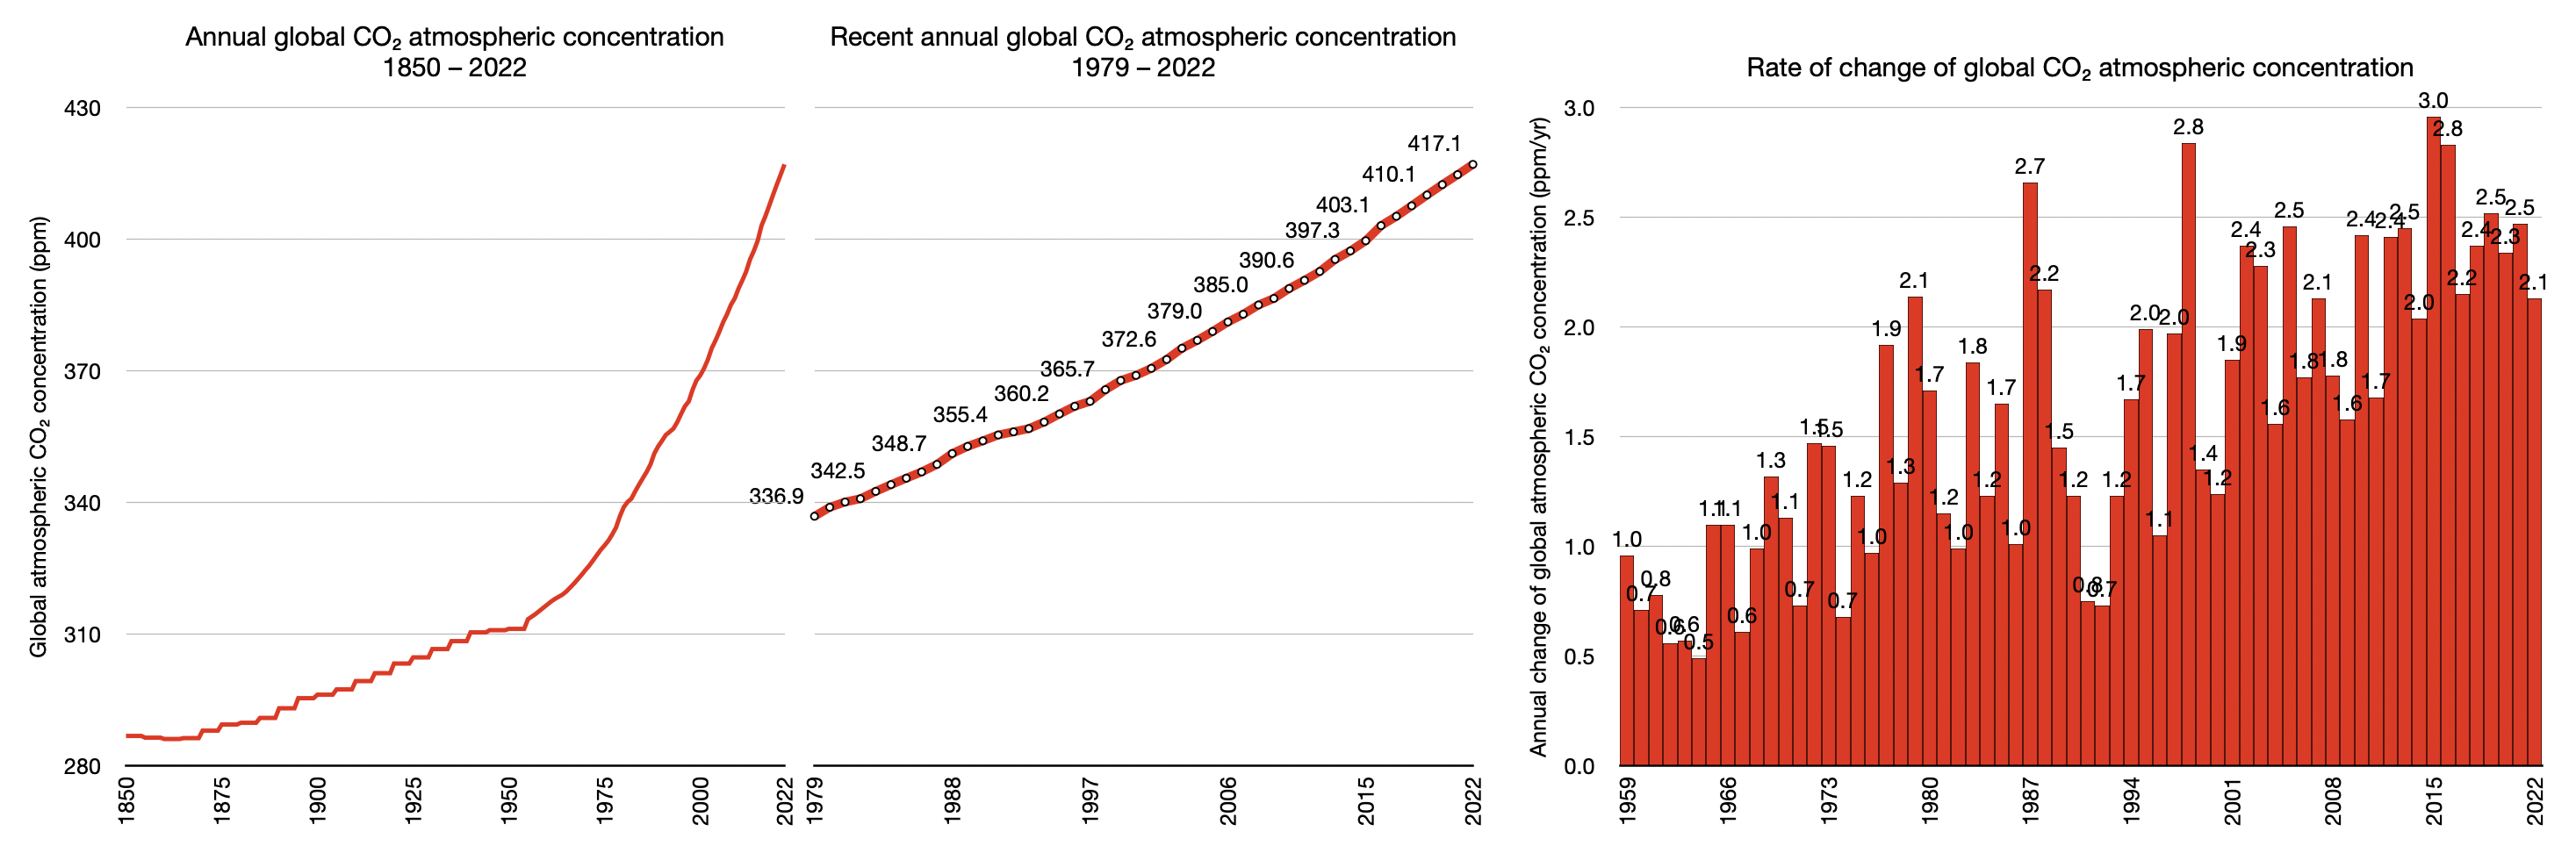
We conclude that, given currently available records, the present anthropogenic carbon release rate is unprecedented during the past 66 million years.
Zeebe, Ridgwell and Zachos, 2016, Anthropogenic carbon release rate unprecedented during the past 66 million years.17
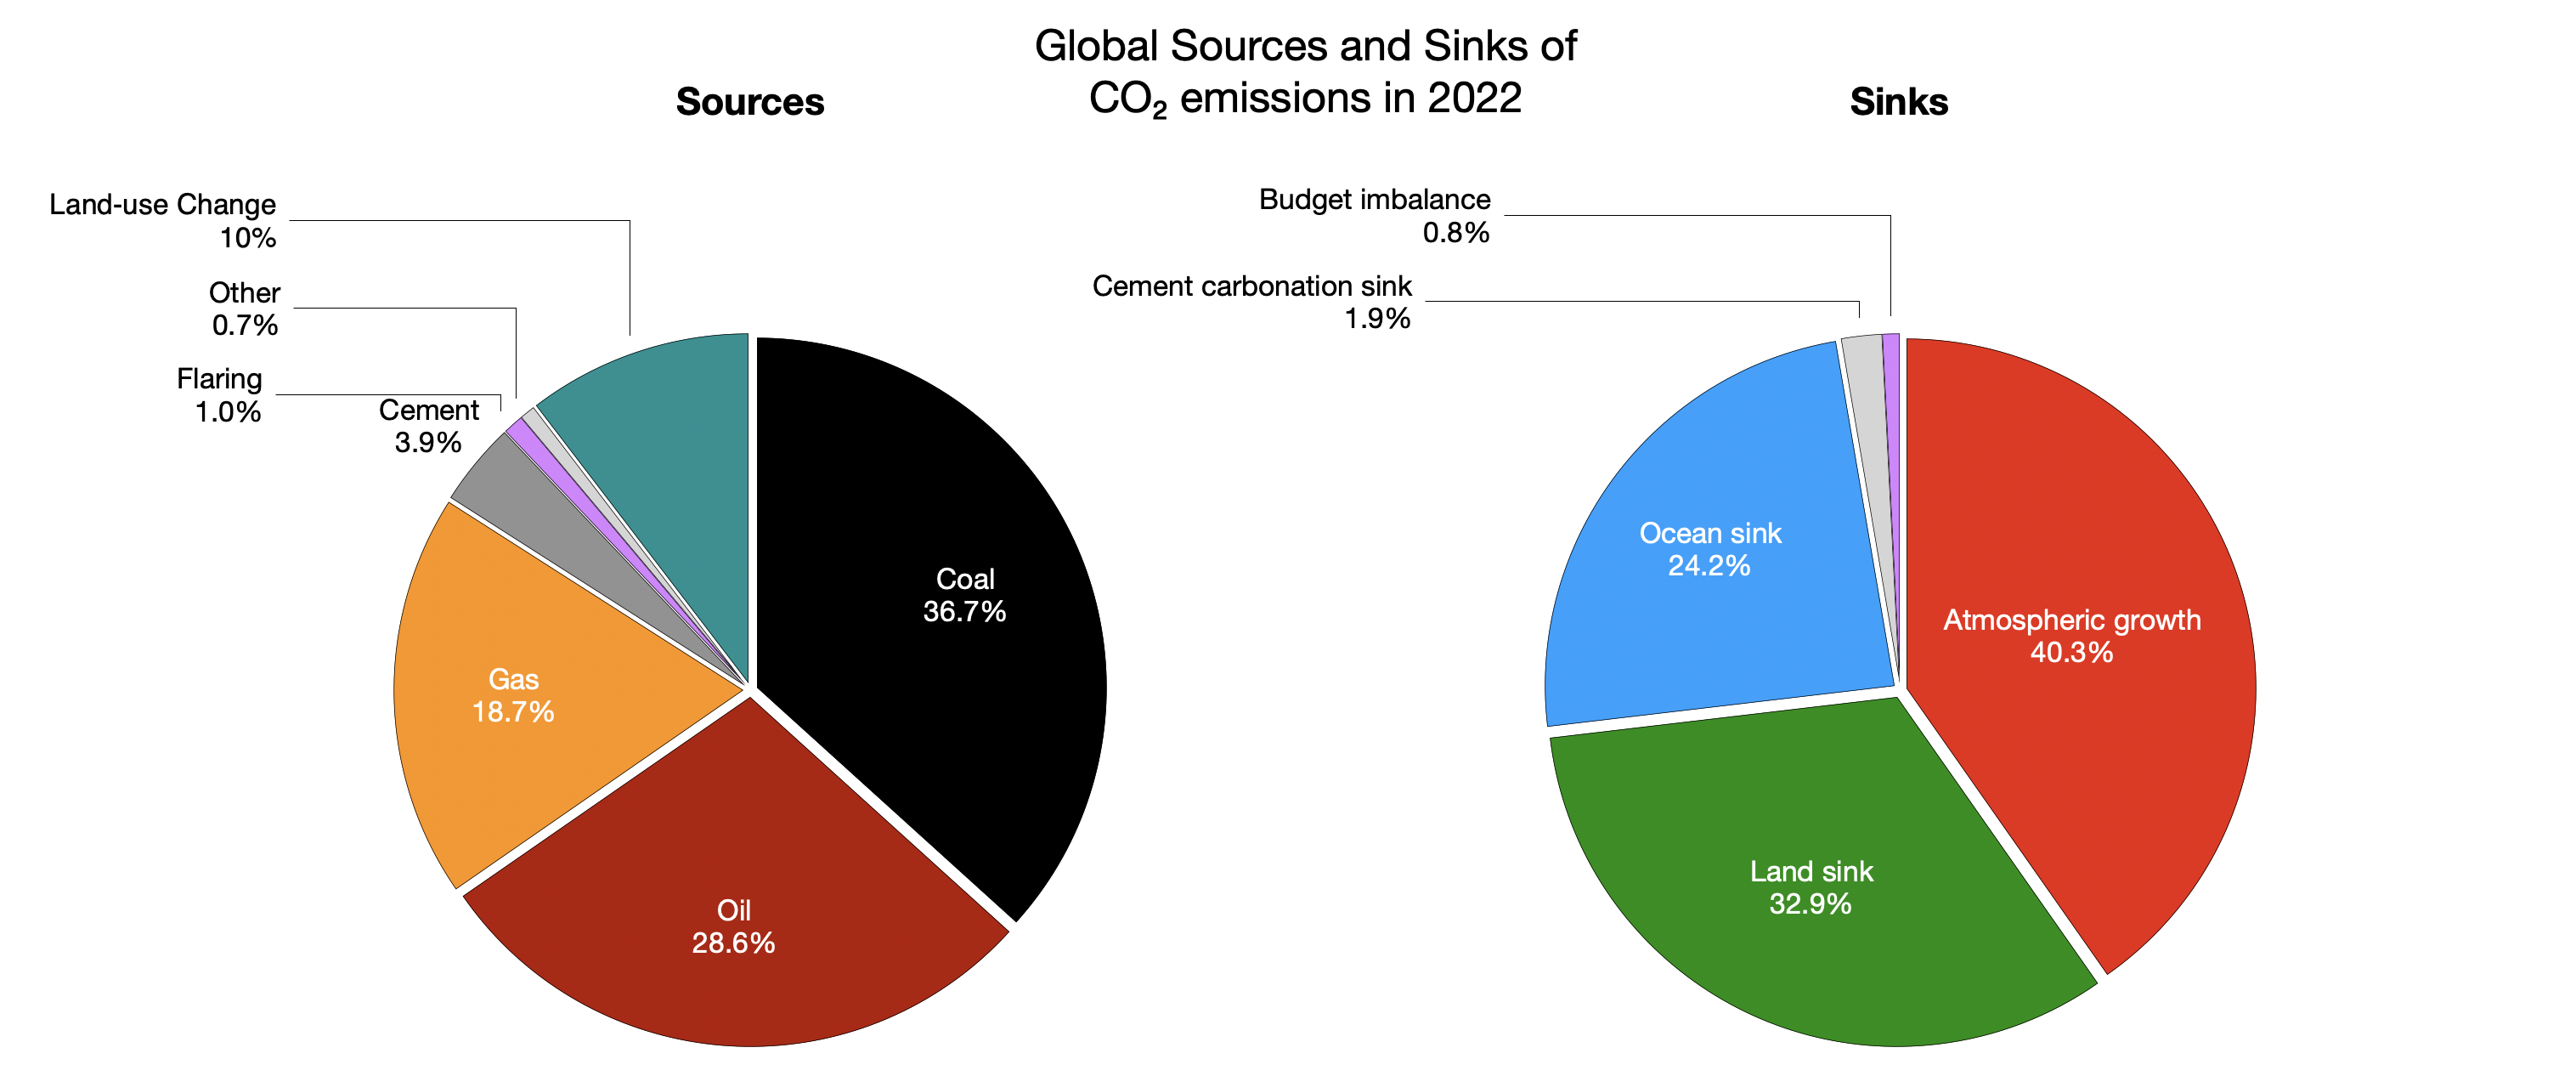
Anthropogenic CO2 emissions originate from three sectors; energy, cement and land-use change:
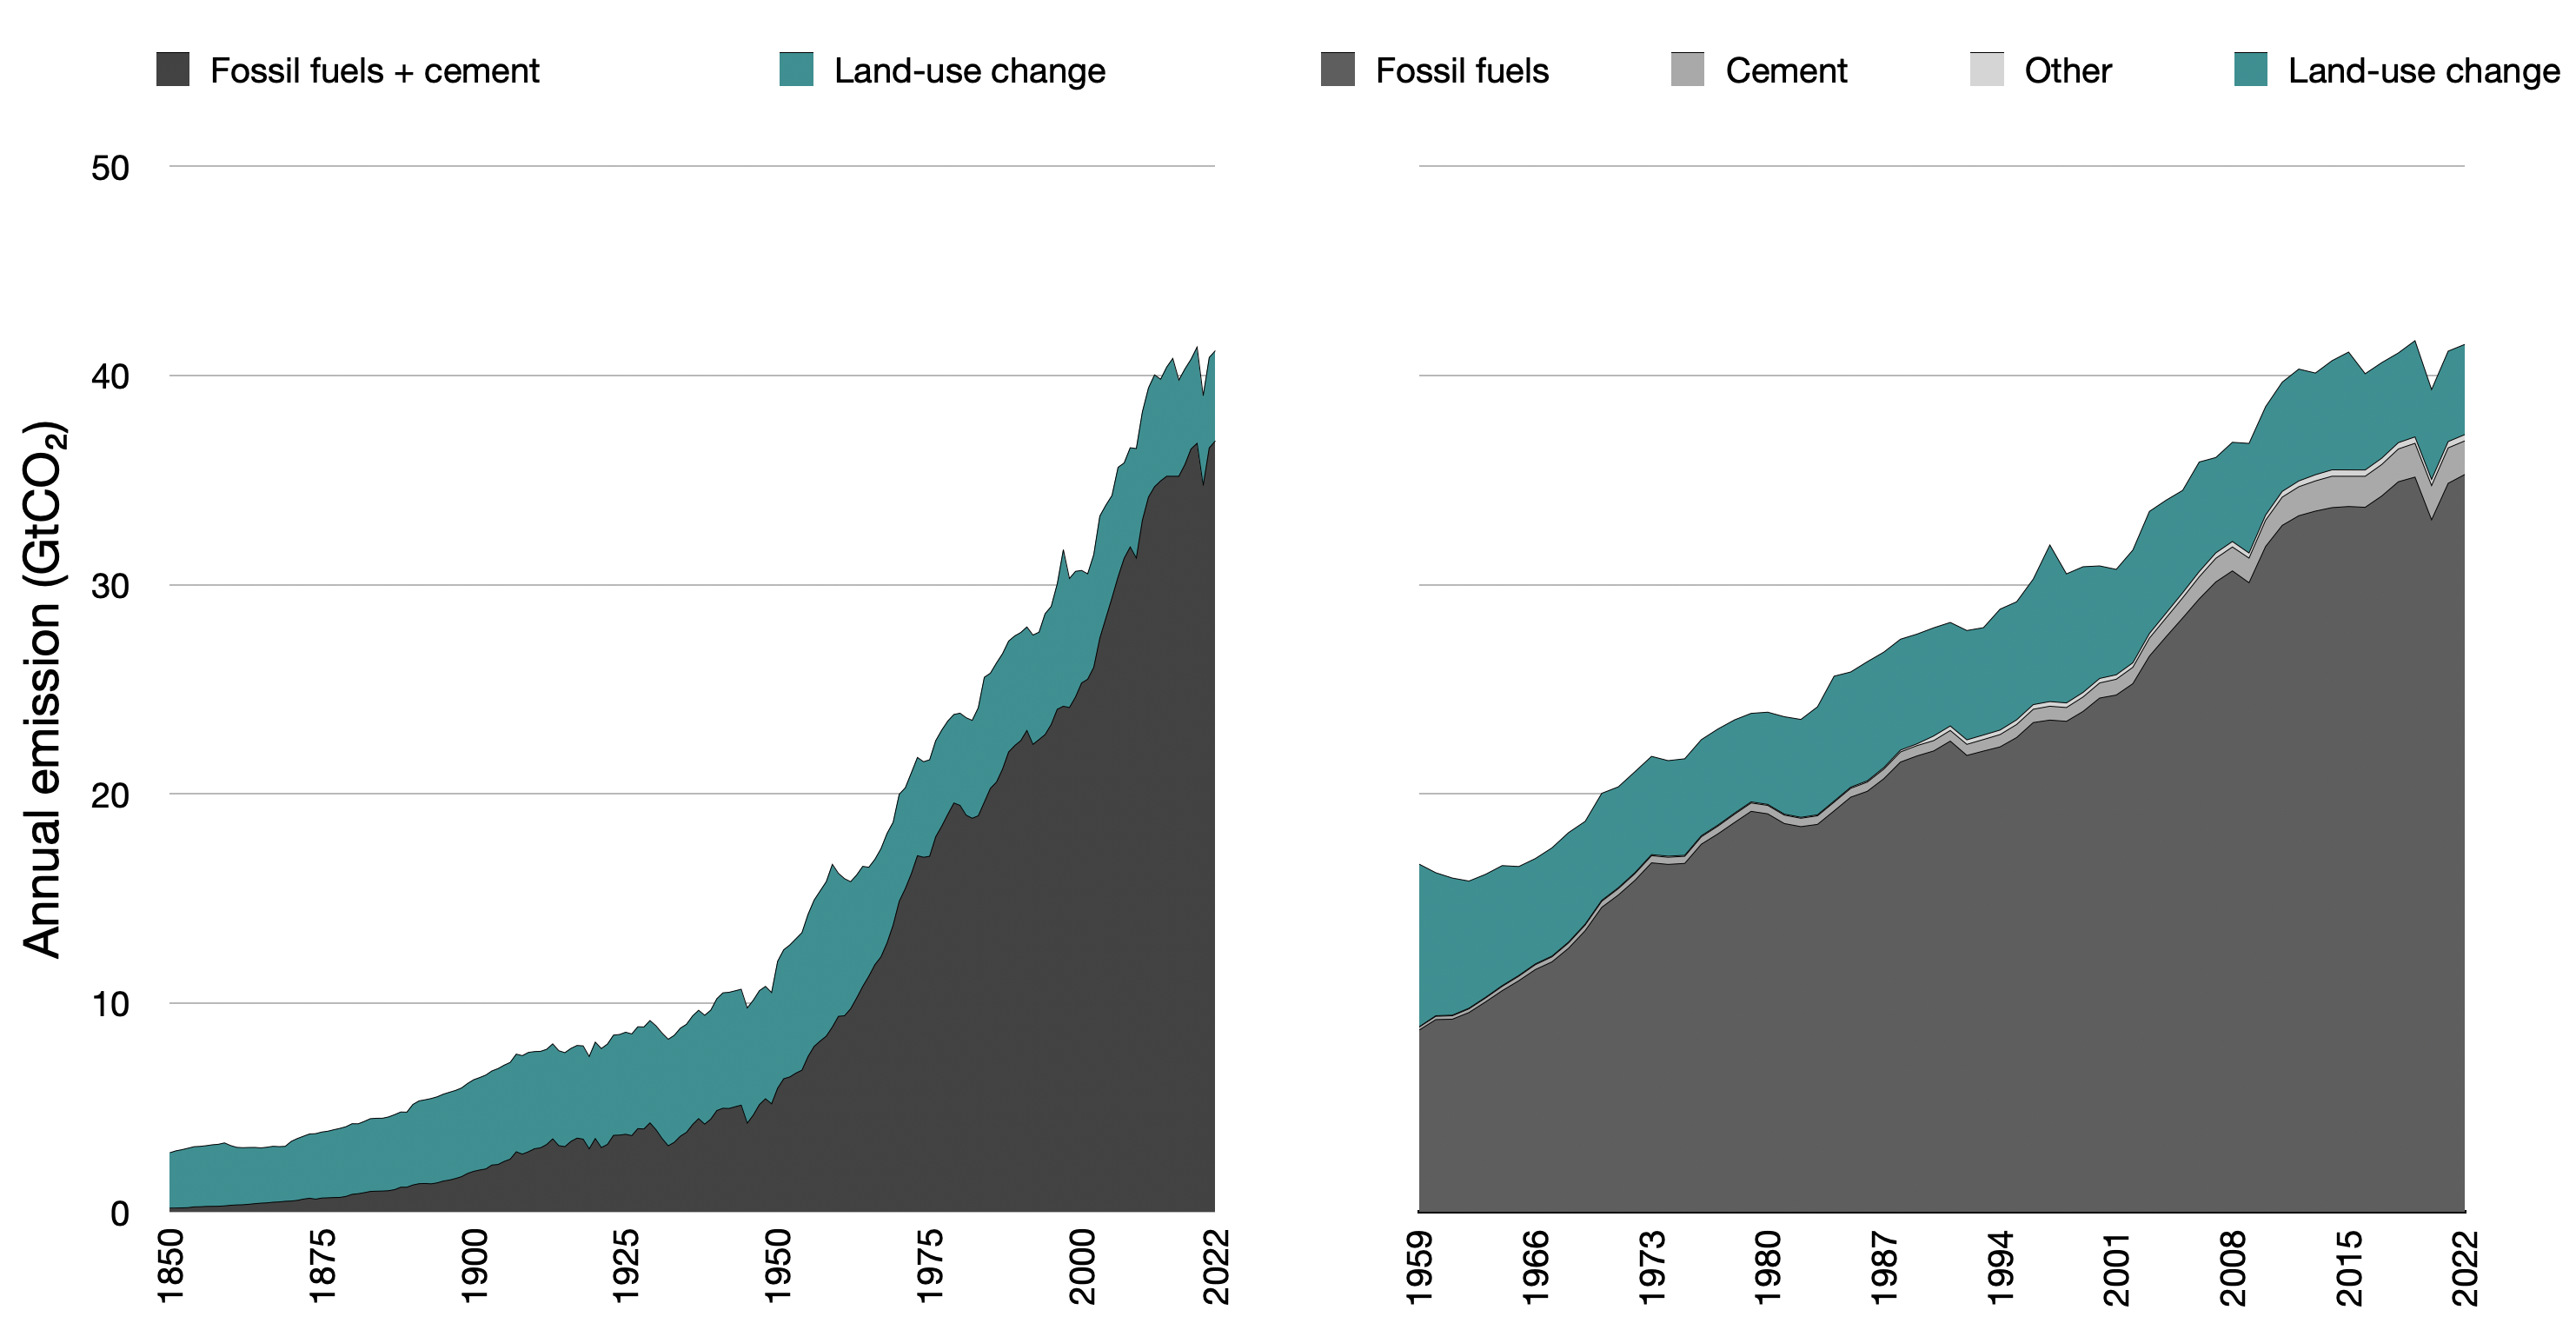
Emission trends for each source are shown below from year 1900 to 2022 –
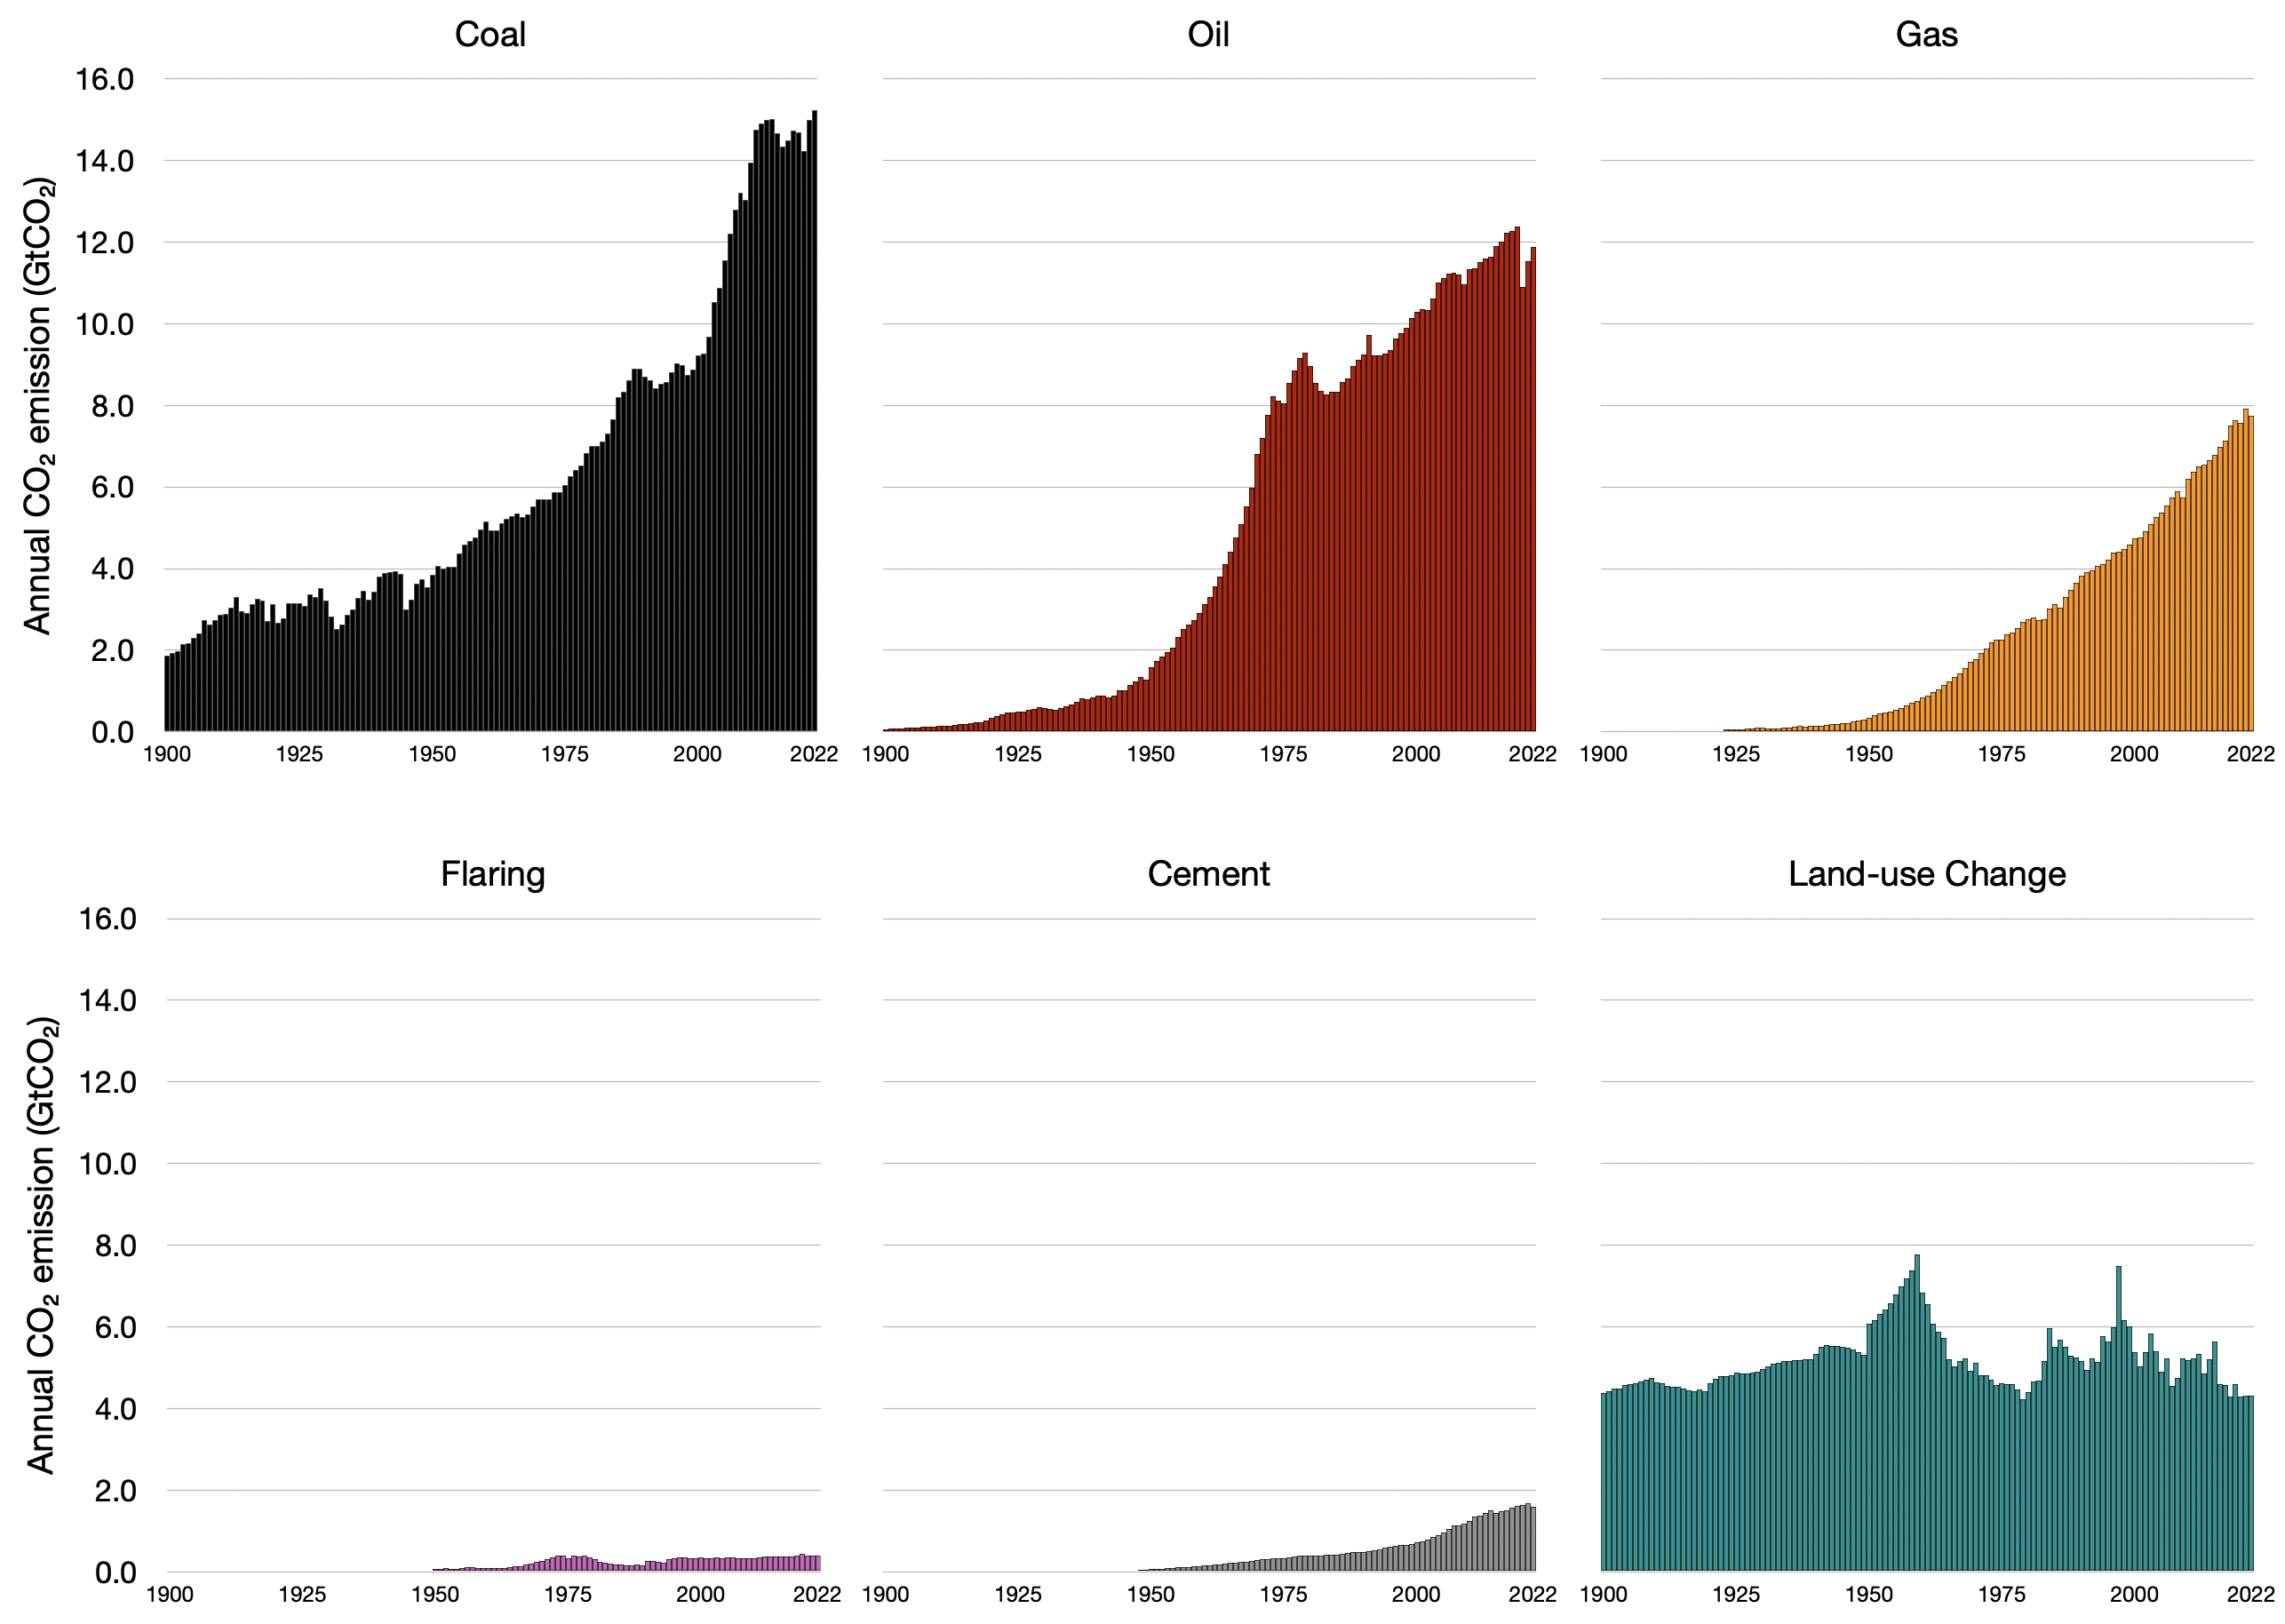
In 2022, 85% of anthropogenic CO2 was emitted by the world energy system (coal + oil + gas +flaring = 36.7%+28.6%+18.7%+1% = 85%) –
See the page Carbon Rankings for statistics about CO2 emissions.
Summary
Sustained emissions of short lived climate pollutants (mainly CH₄) cause global warming to increase rapidly at first, and then stabilise. A permanent 50–75% reduction could reduce warming by over 0.5˚C by 2050.
Sustained emissions of long lived climate pollutants (mainly CO2) cause global warming to steadily increase as long as these emissions persist.
Our CO2 emissions:
- account for 80% of global warming since year 1750;
- are the only rapidly increasing contributor;
- continue to grow with no peak in sight, at a rate unprecedented in the past 66 million years;
- almost solely determine Earth’s long term warming commitment;
- must be reduced to net-zero to stabilise warming;
- must be removed from the atmosphere to lower warming; and
- almost all (85%) originate from the world energy system.
- p. 5, Hansen, 2018, Climate Change in a Nutshell http://www.columbia.edu/~jeh1/mailings/2018/20181206_Nutshell.pdf, accessed 18 December 2018[↩]
- p. 961, Forster, P., T. Storelvmo, K. Armour, W. Collins, J.-L. Dufresne, D. Frame, D.J. Lunt, T. Mauritsen, M.D. Palmer, M. Watanabe, M. Wild, and H. Zhang, 2021: The Earth’s Energy Budget, Climate Feedbacks, and Climate Sensitivity. In Climate Change 2021: The Physical Science Basis. Contribution of Working Group I to the Sixth Assessment Report of the Intergovernmental Panel on Climate Change [Masson-Delmotte, V., P. Zhai, A. Pirani, S.L. Connors, C. Péan, S. Berger, N. Caud, Y. Chen, L. Goldfarb, M.I. Gomis, M. Huang, K. Leitzell, E. Lonnoy, J.B.R. Matthews, T.K. Maycock, T. Waterfield, O. Yelekçi, R. Yu, and B. Zhou (eds.)]. Cambridge University Press, Cambridge, United Kingdom and New York, NY, USA, pp. 923–1054, doi:10.1017/9781009157896.009.[↩][↩][↩][↩]
- p. 962, Forster, P., T. Storelvmo, K. Armour, W. Collins, J.-L. Dufresne, D. Frame, D.J. Lunt, T. Mauritsen, M.D. Palmer, M. Watanabe, M. Wild, and H. Zhang, 2021: The Earth’s Energy Budget, Climate Feedbacks, and Climate Sensitivity. In Climate Change 2021: The Physical Science Basis. Contribution of Working Group I to the Sixth Assessment Report of the Intergovernmental Panel on Climate Change [Masson-Delmotte, V., P. Zhai, A. Pirani, S.L. Connors, C. Péan, S. Berger, N. Caud, Y. Chen, L. Goldfarb, M.I. Gomis, M. Huang, K. Leitzell, E. Lonnoy, J.B.R. Matthews, T.K. Maycock, T. Waterfield, O. Yelekçi, R. Yu, and B. Zhou (eds.)]. Cambridge University Press, Cambridge, United Kingdom and New York, NY, USA, pp. 923–1054, doi:10.1017/9781009157896.009.[↩]
- Article 2.1(a) https://unfccc.int/files/meetings/paris_nov_2015/application/pdf/paris_agreement_english_.pdf[↩]
- IPCC, 2018: Global Warming of 1.5°C. An IPCC Special Report on the impacts of global warming of 1.5°C above pre-industrial levels and related global greenhouse gas emission pathways, in the context of strengthening the global response to the threat of climate change, sustainable development, and efforts to eradicate poverty [Masson-Delmotte, V., P. Zhai, H.-O. Pörtner, D. Roberts, J. Skea, P.R. Shukla, A. Pirani, W. Moufouma-Okia, C. Péan, R. Pidcock, S. Connors, J.B.R. Matthews, Y. Chen, X. Zhou, M.I. Gomis, E. Lonnoy, T. Maycock, M. Tignor, and T. Waterfield (eds.)]. In Press. https://www.ipcc.ch/sr15/faq/faq-chapter-1/[↩]
- 1.01˚C/1.27˚C[↩]
- https://en.wikipedia.org/wiki/Nitrous_oxide[↩]
- Figure 8.33, page 719, IPCC, 2013: Climate Change 2013: The Physical Science Basis. Contribution of Working Group I to the Fifth Assessment Report of the Intergovernmental Panel on Climate Change [Stocker, T.F., D. Qin, G.-K. Plattner, M. Tignor, S.K. Allen, J. Boschung, A. Nauels, Y. Xia, V. Bex and P.M. Midgley (eds.)]. Cambridge University Press, Cambridge, United Kingdom and New York, NY, USA, 1535 pp. https://www.ipcc.ch/report/ar5/wg1/.[↩]
- Allen, M., Fuglestvedt, J., Shine, K. et al. New use of global warming potentials to compare cumulative and short-lived climate pollutants. Nature Climate Change 6, 773–776 (2016), https://www.nature.com/articles/nclimate2998, http://sequoiaforestkeeper.org/pdfs/attachments/Allen_et_al_on_SLCP_GWP_2016.pdf[↩]
- Allen, M., Fuglestvedt, J., Shine, K. et al. New use of global warming potentials to compare cumulative and short-lived climate pollutants. Nature Clim Change 6, 773–776 (2016), https://www.nature.com/articles/nclimate2998, http://sequoiaforestkeeper.org/pdfs/attachments/Allen_et_al_on_SLCP_GWP_2016.pdf[↩]
- Fig. 1 of Aamaas, B., Peters, G. P., and Fuglestvedt, J. S.: Simple emission metrics for climate impacts, Earth Syst. Dynam., 4, 145-170, 2013. https://doi.org/10.5194/esd-4-145-2013.[↩]
- Global Carbon Budget published in November 2023, Friedlingstein, P., O’Sullivan, M., Jones, M. W., Andrew, R. M., Bakker, D. C. E., Hauck, J., Landschützer, P., Le Quéré, C., Luijkx, I. T., Peters, G. P., Peters, W., Pongratz, J., Schwingshackl, C., Sitch, S., Canadell, J. G., Ciais, P., Jackson, R. B., Alin, S. R., Anthoni, P., Barbero, L., Bates, N. R., Becker, M., Bellouin, N., Decharme, B., Bopp, L., Brasika, I. B. M., Cadule, P., Chamberlain, M. A., Chandra, N., Chau, T.-T.-T., Chevallier, F., Chini, L. P., Cronin, M., Dou, X., Enyo, K., Evans, W., Falk, S., Feely, R. A., Feng, L., Ford, D. J., Gasser, T., Ghattas, J., Gkritzalis, T., Grassi, G., Gregor, L., Gruber, N., Gürses, Ö., Harris, I., Hefner, M., Heinke, J., Houghton, R. A., Hurtt, G. C., Iida, Y., Ilyina, T., Jacobson, A. R., Jain, A., Jarníková, T., Jersild, A., Jiang, F., Jin, Z., Joos, F., Kato, E., Keeling, R. F., Kennedy, D., Klein Goldewijk, K., Knauer, J., Korsbakken, J. I., Körtzinger, A., Lan, X., Lefèvre, N., Li, H., Liu, J., Liu, Z., Ma, L., Marland, G., Mayot, N., McGuire, P. C., McKinley, G. A., Meyer, G., Morgan, E. J., Munro, D. R., Nakaoka, S.-I., Niwa, Y., O’Brien, K. M., Olsen, A., Omar, A. M., Ono, T., Paulsen, M., Pierrot, D., Pocock, K., Poulter, B., Powis, C. M., Rehder, G., Resplandy, L., Robertson, E., Rödenbeck, C., Rosan, T. M., Schwinger, J., Séférian, R., Smallman, T. L., Smith, S. M., Sospedra-Alfonso, R., Sun, Q., Sutton, A. J., Sweeney, C., Takao, S., Tans, P. P., Tian, H., Tilbrook, B., Tsujino, H., Tubiello, F., van der Werf, G. R., van Ooijen, E., Wanninkhof, R., Watanabe, M., Wimart-Rousseau, C., Yang, D., Yang, X., Yuan, W., Yue, X., Zaehle, S., Zeng, J., and Zheng, B.: Global Carbon Budget 2023, Earth Syst. Sci. Data, 15, 5301–5369, https://doi.org/10.5194/essd-15-5301-2023, 2023[↩]
- Friedlingstein, P., O’Sullivan, M., Jones, M. W., Andrew, R. M., Bakker, D. C. E., Hauck, J., Landschützer, P., Le Quéré, C., Luijkx, I. T., Peters, G. P., Peters, W., Pongratz, J., Schwingshackl, C., Sitch, S., Canadell, J. G., Ciais, P., Jackson, R. B., Alin, S. R., Anthoni, P., Barbero, L., Bates, N. R., Becker, M., Bellouin, N., Decharme, B., Bopp, L., Brasika, I. B. M., Cadule, P., Chamberlain, M. A., Chandra, N., Chau, T.-T.-T., Chevallier, F., Chini, L. P., Cronin, M., Dou, X., Enyo, K., Evans, W., Falk, S., Feely, R. A., Feng, L., Ford, D. J., Gasser, T., Ghattas, J., Gkritzalis, T., Grassi, G., Gregor, L., Gruber, N., Gürses, Ö., Harris, I., Hefner, M., Heinke, J., Houghton, R. A., Hurtt, G. C., Iida, Y., Ilyina, T., Jacobson, A. R., Jain, A., Jarníková, T., Jersild, A., Jiang, F., Jin, Z., Joos, F., Kato, E., Keeling, R. F., Kennedy, D., Klein Goldewijk, K., Knauer, J., Korsbakken, J. I., Körtzinger, A., Lan, X., Lefèvre, N., Li, H., Liu, J., Liu, Z., Ma, L., Marland, G., Mayot, N., McGuire, P. C., McKinley, G. A., Meyer, G., Morgan, E. J., Munro, D. R., Nakaoka, S.-I., Niwa, Y., O’Brien, K. M., Olsen, A., Omar, A. M., Ono, T., Paulsen, M., Pierrot, D., Pocock, K., Poulter, B., Powis, C. M., Rehder, G., Resplandy, L., Robertson, E., Rödenbeck, C., Rosan, T. M., Schwinger, J., Séférian, R., Smallman, T. L., Smith, S. M., Sospedra-Alfonso, R., Sun, Q., Sutton, A. J., Sweeney, C., Takao, S., Tans, P. P., Tian, H., Tilbrook, B., Tsujino, H., Tubiello, F., van der Werf, G. R., van Ooijen, E., Wanninkhof, R., Watanabe, M., Wimart-Rousseau, C., Yang, D., Yang, X., Yuan, W., Yue, X., Zaehle, S., Zeng, J., and Zheng, B.: Global Carbon Budget 2023, Earth Syst. Sci. Data, 15, 5301–5369, https://doi.org/10.5194/essd-15-5301-2023, 2023[↩][↩][↩]
- Xu, Yangyang, and Veerabhadran Ramanathan. “Well below 2 C: Mitigation strategies for avoiding dangerous to catastrophic climate changes.” Proceedings of the National Academy of Sciences 114, no. 39 (2017): 10315-10323. https://www.pnas.org/content/pnas/114/39/10315.full.pdf[↩]
- Data from 1850 to 1978 inclusive: p. 1404, Table AII.1.2 IPCC, 2013: Annex II: Climate System Scenario Tables [Prather, M., G. Flato, P. Friedlingstein, C. Jones, J.-F. Lamarque, H. Liao and P. Rasch (eds.)]. In: Climate Change 2013: The Physical Science Basis. Contribution of Working Group I to the Fifth Assessment Report of the Intergovernmental Panel on Climate Change [Stocker, T.F., D. Qin, G.-K. Plattner, M. Tignor, S.K. Allen, J. Boschung, A. Nauels, Y. Xia, V. Bex and P.M. Midgley (eds.)]. Cambridge University Press, Cambridge, United Kingdom and New York, NY, USA. https://www.ipcc.ch/site/assets/uploads/2017/09/WG1AR5_AnnexII_FINAL.pdf. Data from 1979 to 2022 inclusive: Ed Dlugokencky and Pieter Tans, NOAA/ESRL, https://www.esrl.noaa.gov/gmd/ccgg/trends/gl_data.html[↩]
- Ed Dlugokencky and Pieter Tans, NOAA/ESRL, https://www.esrl.noaa.gov/gmd/ccgg/trends/gl_data.html[↩][↩]
- Zeebe, Richard E., Andy Ridgwell, and James C. Zachos. “Anthropogenic carbon release rate unprecedented during the past 66 million years.” Nature Geoscience 9, no. 4 (2016): 325. https://www.nature.com/articles/ngeo2681[↩]
- Friedlingstein, P., O’Sullivan, M., Jones, M. W., Andrew, R. M., Bakker, D. C. E., Hauck, J., Landschützer, P., Le Quéré, C., Luijkx, I. T., Peters, G. P., Peters, W., Pongratz, J., Schwingshackl, C., Sitch, S., Canadell, J. G., Ciais, P., Jackson, R. B., Alin, S. R., Anthoni, P., Barbero, L., Bates, N. R., Becker, M., Bellouin, N., Decharme, B., Bopp, L., Brasika, I. B. M., Cadule, P., Chamberlain, M. A., Chandra, N., Chau, T.-T.-T., Chevallier, F., Chini, L. P., Cronin, M., Dou, X., Enyo, K., Evans, W., Falk, S., Feely, R. A., Feng, L., Ford, D. J., Gasser, T., Ghattas, J., Gkritzalis, T., Grassi, G., Gregor, L., Gruber, N., Gürses, Ö., Harris, I., Hefner, M., Heinke, J., Houghton, R. A., Hurtt, G. C., Iida, Y., Ilyina, T., Jacobson, A. R., Jain, A., Jarníková, T., Jersild, A., Jiang, F., Jin, Z., Joos, F., Kato, E., Keeling, R. F., Kennedy, D., Klein Goldewijk, K., Knauer, J., Korsbakken, J. I., Körtzinger, A., Lan, X., Lefèvre, N., Li, H., Liu, J., Liu, Z., Ma, L., Marland, G., Mayot, N., McGuire, P. C., McKinley, G. A., Meyer, G., Morgan, E. J., Munro, D. R., Nakaoka, S.-I., Niwa, Y., O’Brien, K. M., Olsen, A., Omar, A. M., Ono, T., Paulsen, M., Pierrot, D., Pocock, K., Poulter, B., Powis, C. M., Rehder, G., Resplandy, L., Robertson, E., Rödenbeck, C., Rosan, T. M., Schwinger, J., Séférian, R., Smallman, T. L., Smith, S. M., Sospedra-Alfonso, R., Sun, Q., Sutton, A. J., Sweeney, C., Takao, S., Tans, P. P., Tian, H., Tilbrook, B., Tsujino, H., Tubiello, F., van der Werf, G. R., van Ooijen, E., Wanninkhof, R., Watanabe, M., Wimart-Rousseau, C., Yang, D., Yang, X., Yuan, W., Yue, X., Zaehle, S., Zeng, J., and Zheng, B.: Global Carbon Budget 2023, Earth Syst. Sci. Data, 15, 5301–5369, https://doi.org/10.5194/essd-15-5301-2023, 2023[↩]