Updated January 2024.
Global Carbon Ranking
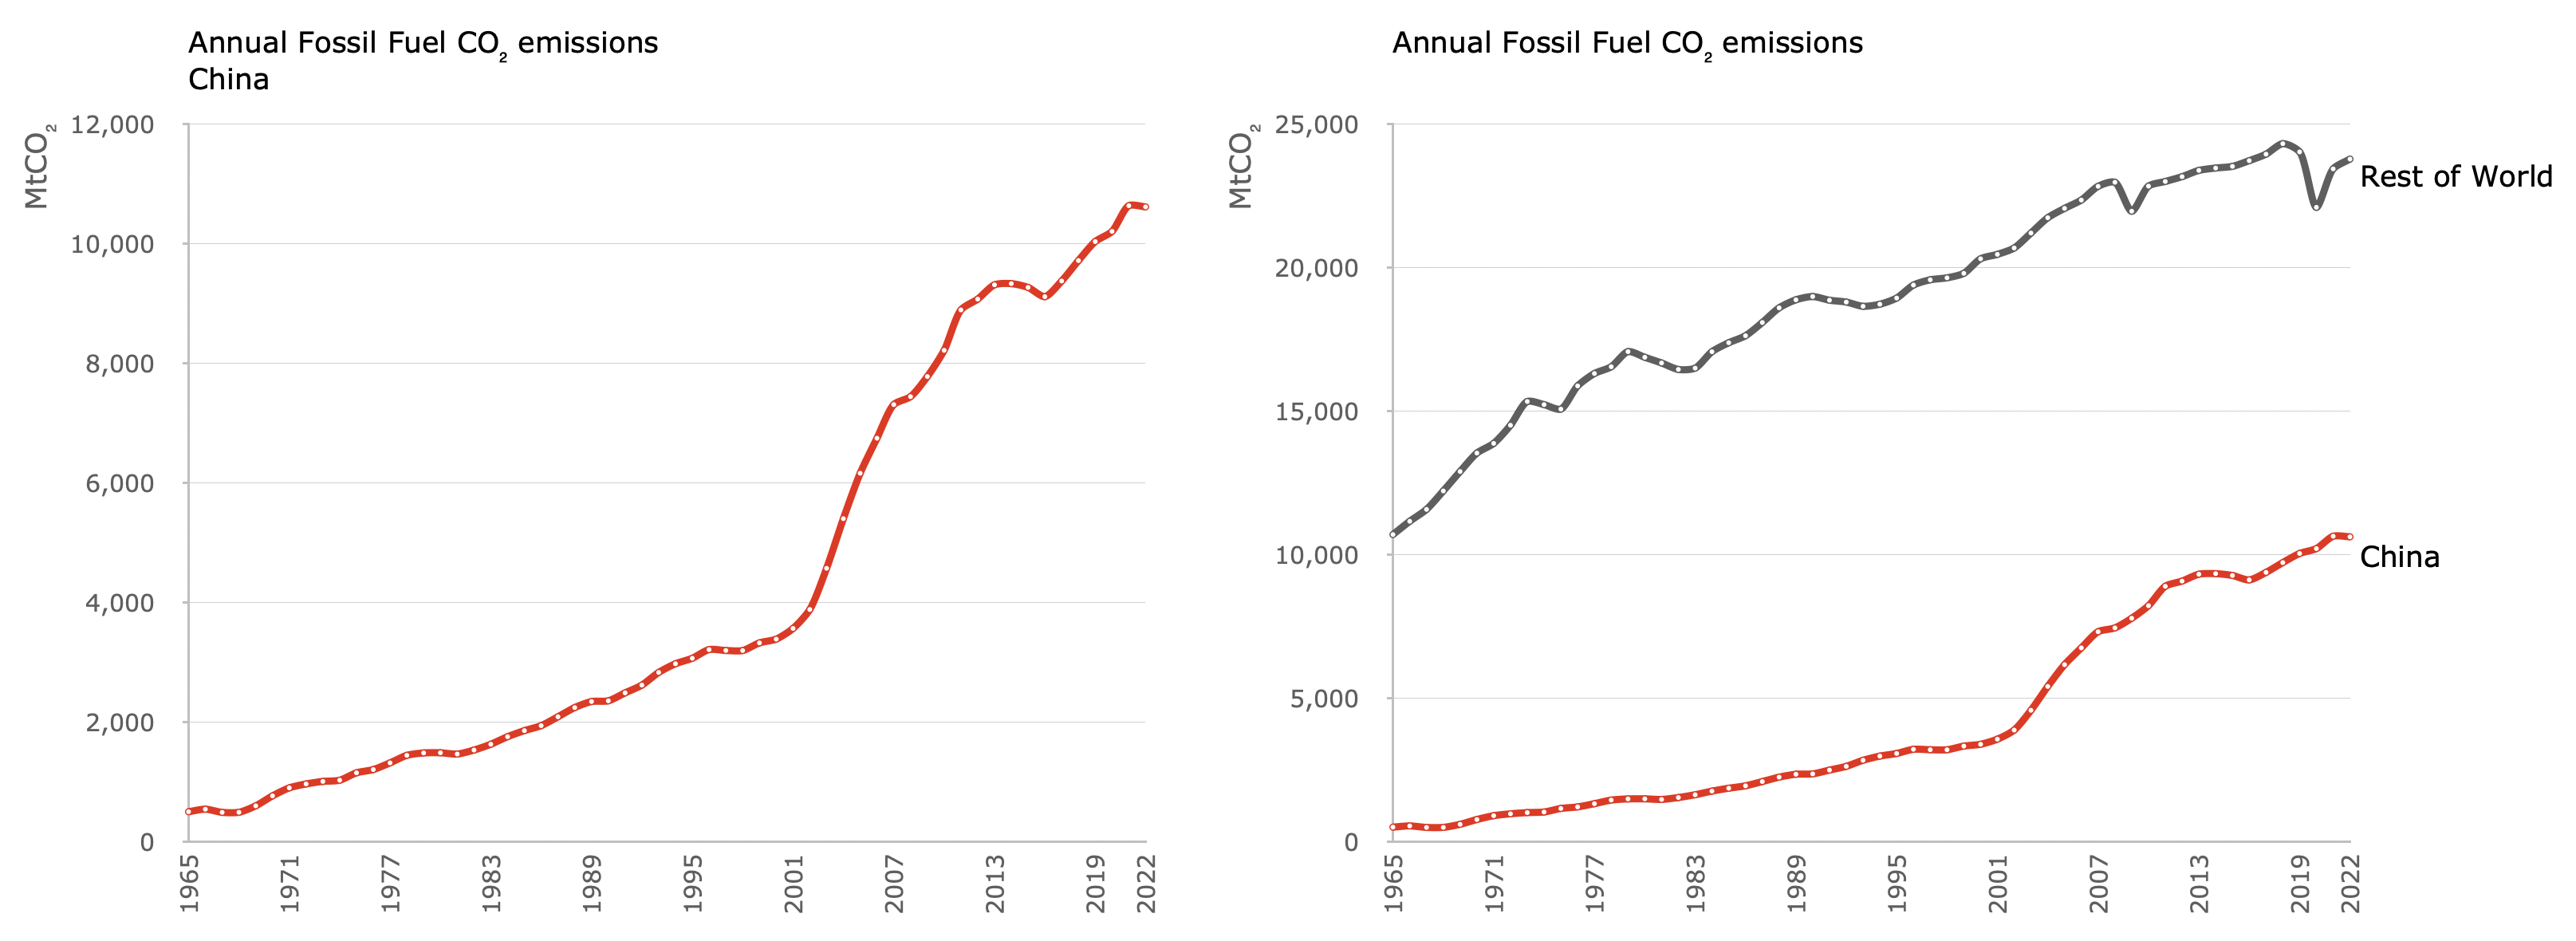
► World’s largest CO2 emitter1.
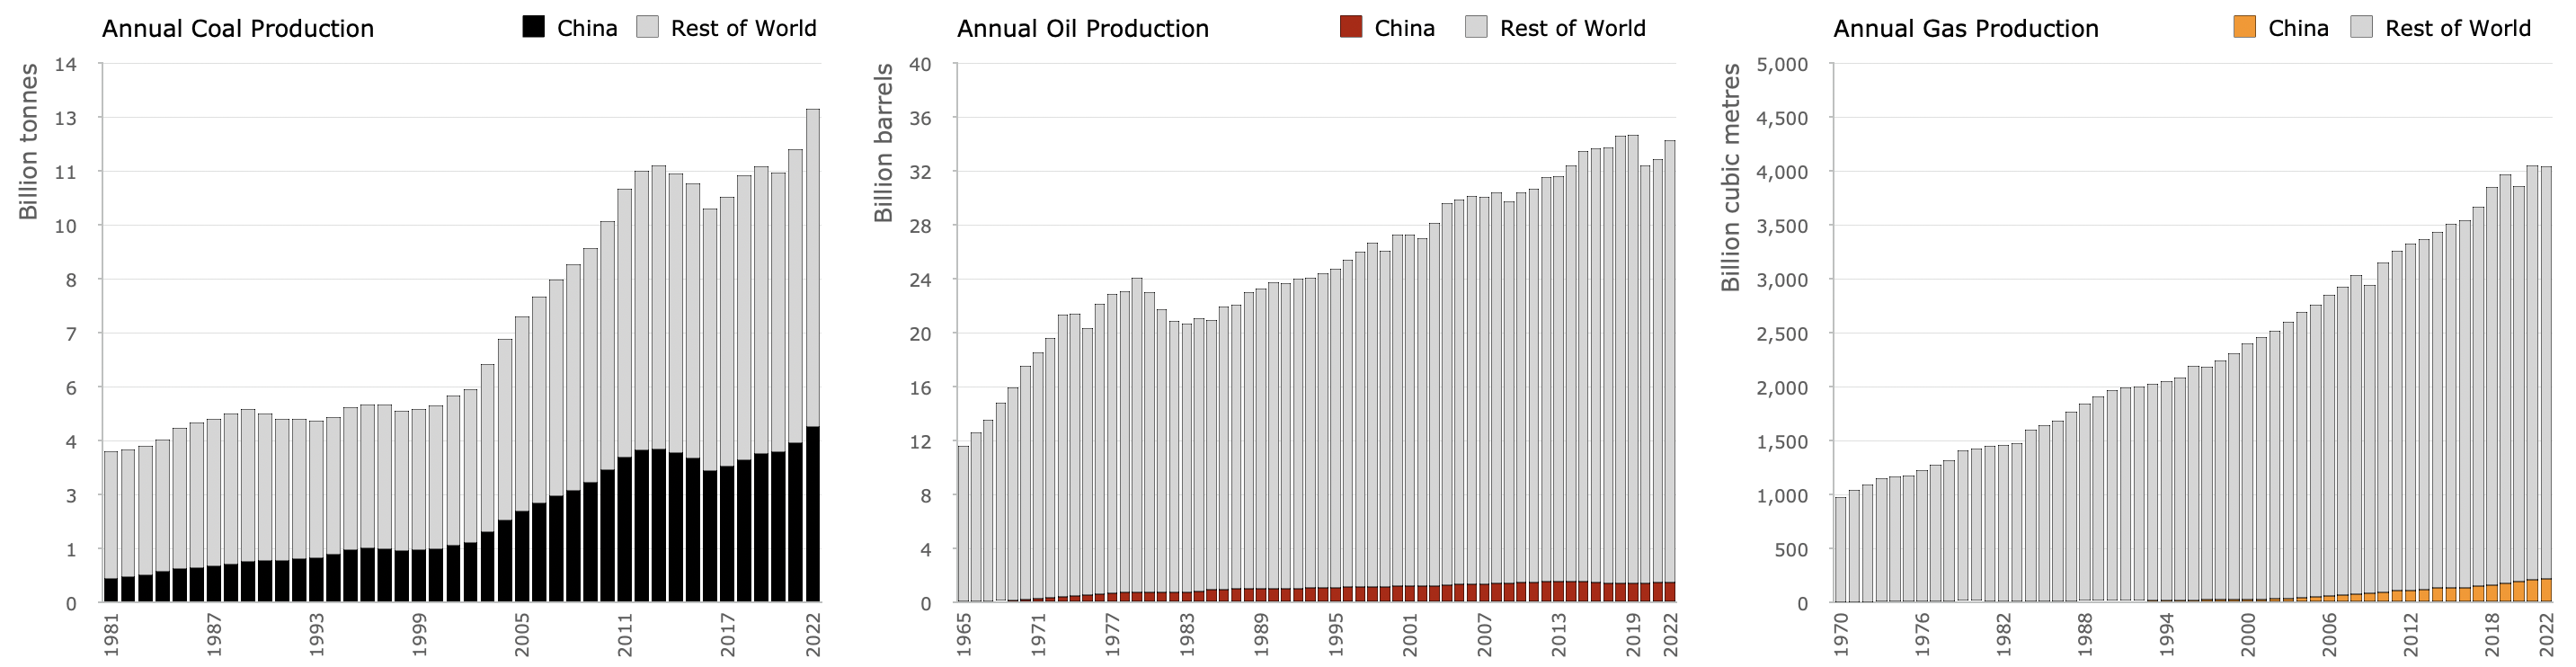
► World’s largest coal producer2.
► Record coal production in 20223.
China is approving new coal power projects at the equivalent of two plants every week.
https://www.worldenergydata.org/china-continues-coal-spree-despite-climate-goals/
Fossil Fuel Production
Carbon Dioxide (CO₂) Emissions
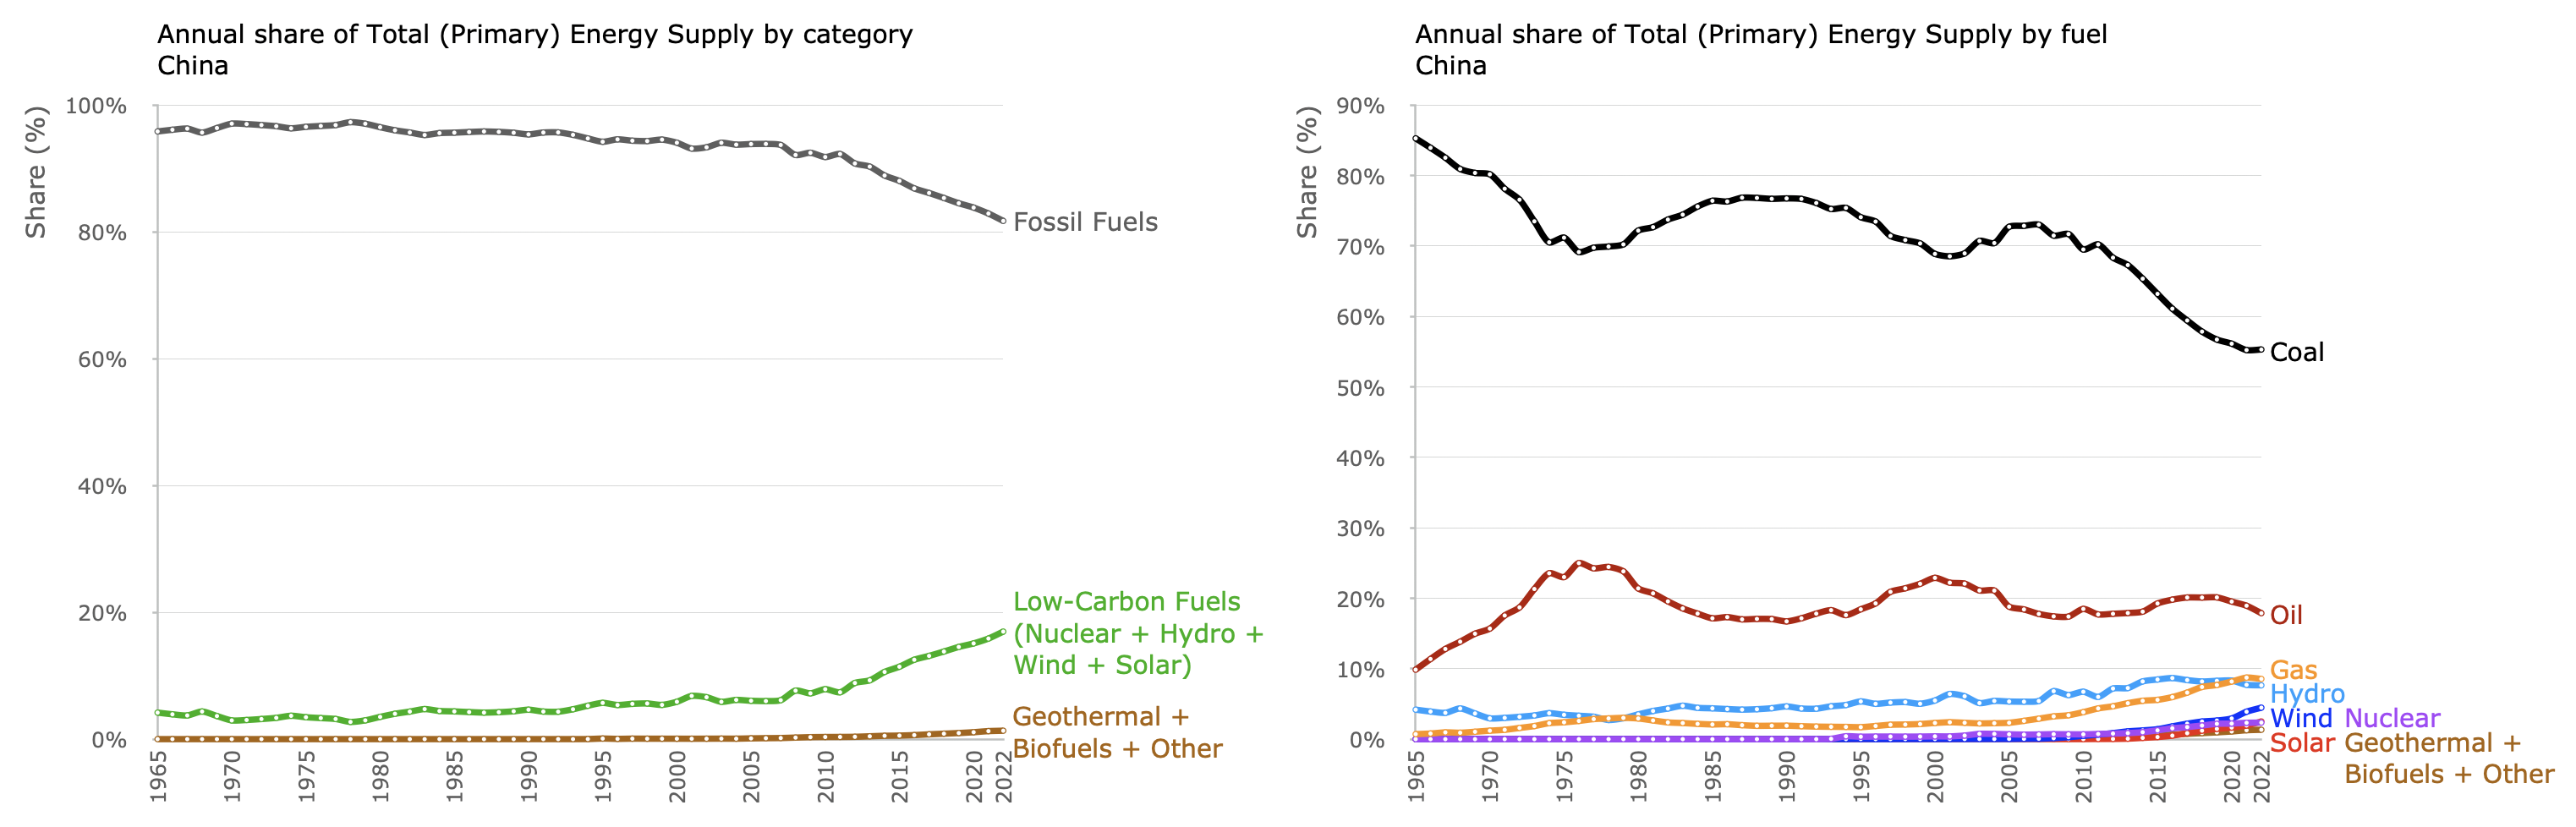
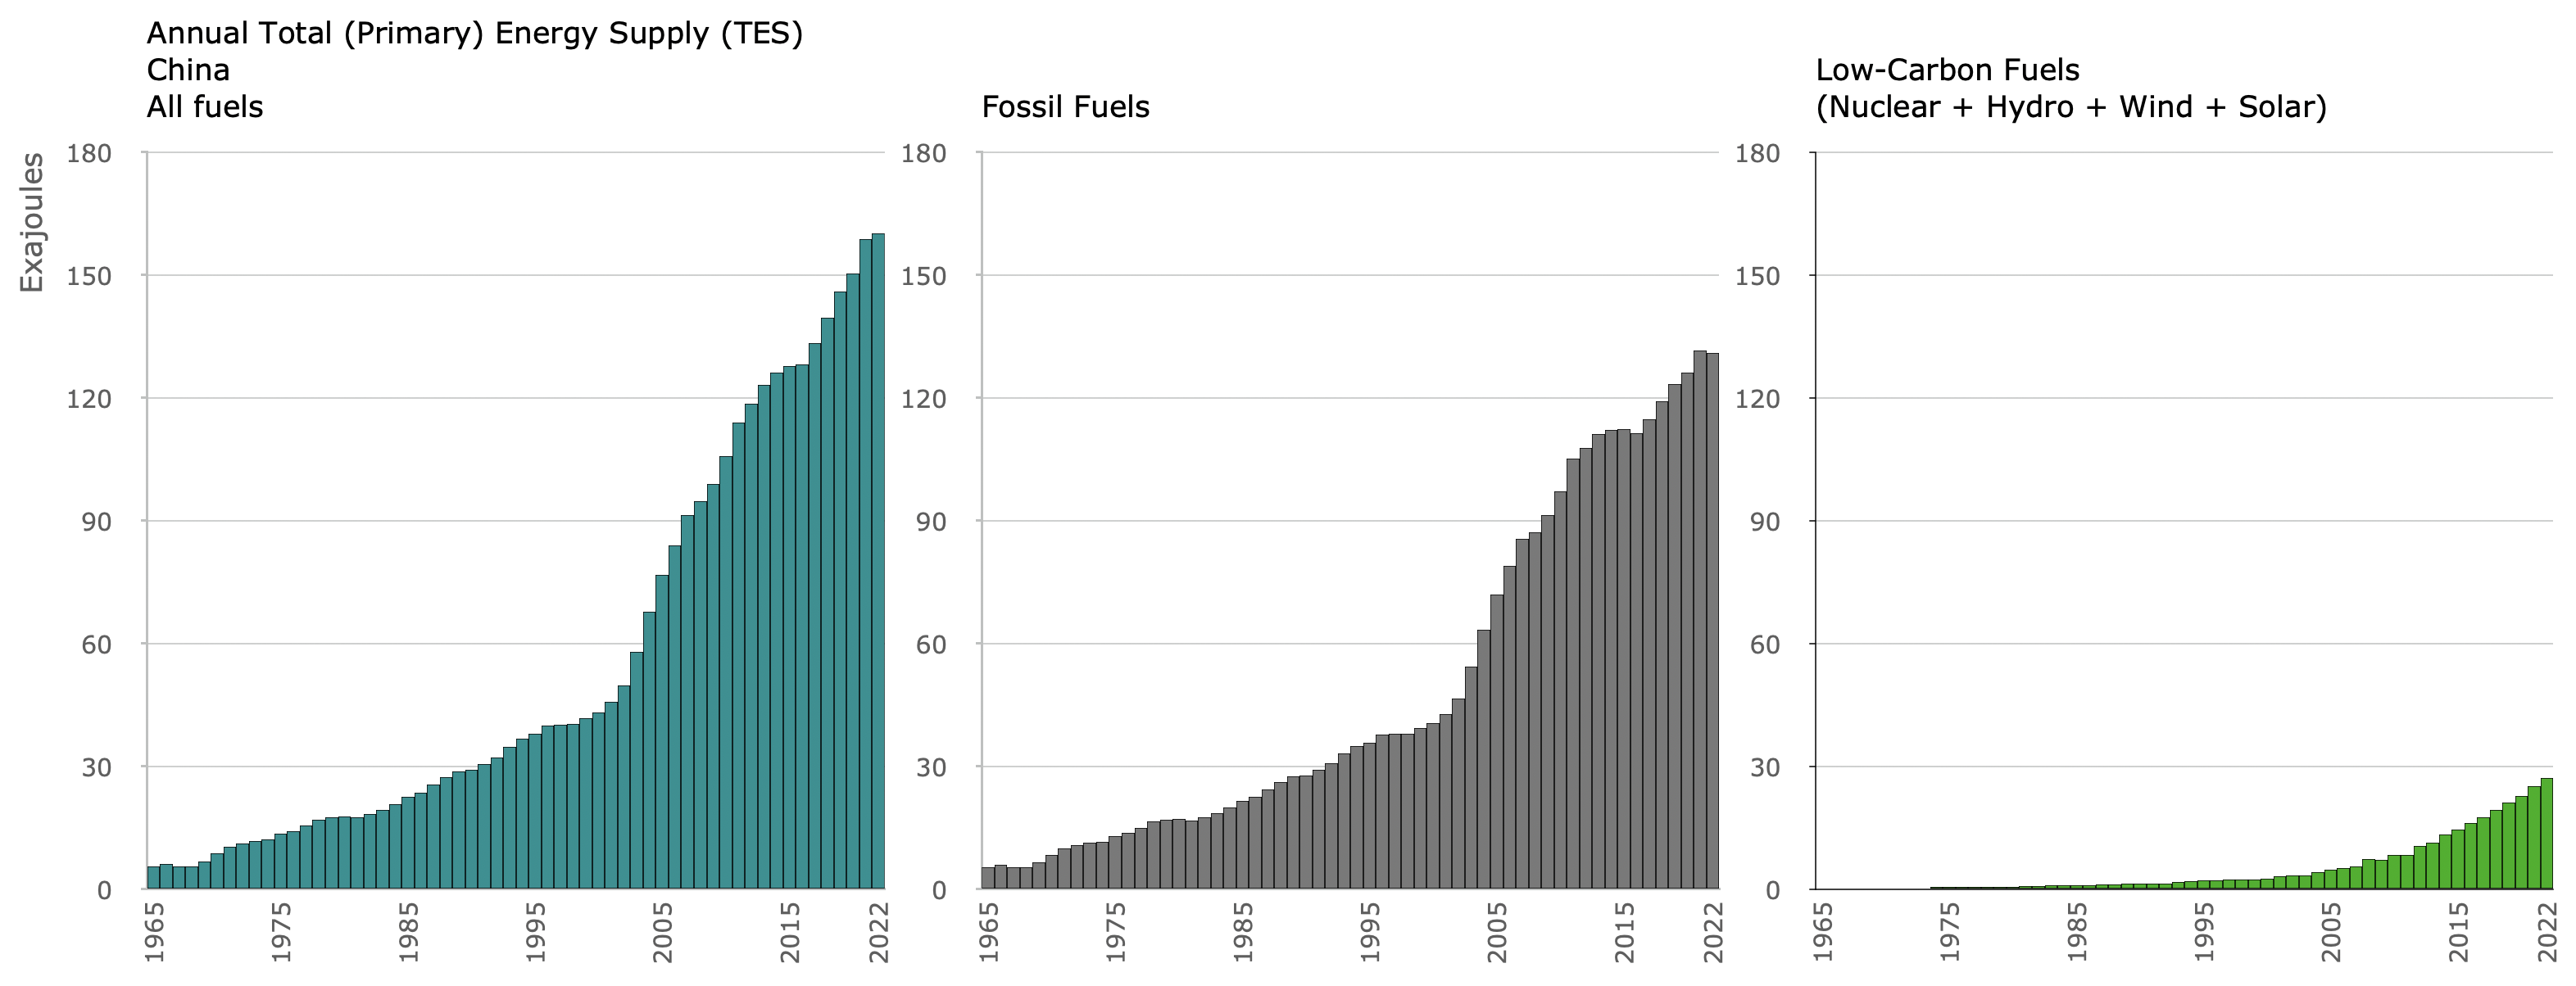
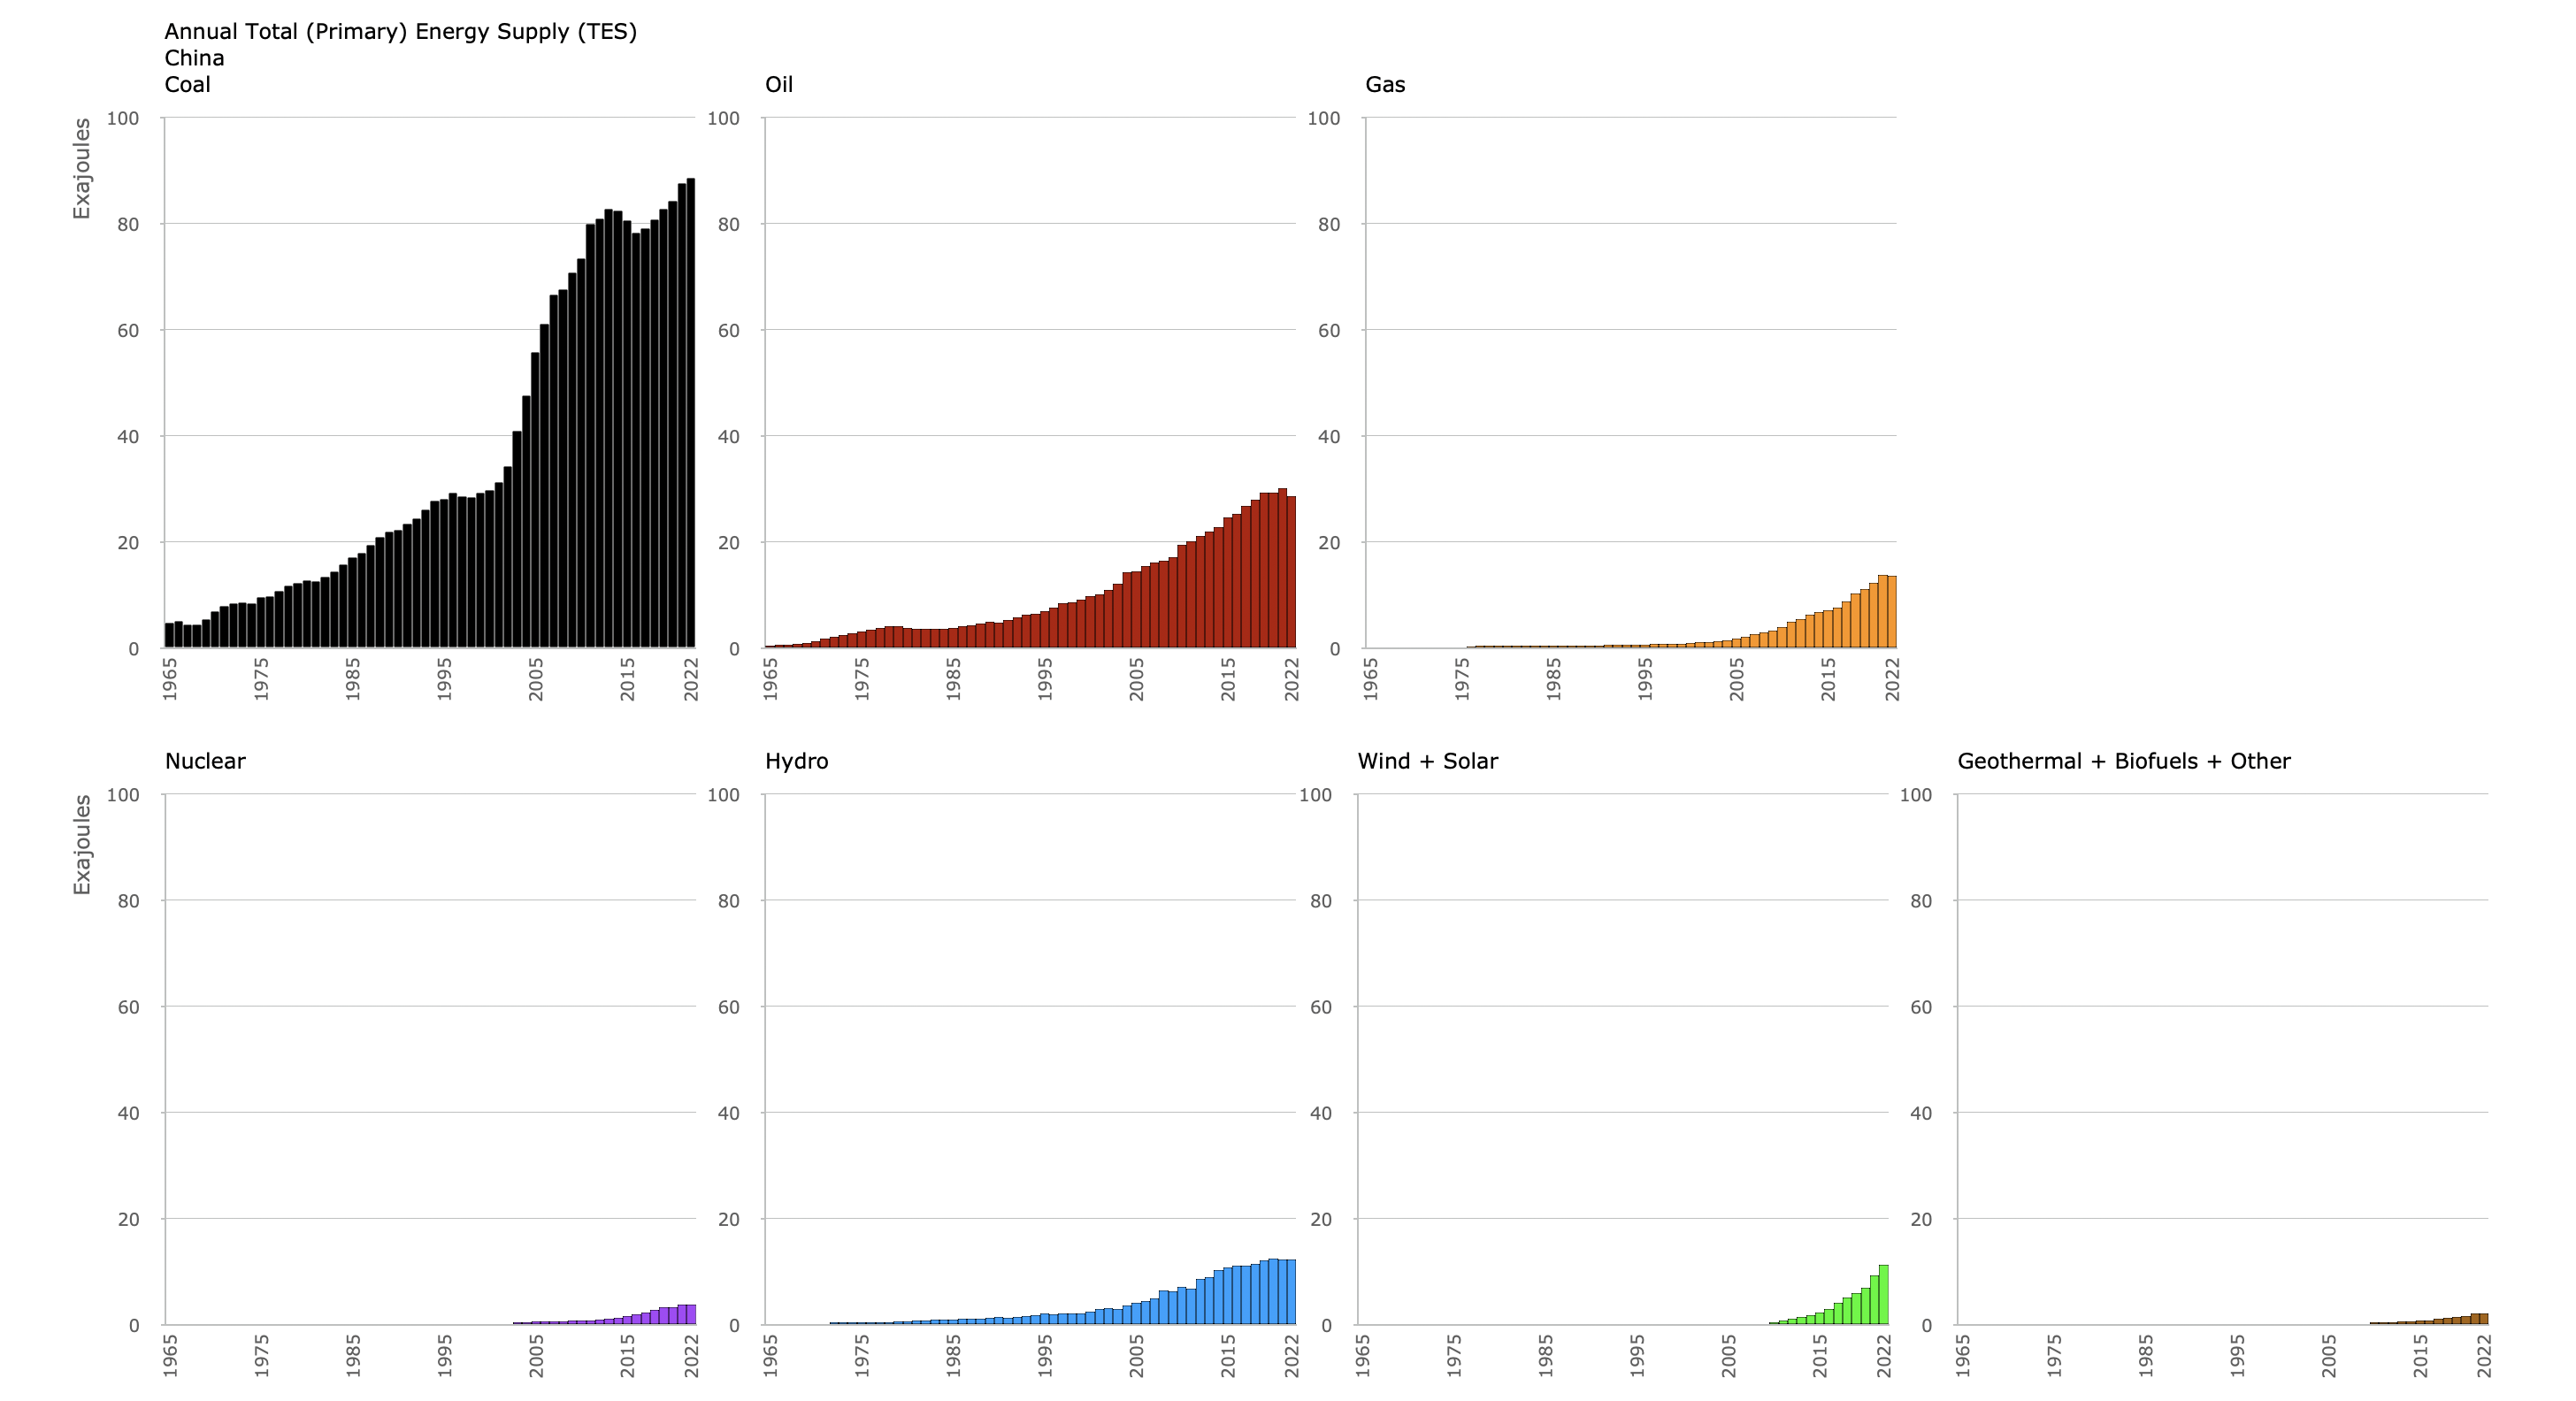
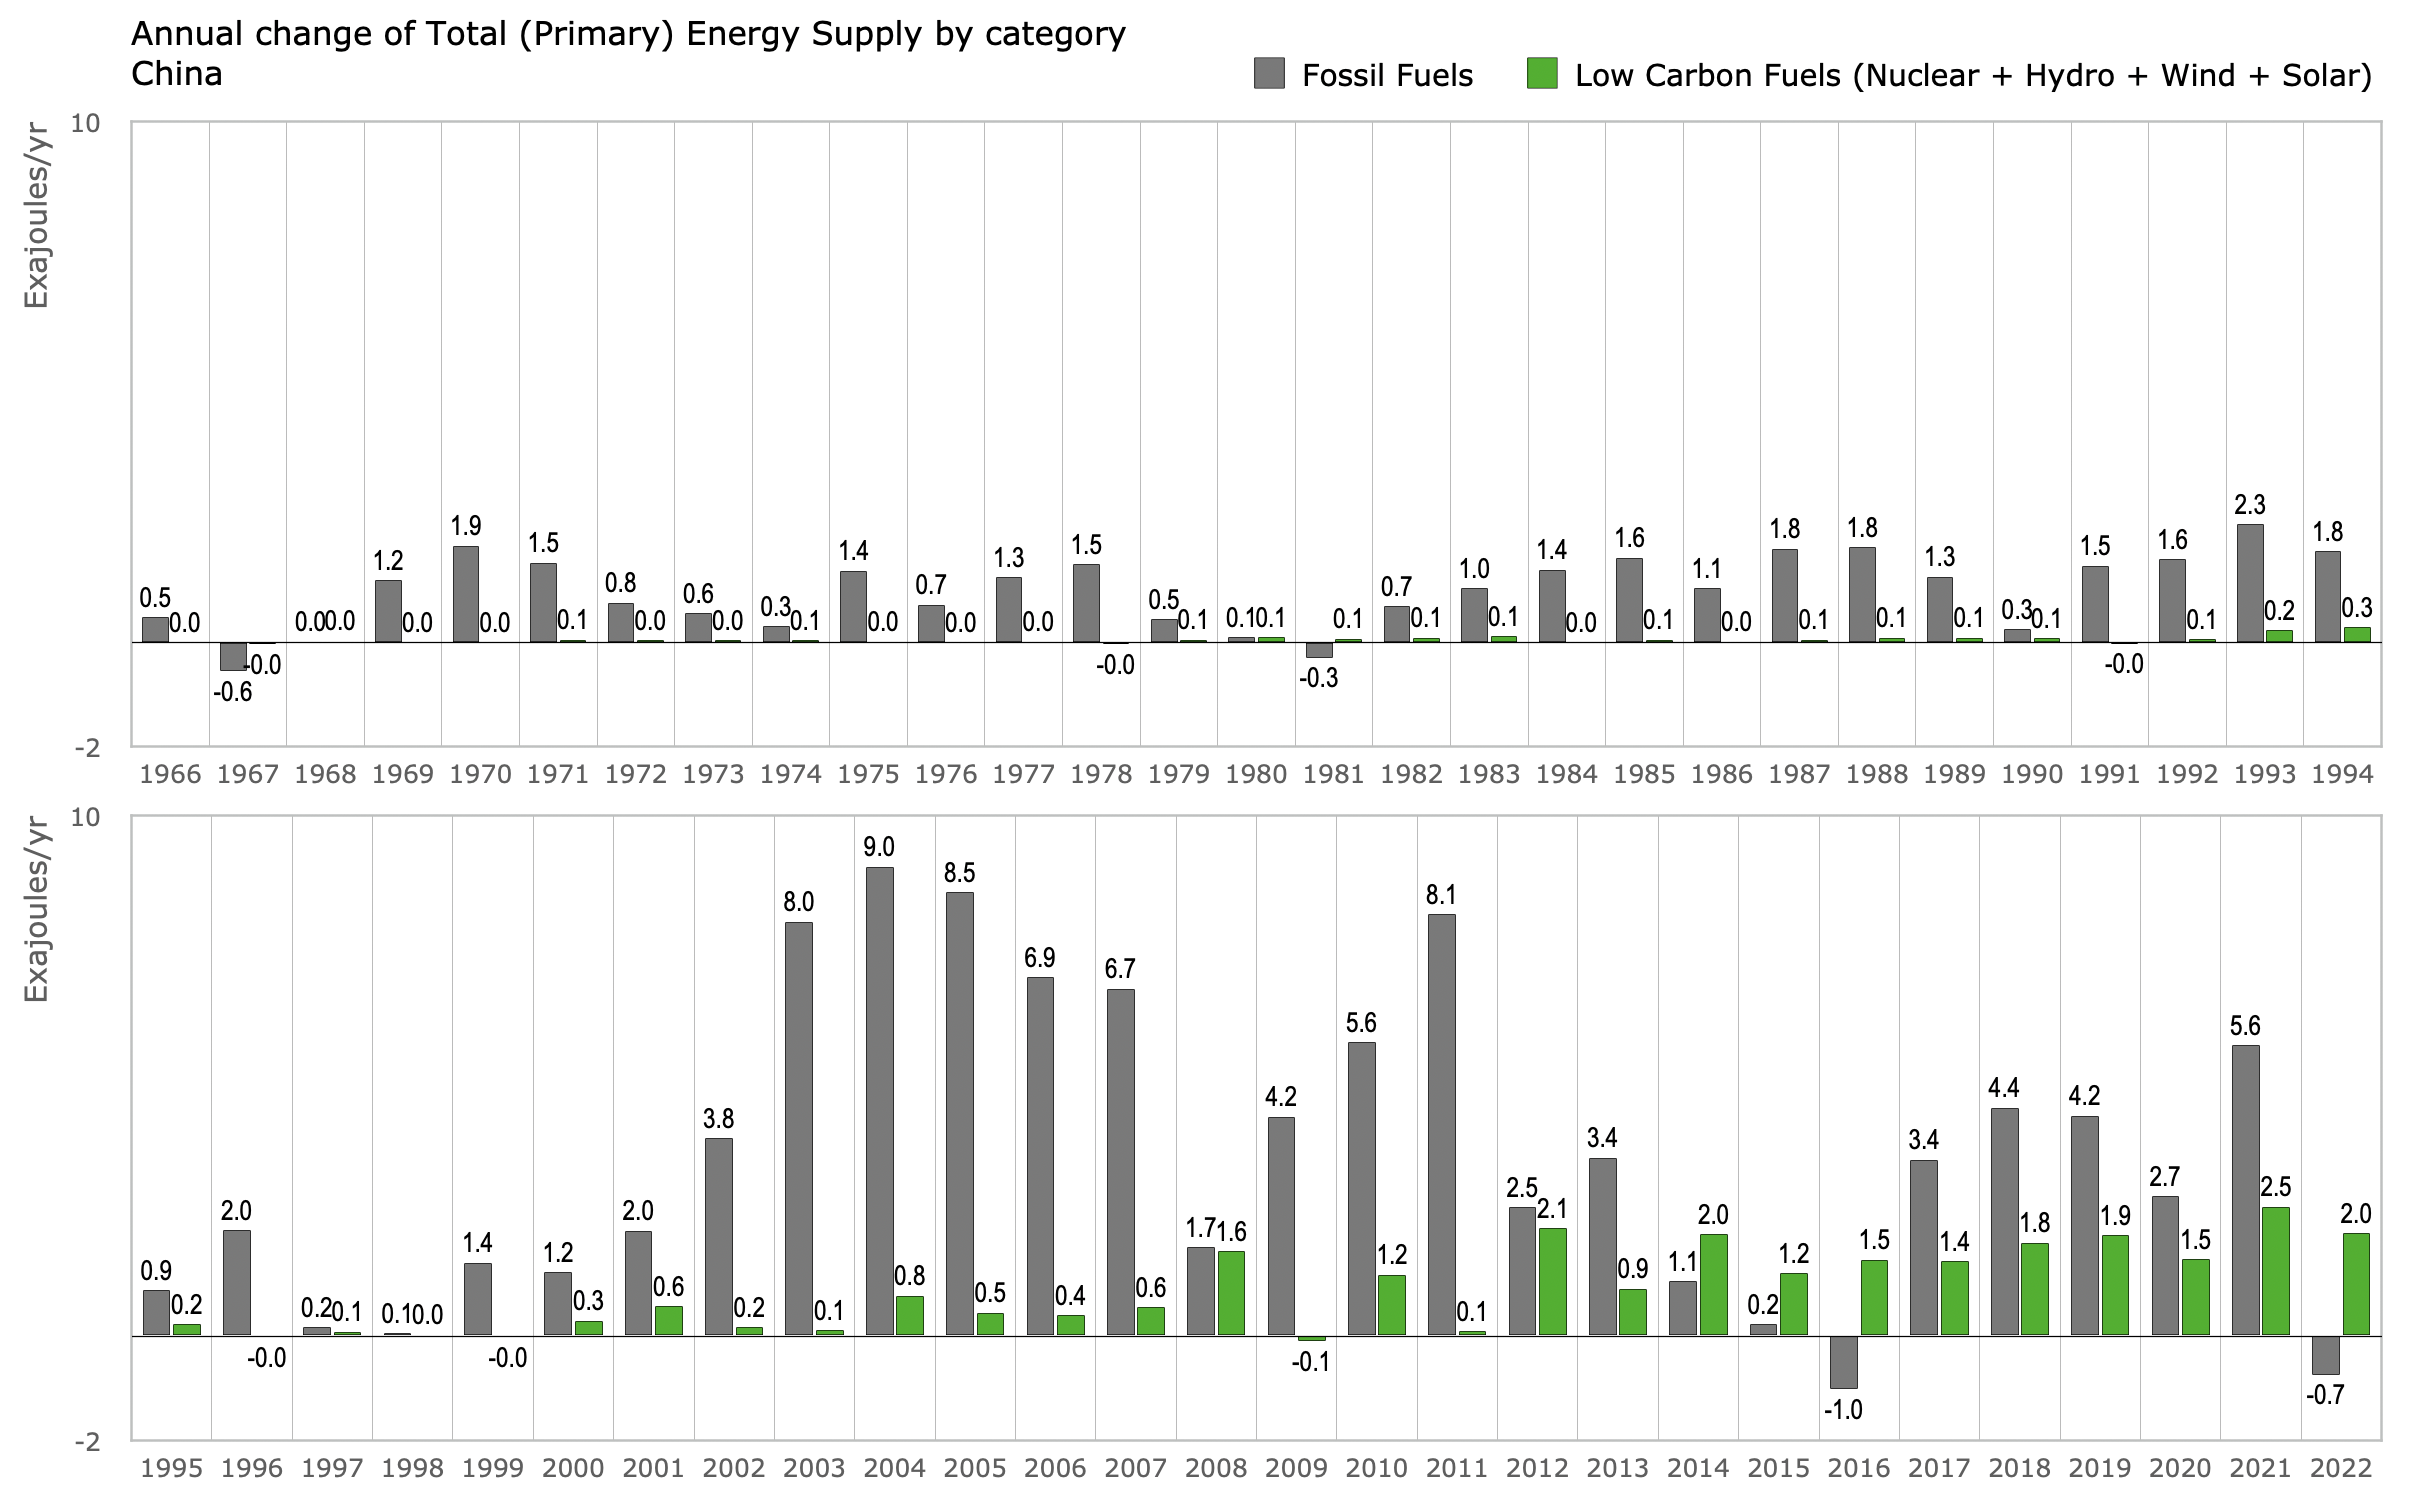
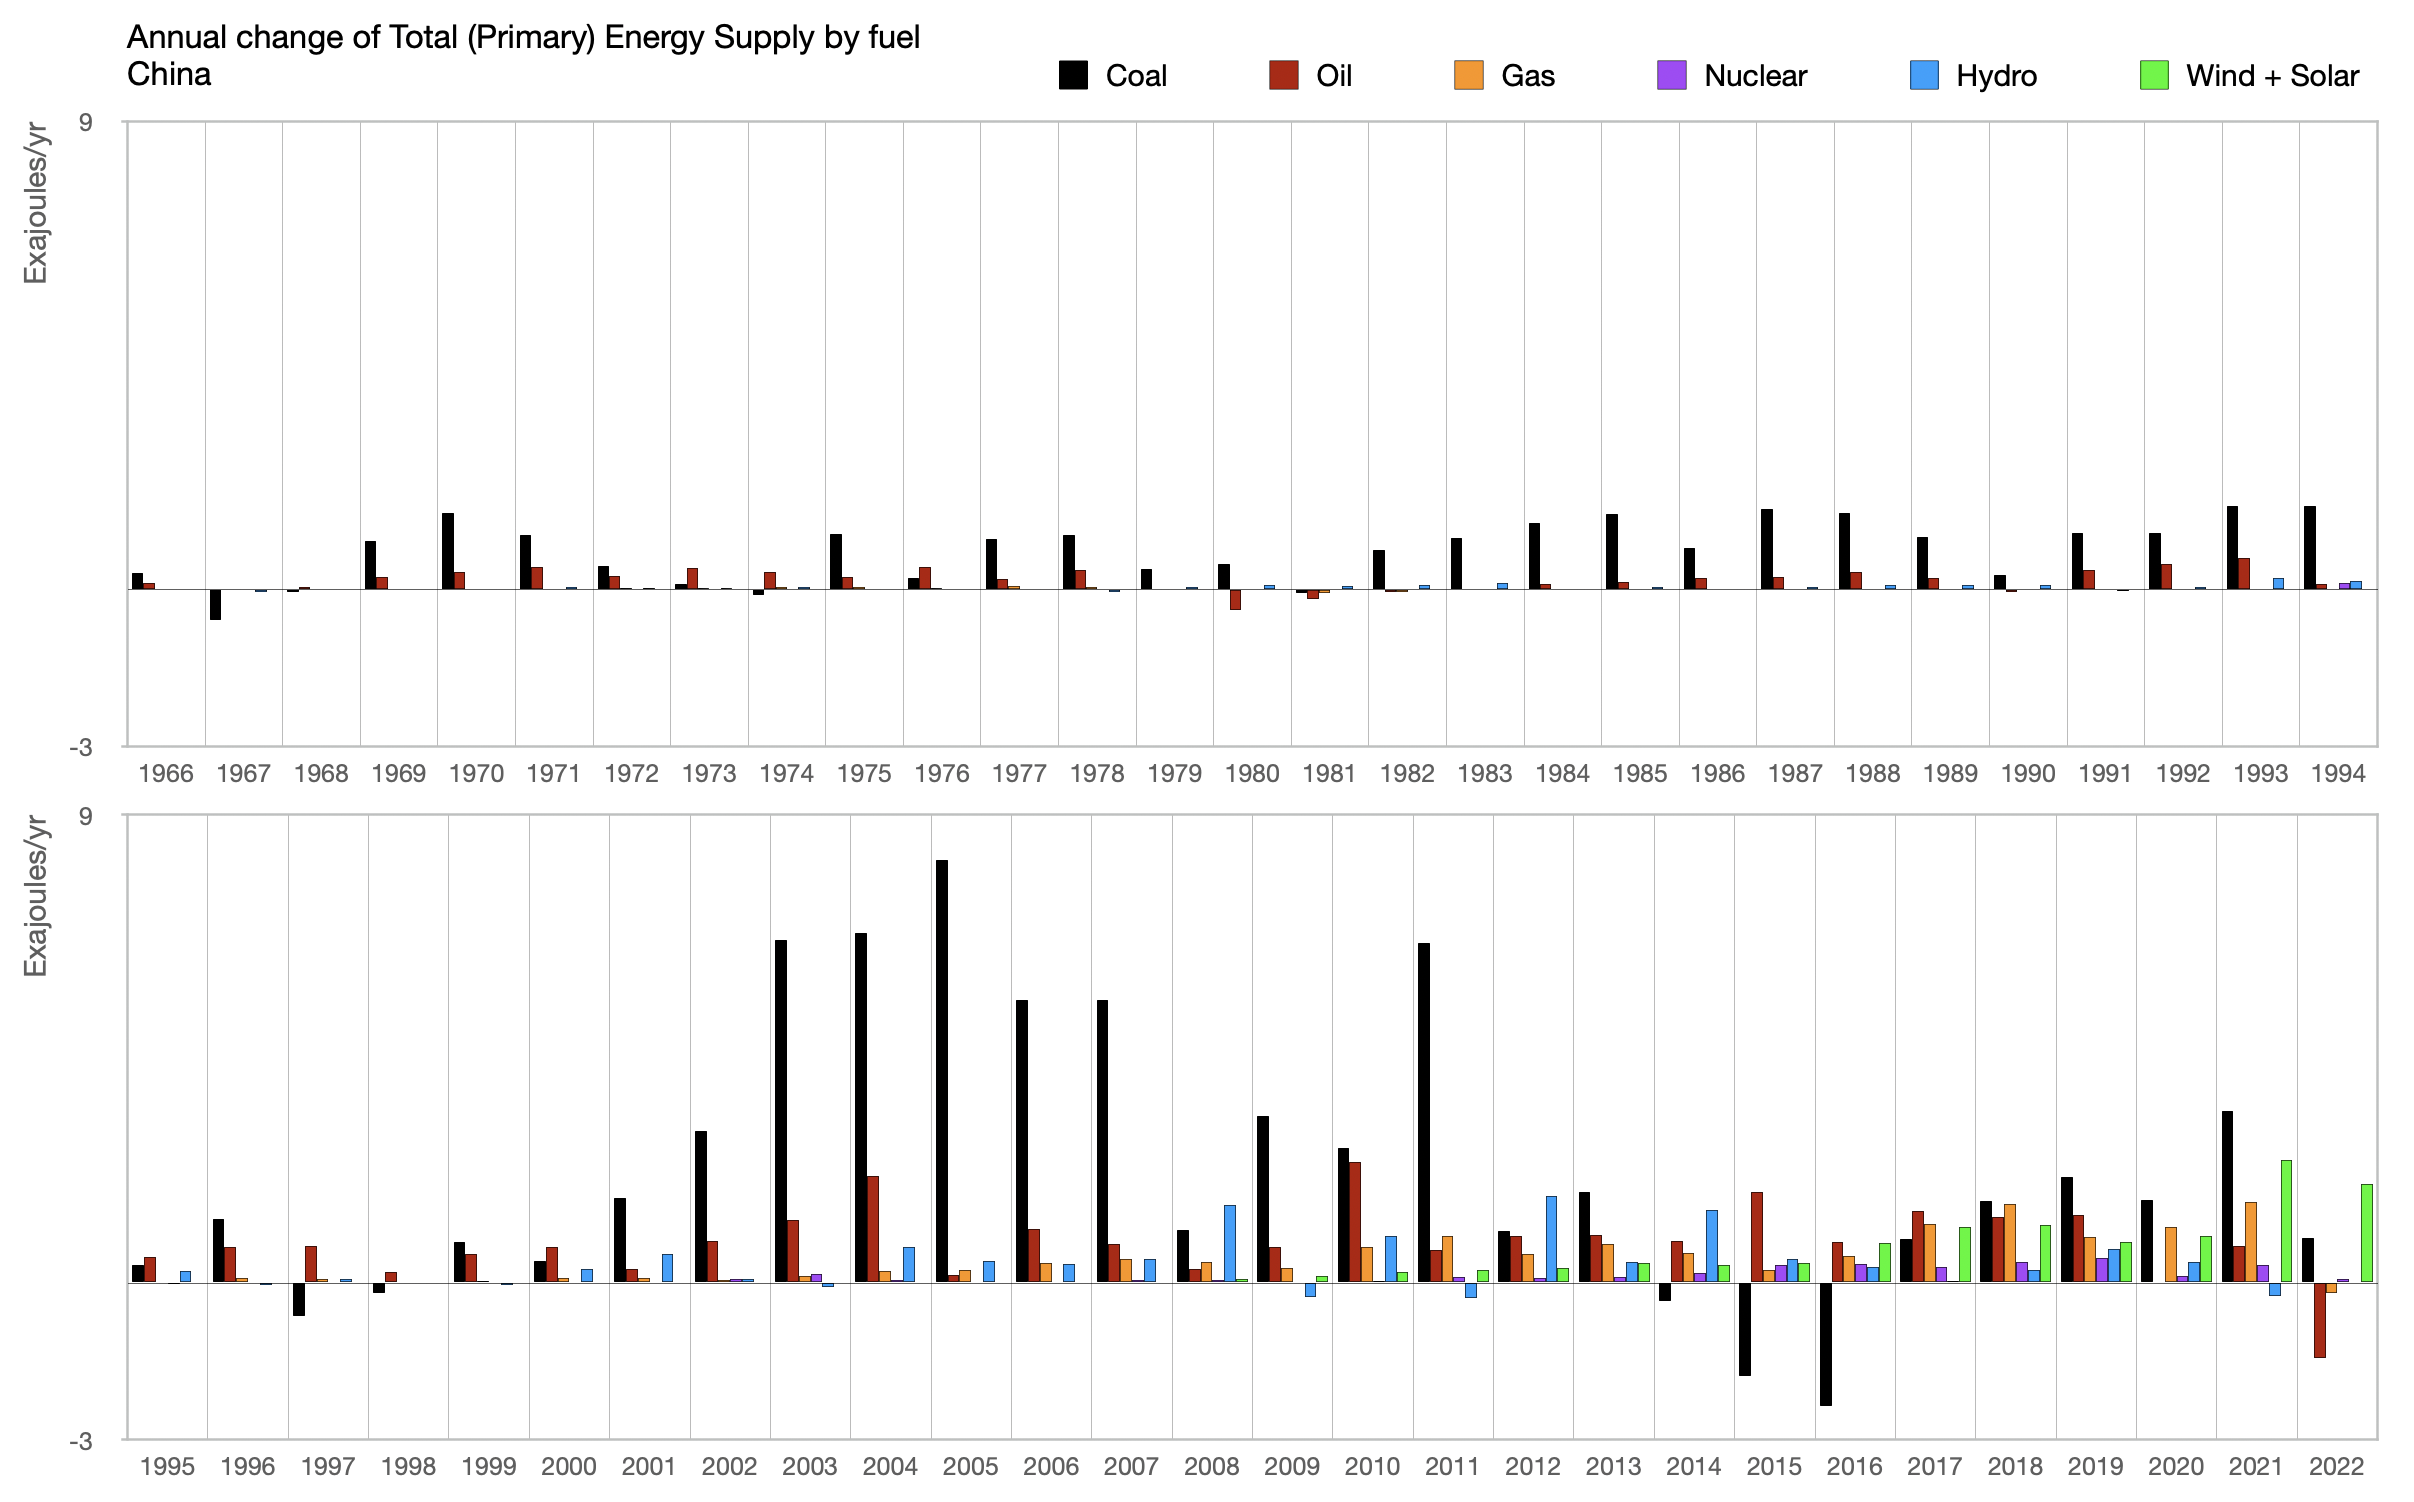
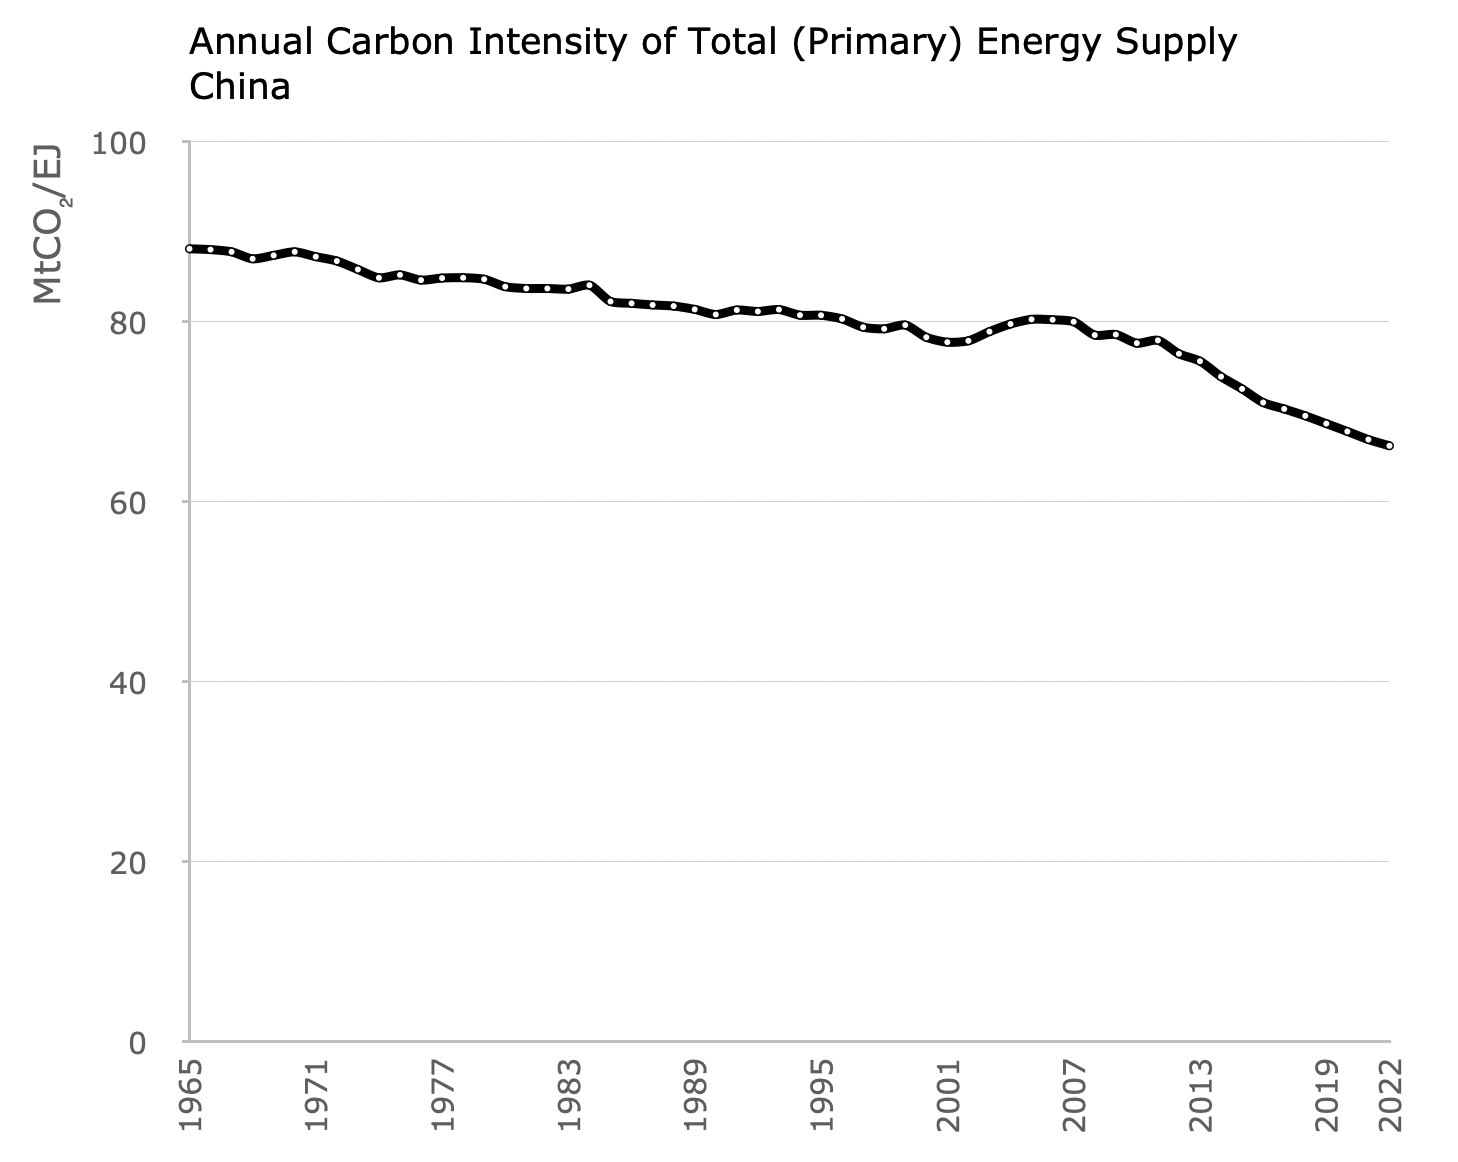
Total (Primary) Energy Supply
By Share
Total Energy Supply (also known as ‘Primary energy’) accounts for energy supplied prior to conversions to electricity or hydrogen (see the introduction for explanation).
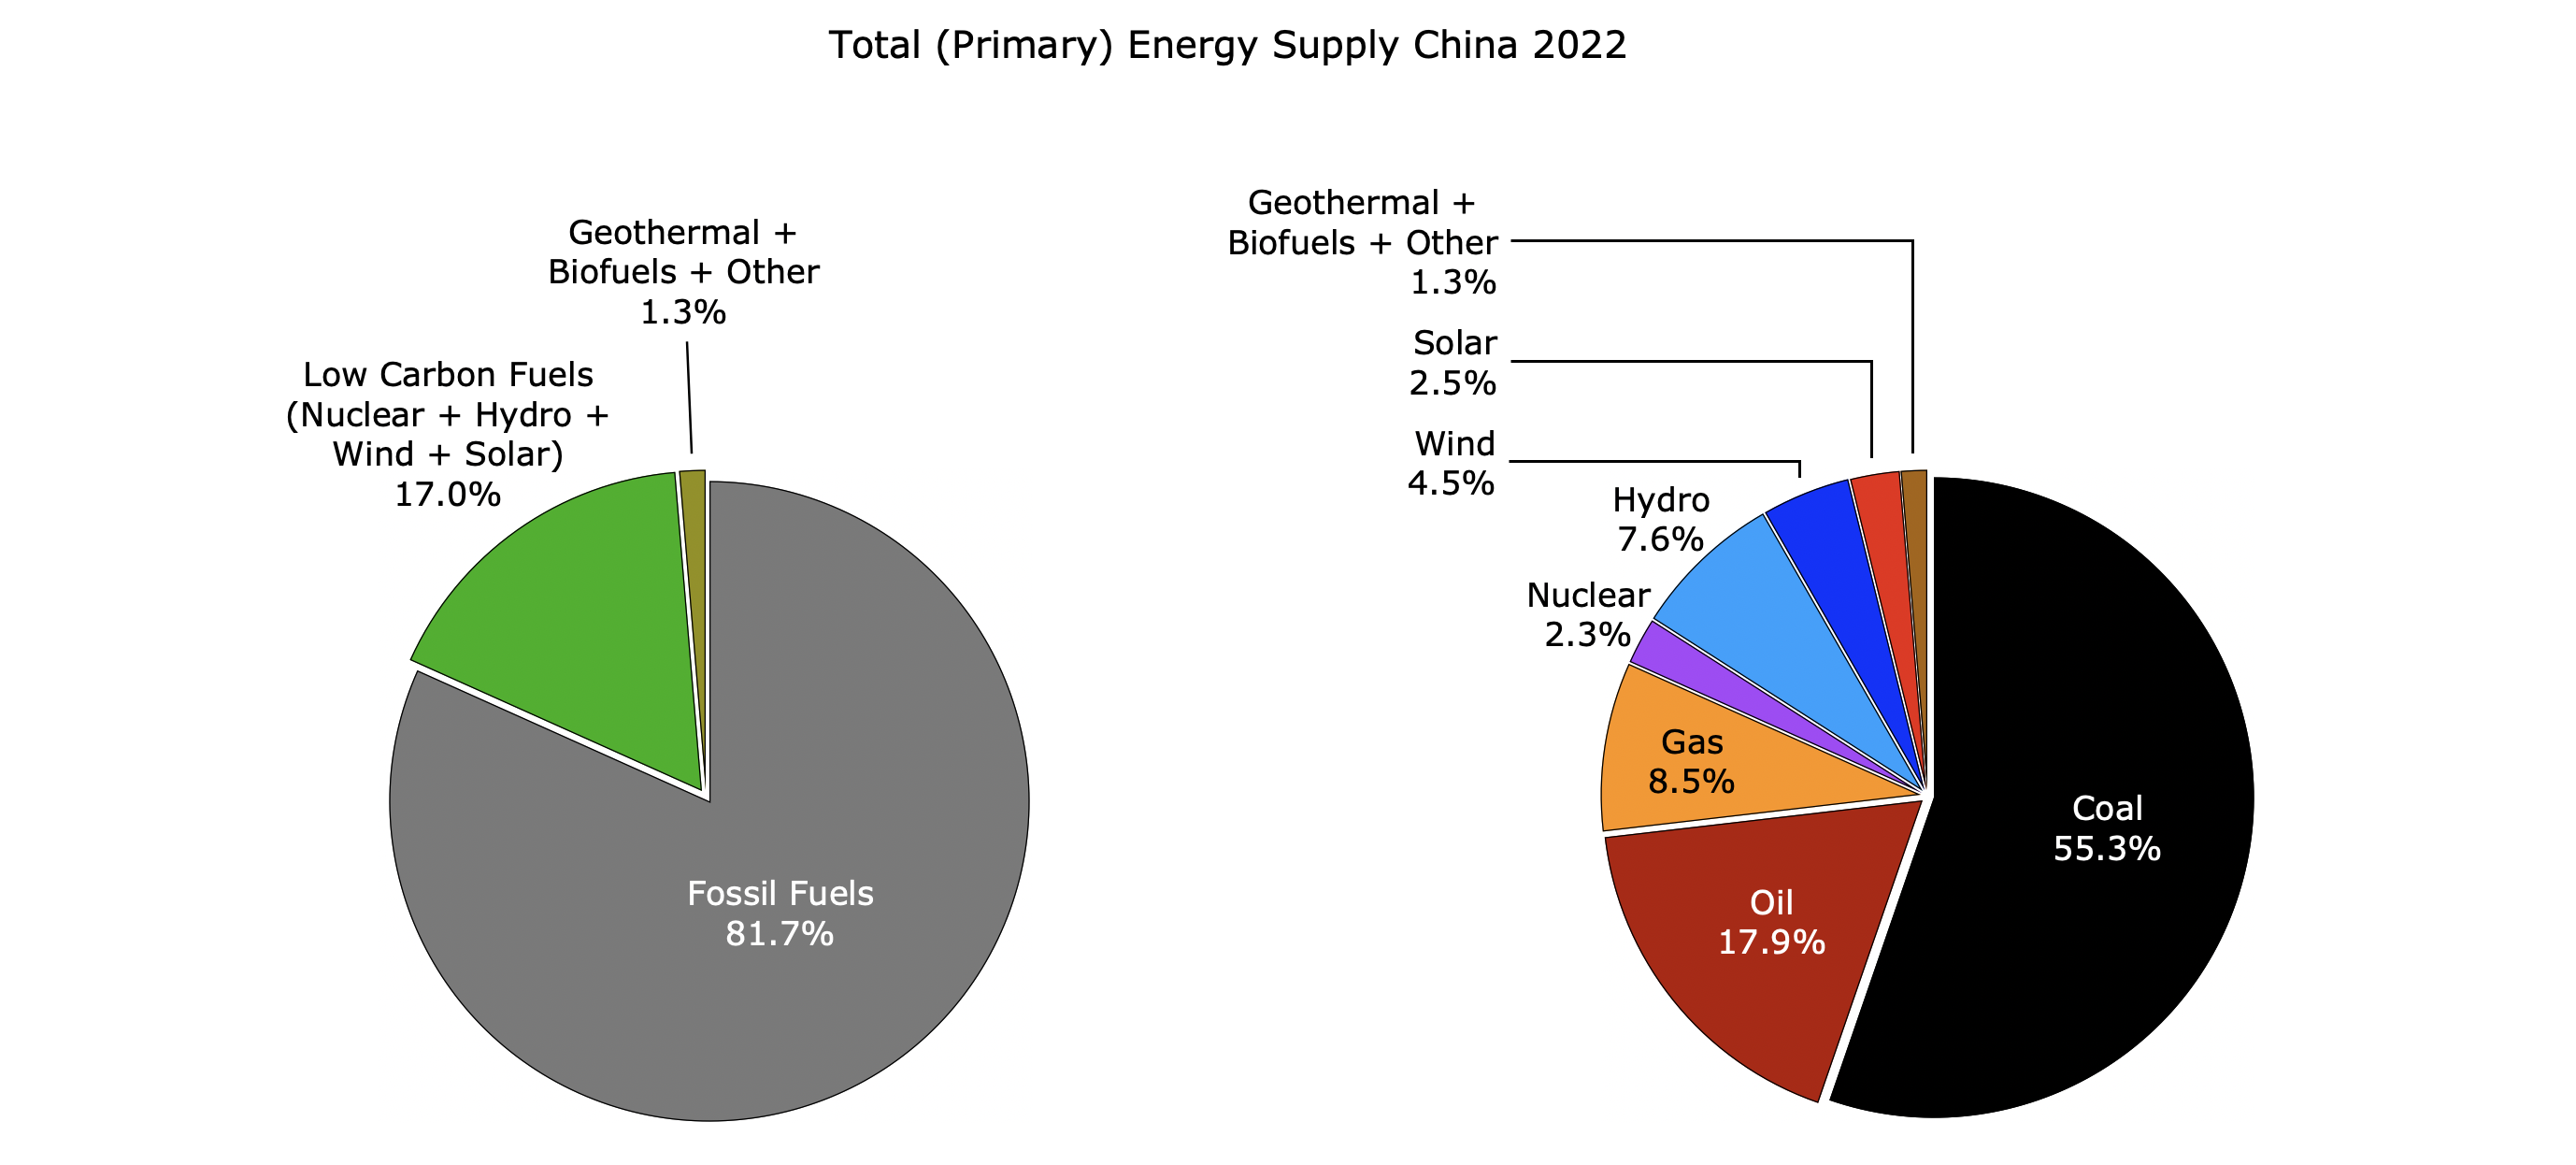
Absolute Quantities
Carbon Intensity
Energy Consumption (i.e. Final Energy)
Final energy accounts the consumption of energy in final forms, and therefore can account for electricity separately from heat (e.g energy consumed for steel manufacture, or by transport). Unlike primary energy, final energy does not rely on calculating equivalences for non-combustible fuels such as solar and wind (see the introduction for explanation).
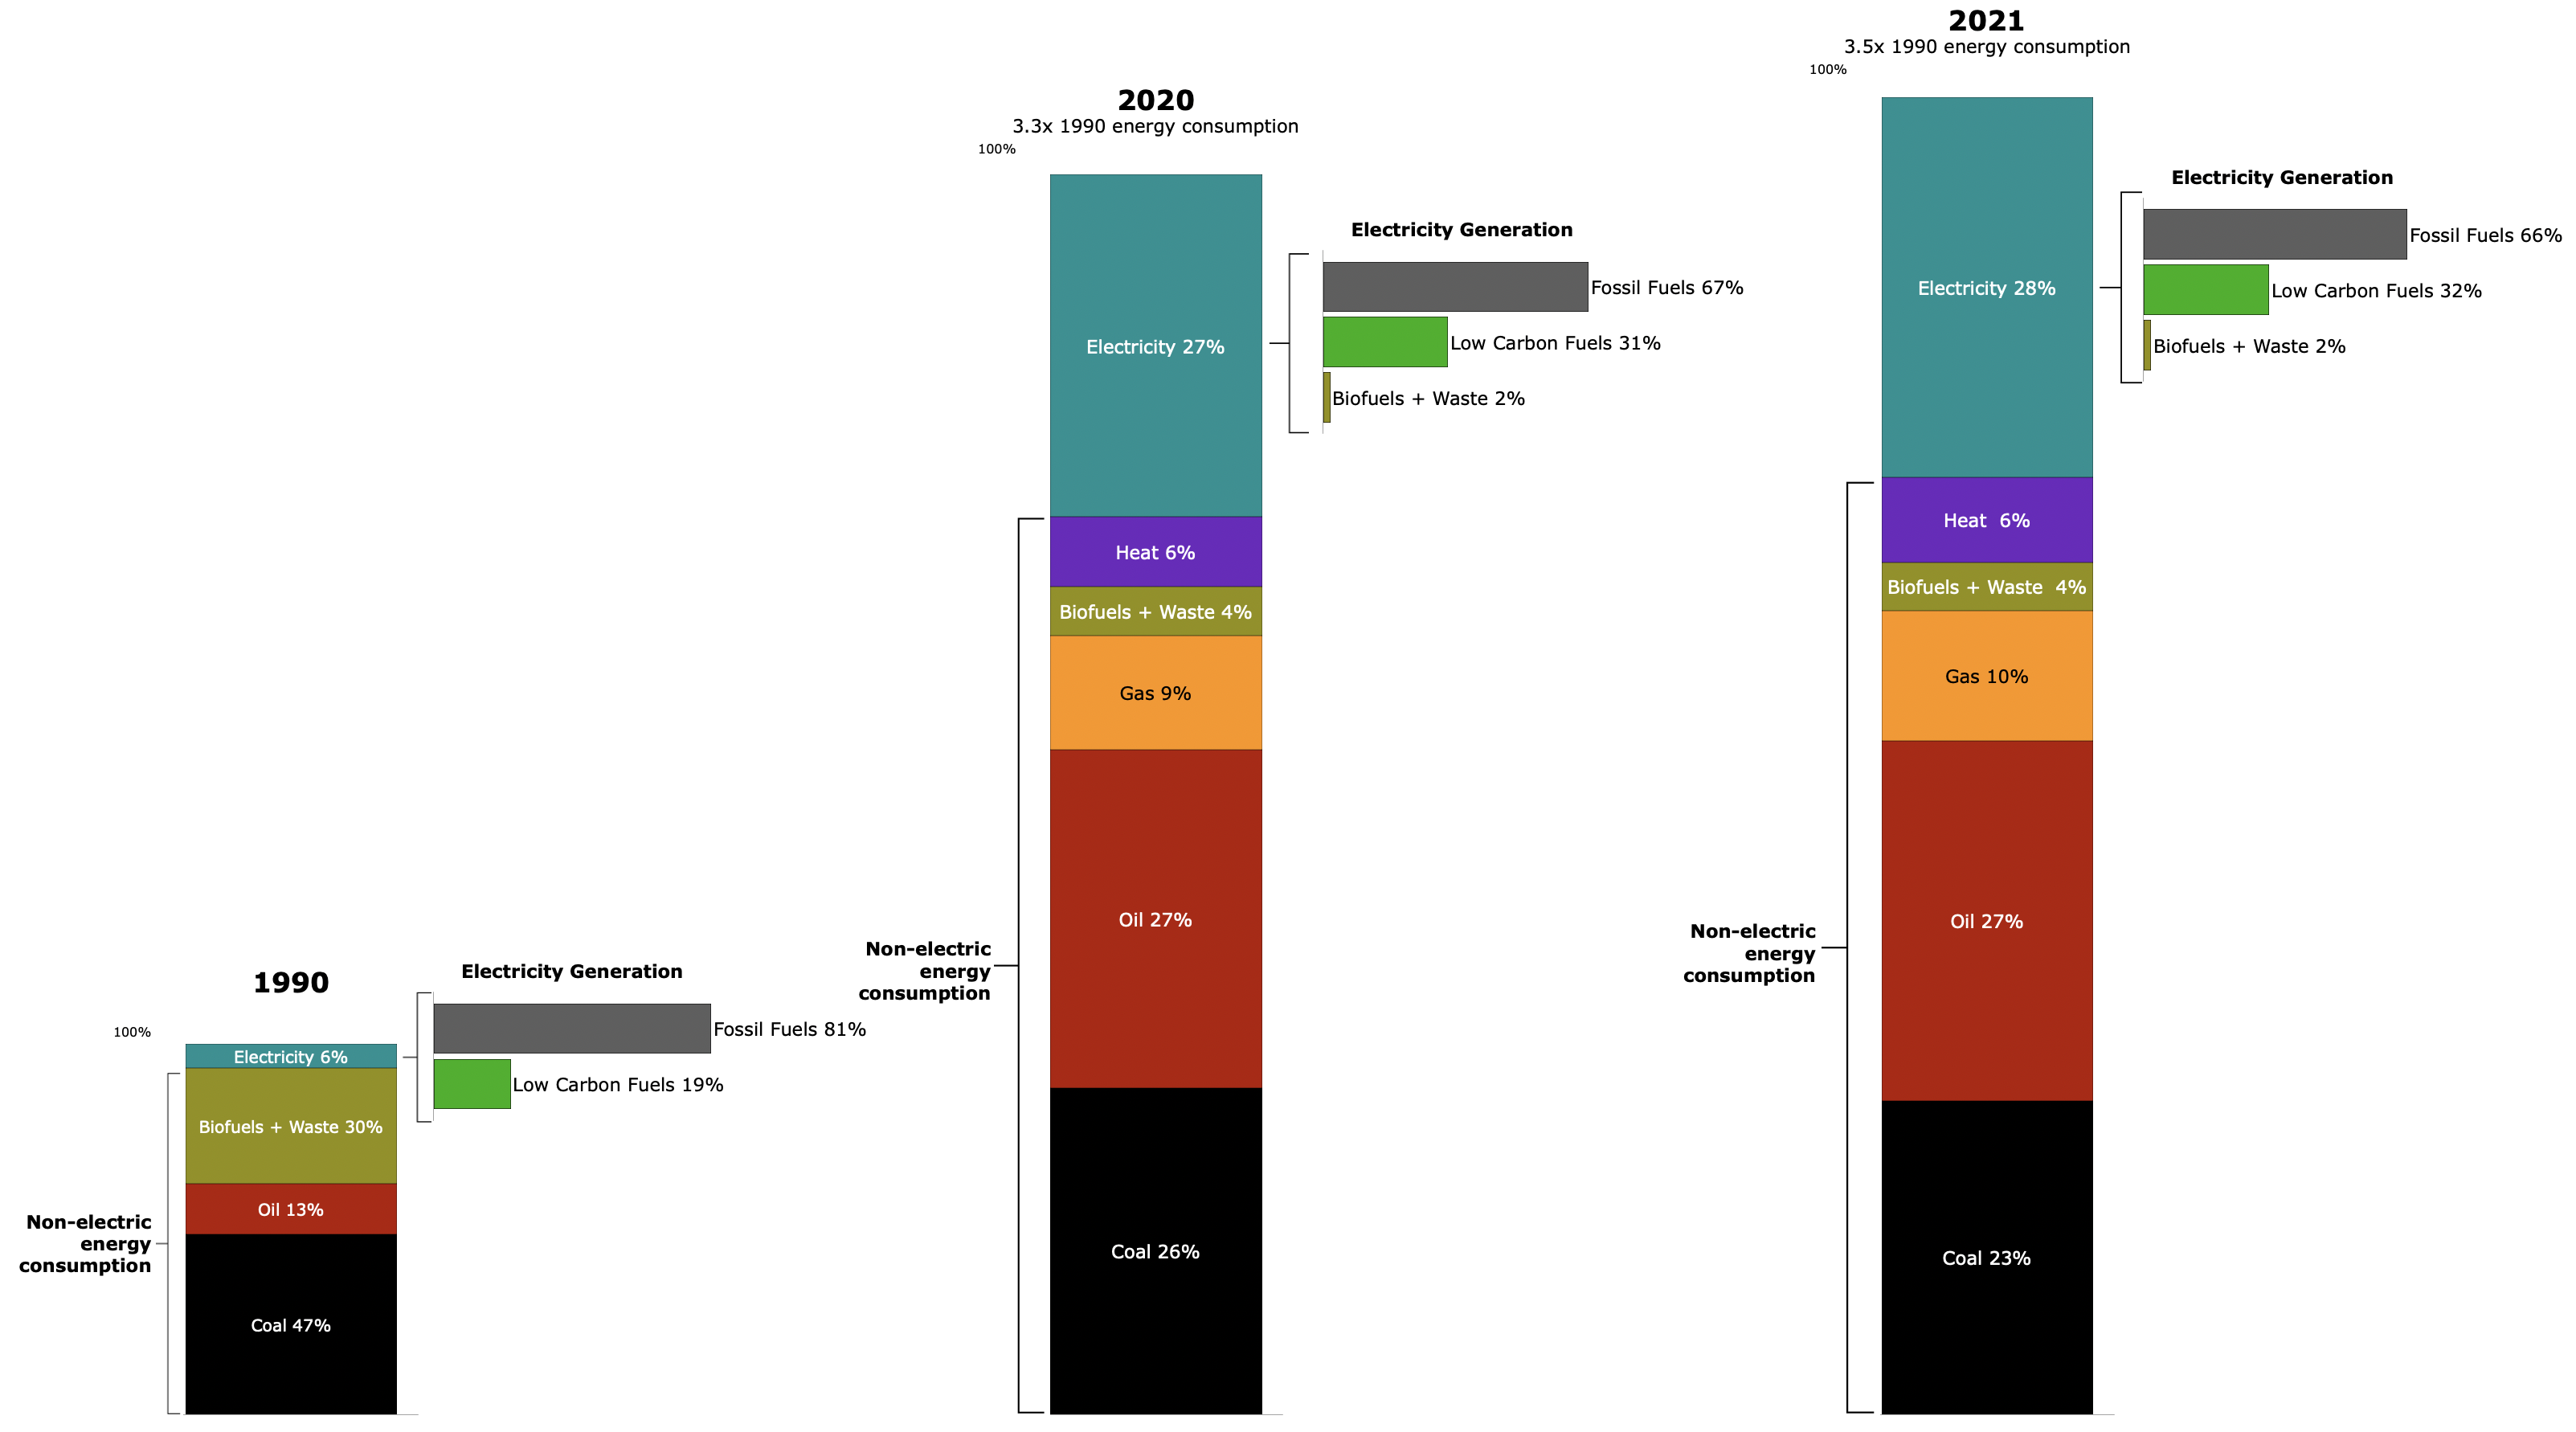
Total of displayed shares will not equal 100% because, for clarity, values are rounded and segments <3% share are not shown.
The height of each column is the total annual energy consumption relative to 1990.
The Heat share refers to consumed heat produced by combined heat and power plants, and chemical reactions etc.
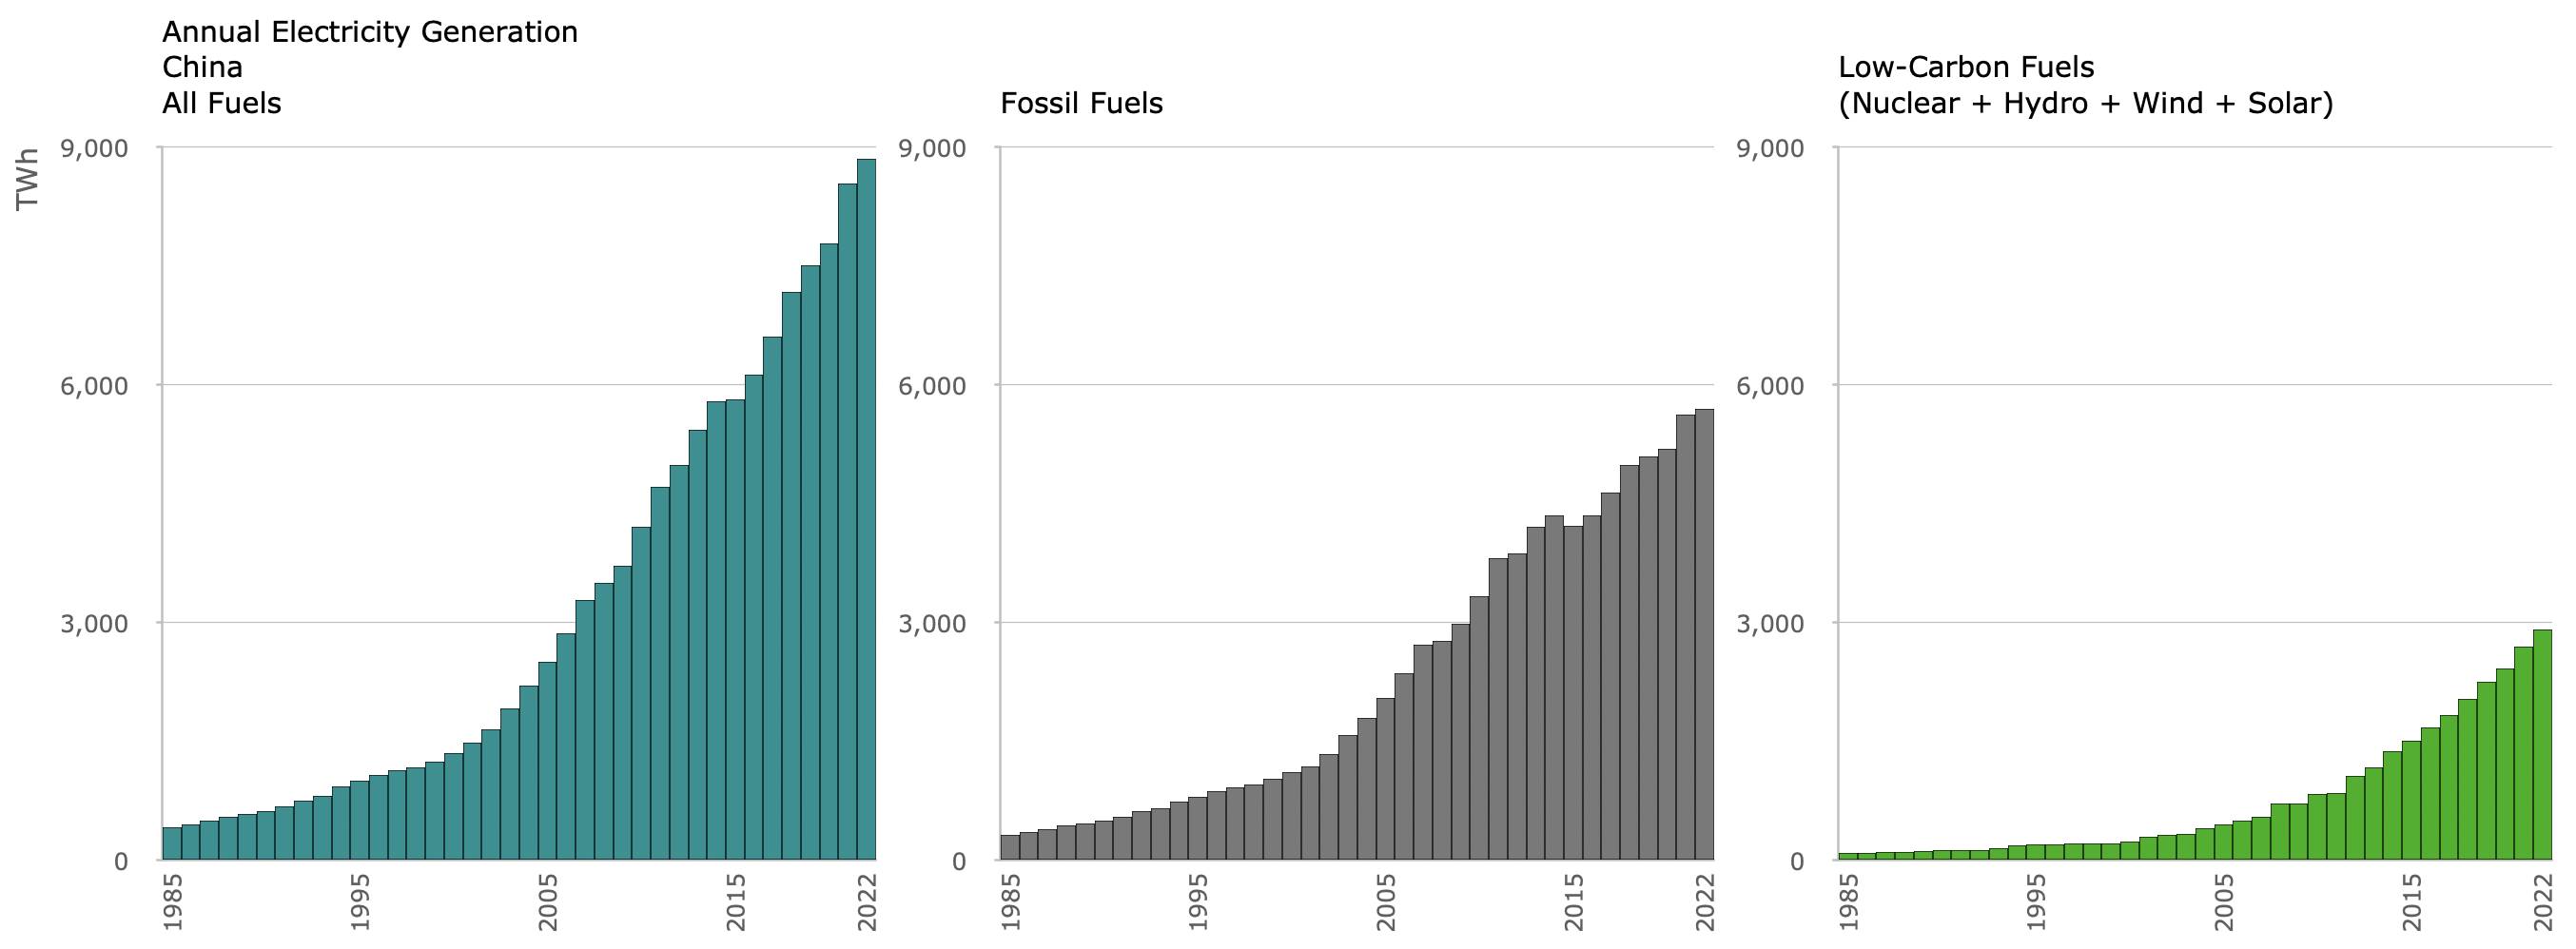
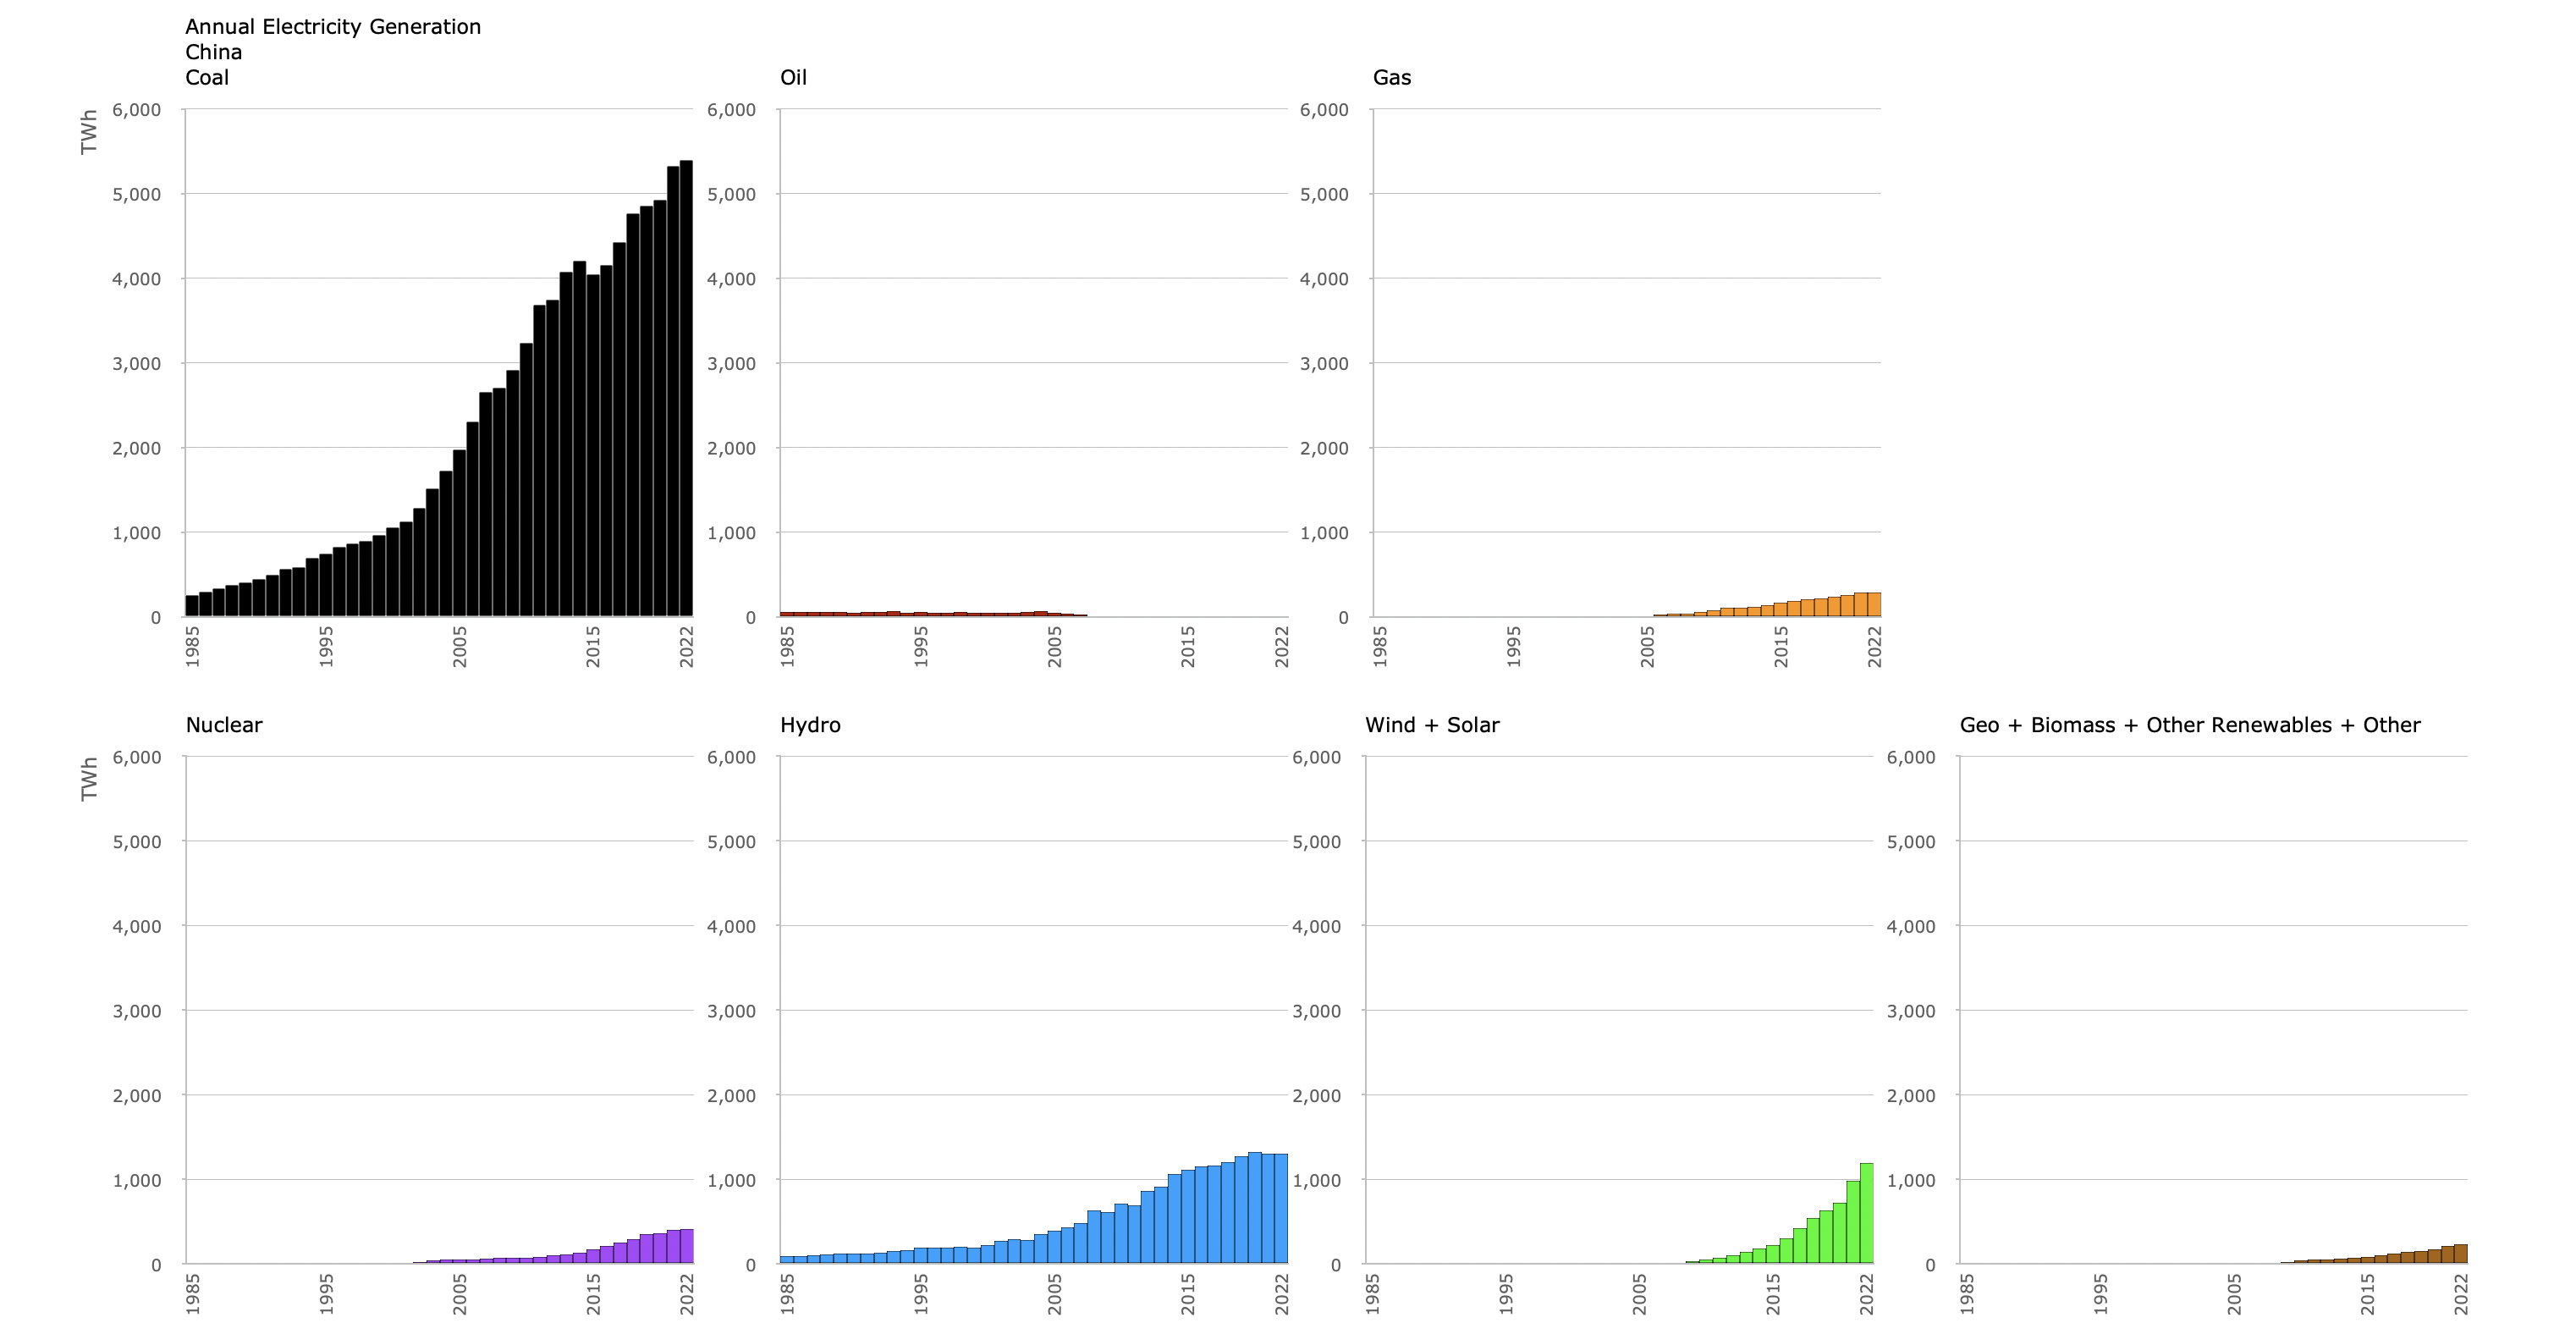
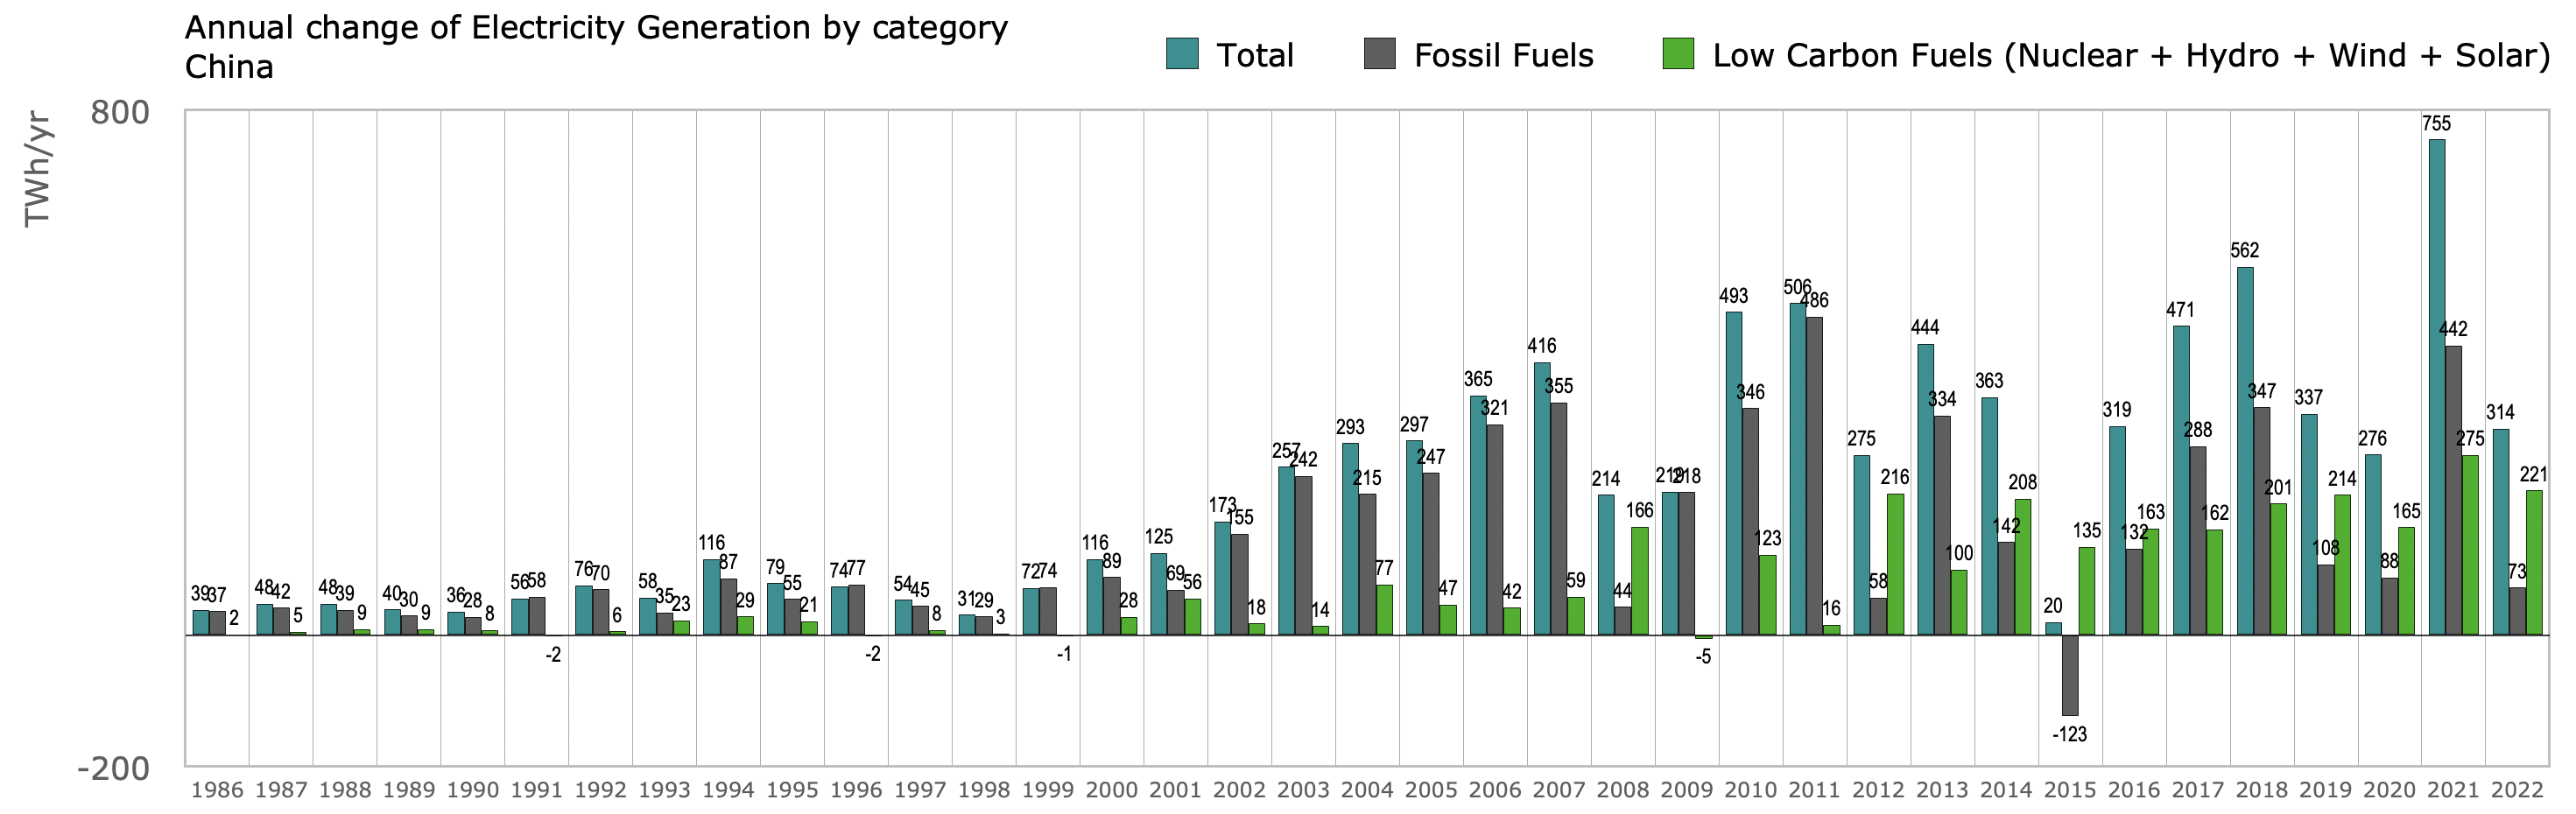
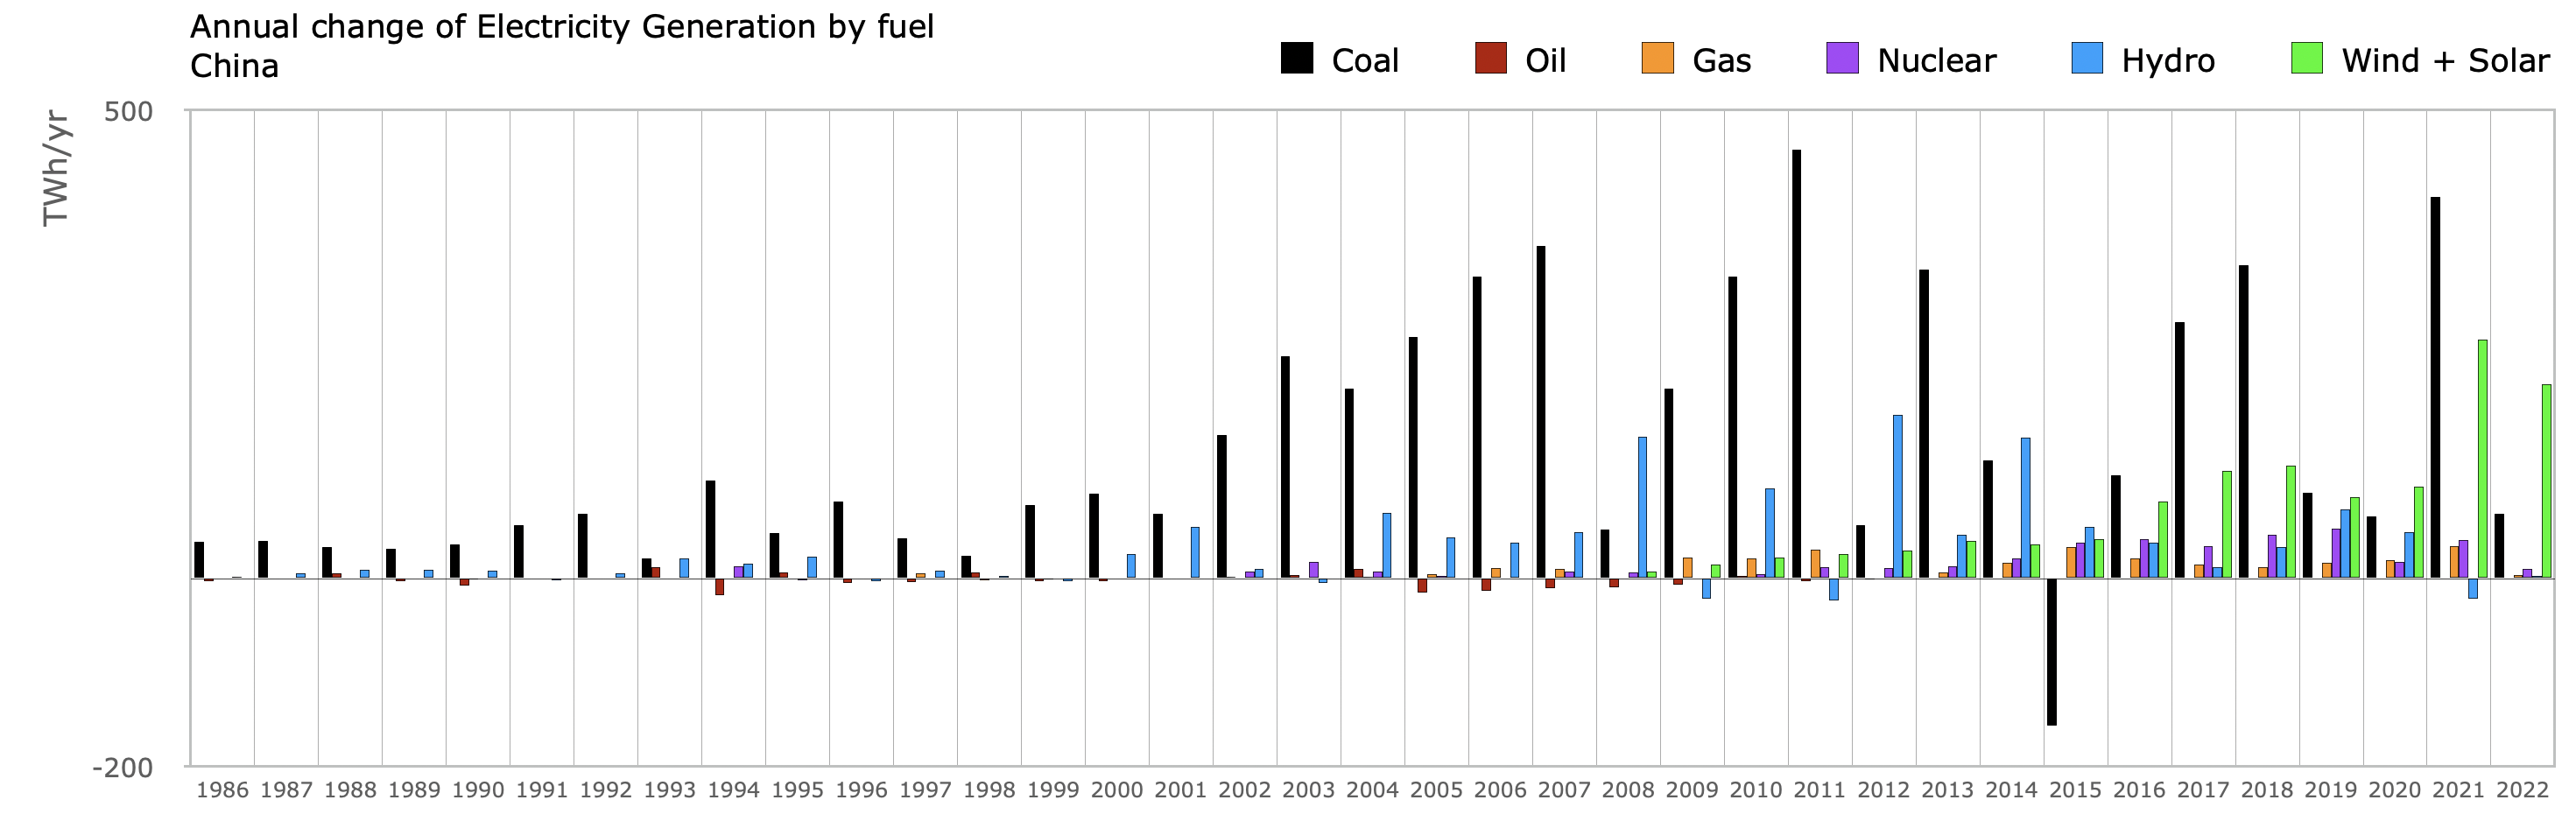
Electricity
By Share
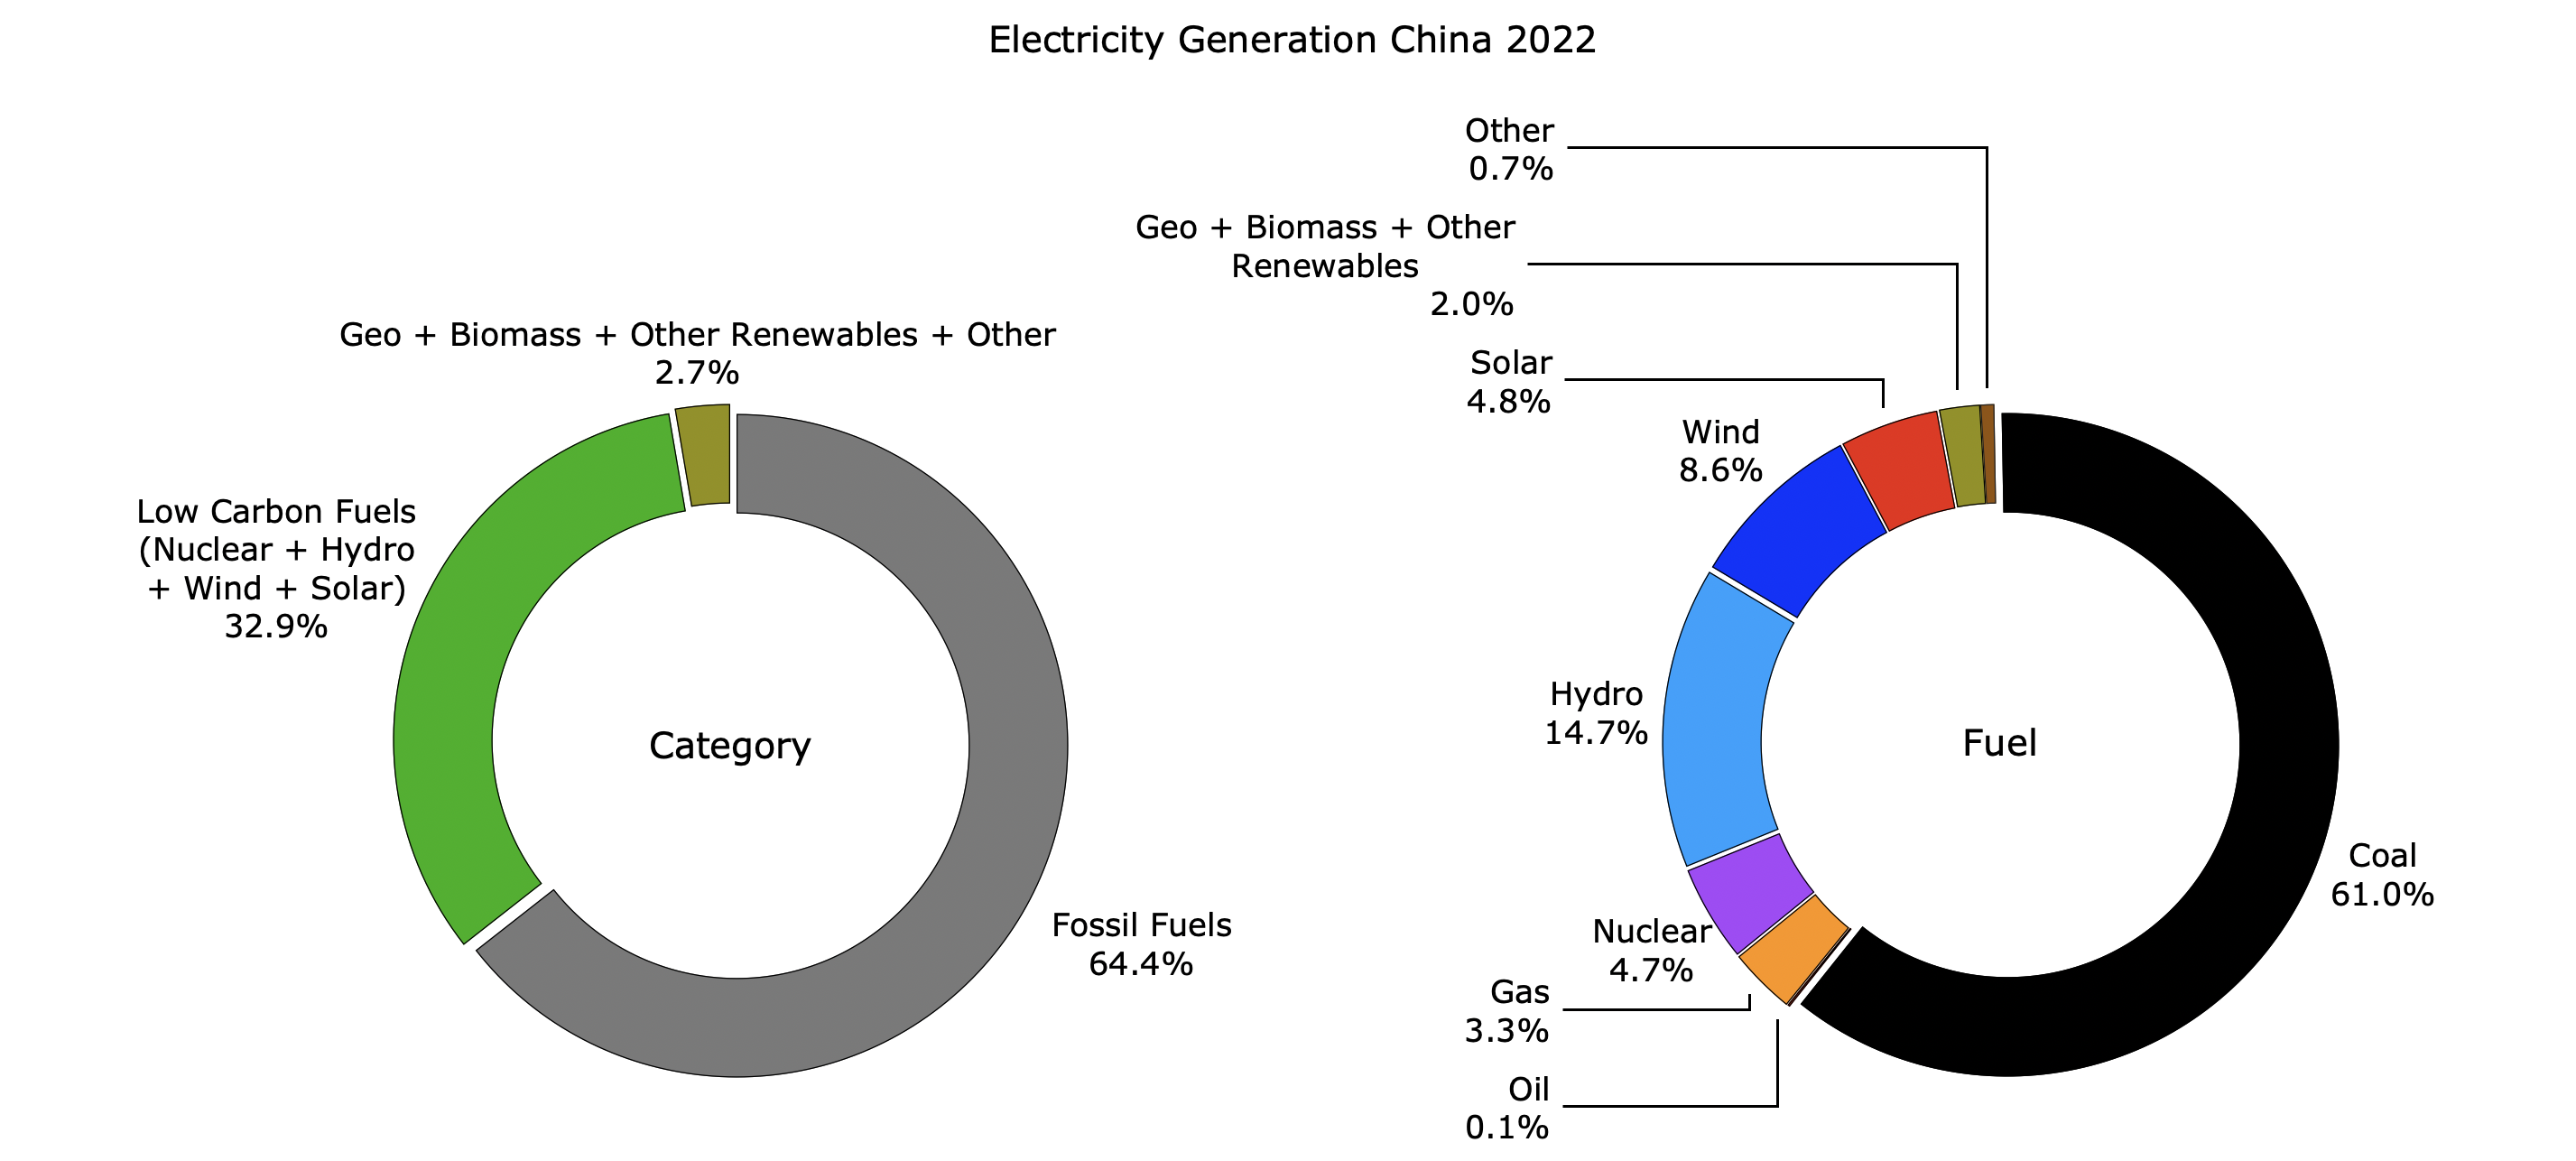
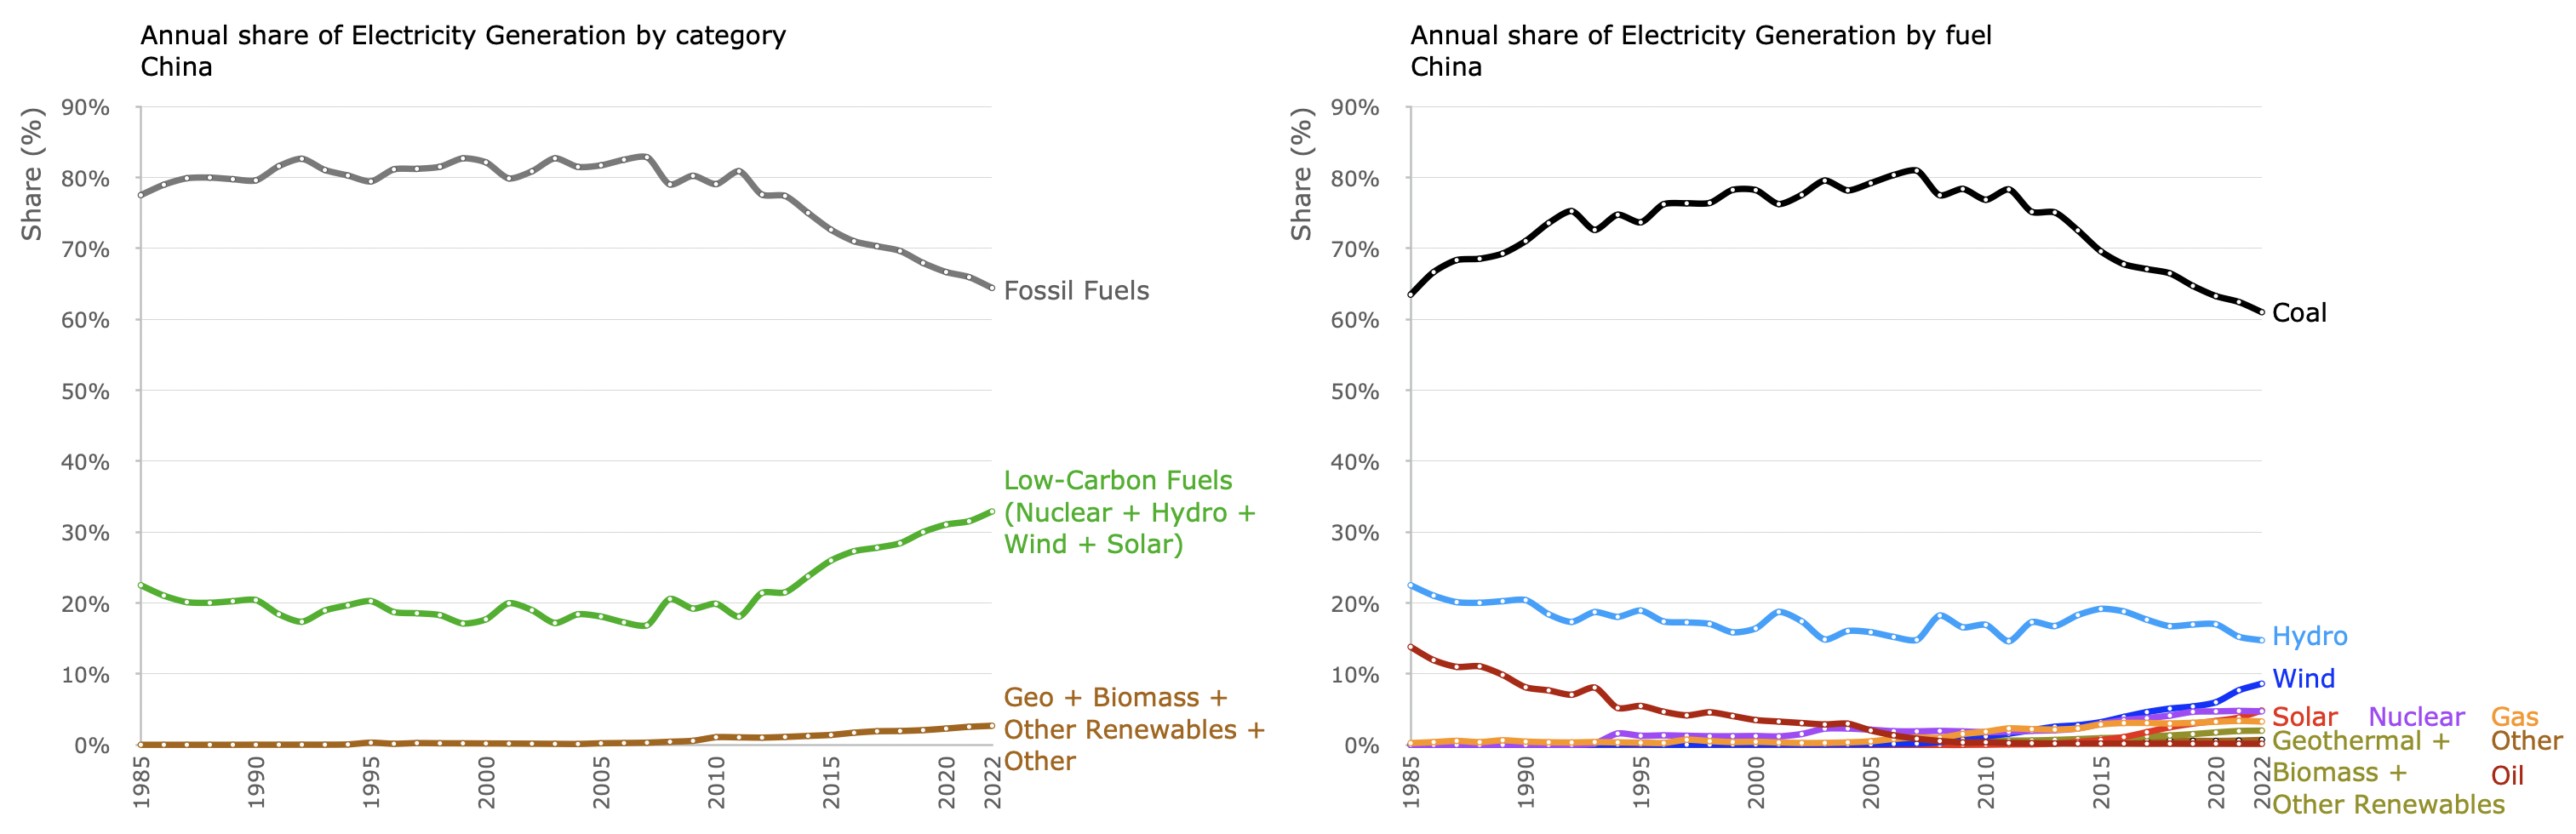
Absolute Quantities
- https://www.energyinst.org/statistical-review/about, 31% share in year 2022.[↩]
- https://www.worldenergydata.org/world-fossil-fuel-production-and-primary-energy/, 52% share in year 2022.[↩]
- https://www.worldenergydata.org/world-fossil-fuel-production-and-primary-energy/[↩]
- https://www.energyinst.org/statistical-review/about[↩][↩][↩][↩][↩][↩][↩][↩][↩][↩][↩][↩][↩][↩][↩]
- Sheets used from the data were: 1. ‘Coal Production – Tonnes’. 2. ‘Oil Production – Barrels’. Annual figure calculated. 3. ‘Gas Production – Bcm’.[↩]
- https://www.iea.org/data-and-statistics/data-tools/energy-statistics-data-browser?country=CHINAREG&energy=Balances&year=2021[↩]