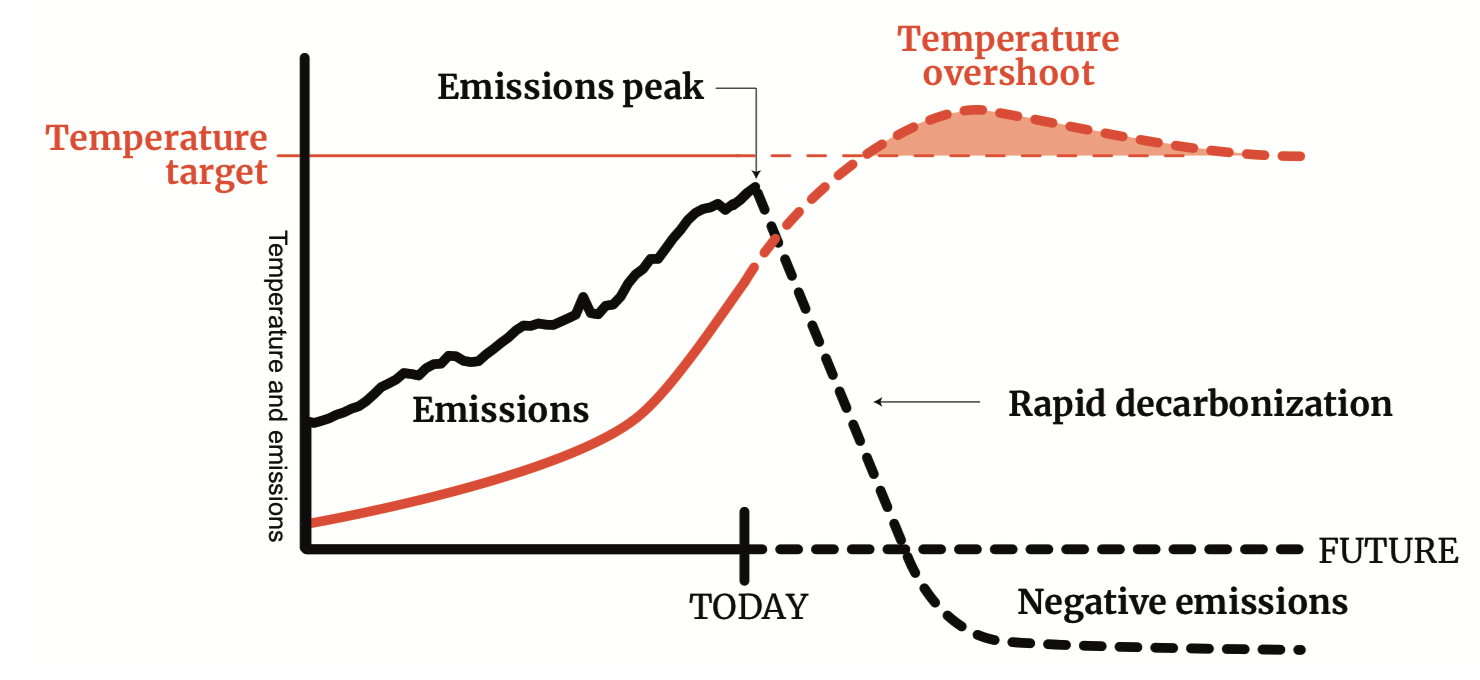
To hold global average temperature steady, emissions need to reach ‘net zero’. Net zero emissions are achieved when emissions of greenhouse gases to the atmosphere are balanced by anthropogenic removals.
An increase in global average temperature of e.g. 1.5°C corresponds to a limited net amount of CO2 being emitted. This amount of CO2 is usually referred to as the carbon budget for 1.5°C.
The rate at which CO2 will be emitted determines how many years remain until emissions must reach ‘net-zero’.
Limiting warming to 1.5°C or 2°C without overspending the corresponding carbon budget would require very fast changes in electricity production, transport, construction, agriculture and industry.
IPCC. 2018. Understanding the IPCC Special Report on 1.5°C.1
Net zero emissions requires both rapid emission reductions (also known as decarbonisation), AND anthropogenic removals (also known as “negative emission technologies” (NETs) or “carbon dioxide removal” (CDR)). Both are now required because: (i) civilisation has left the task of decarbonisation recklessly late; (ii) there is a limit to the maximum rate of decarbonisation that civilisation can manage; and (iii) there is a limit to the minimum level of annual emissions that civilisation can manage (also known as a “carbon-floor”, that must be perpetually offset).
A typical future idealistic future CO2 emission scenario is shown below.
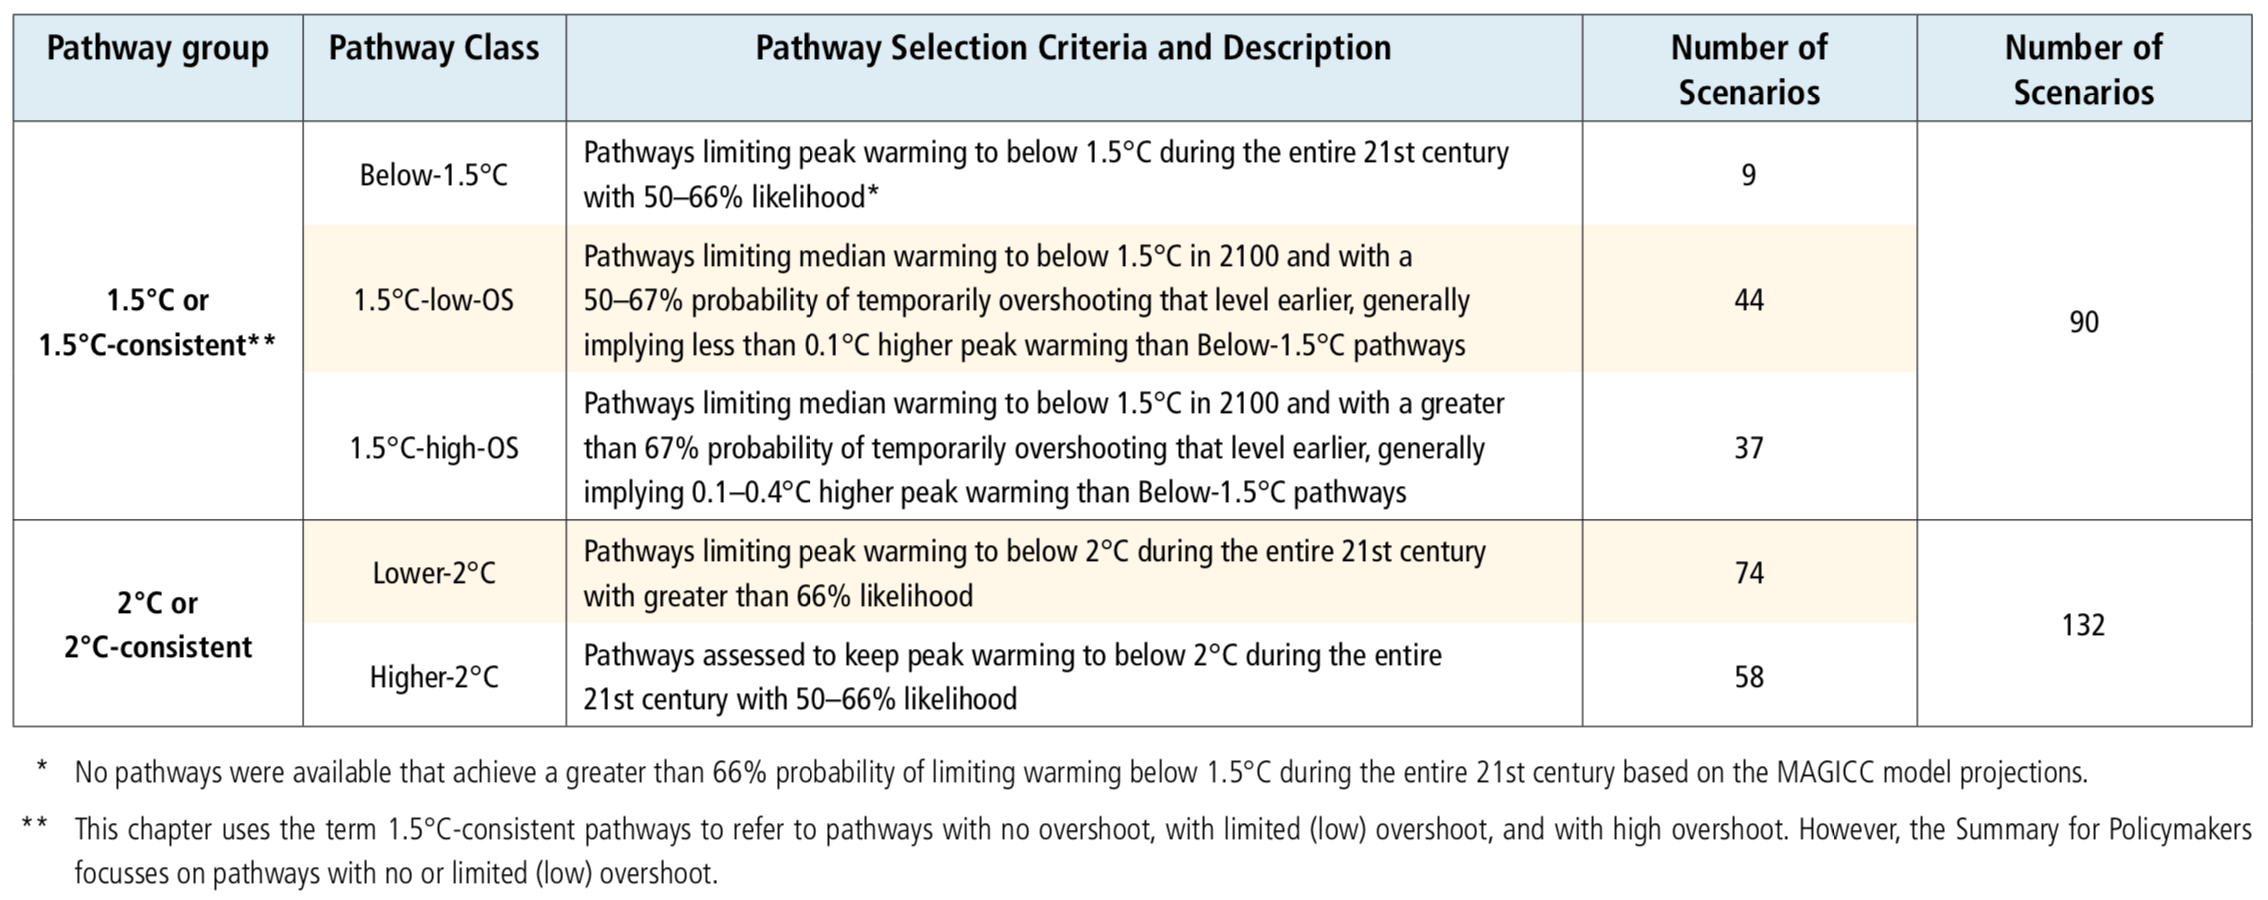
The IPCC’s Special Report on 1.5°C presents the six future emission categories (or pathway groups) shown below (note the worryingly small probabilities of success associated with each).
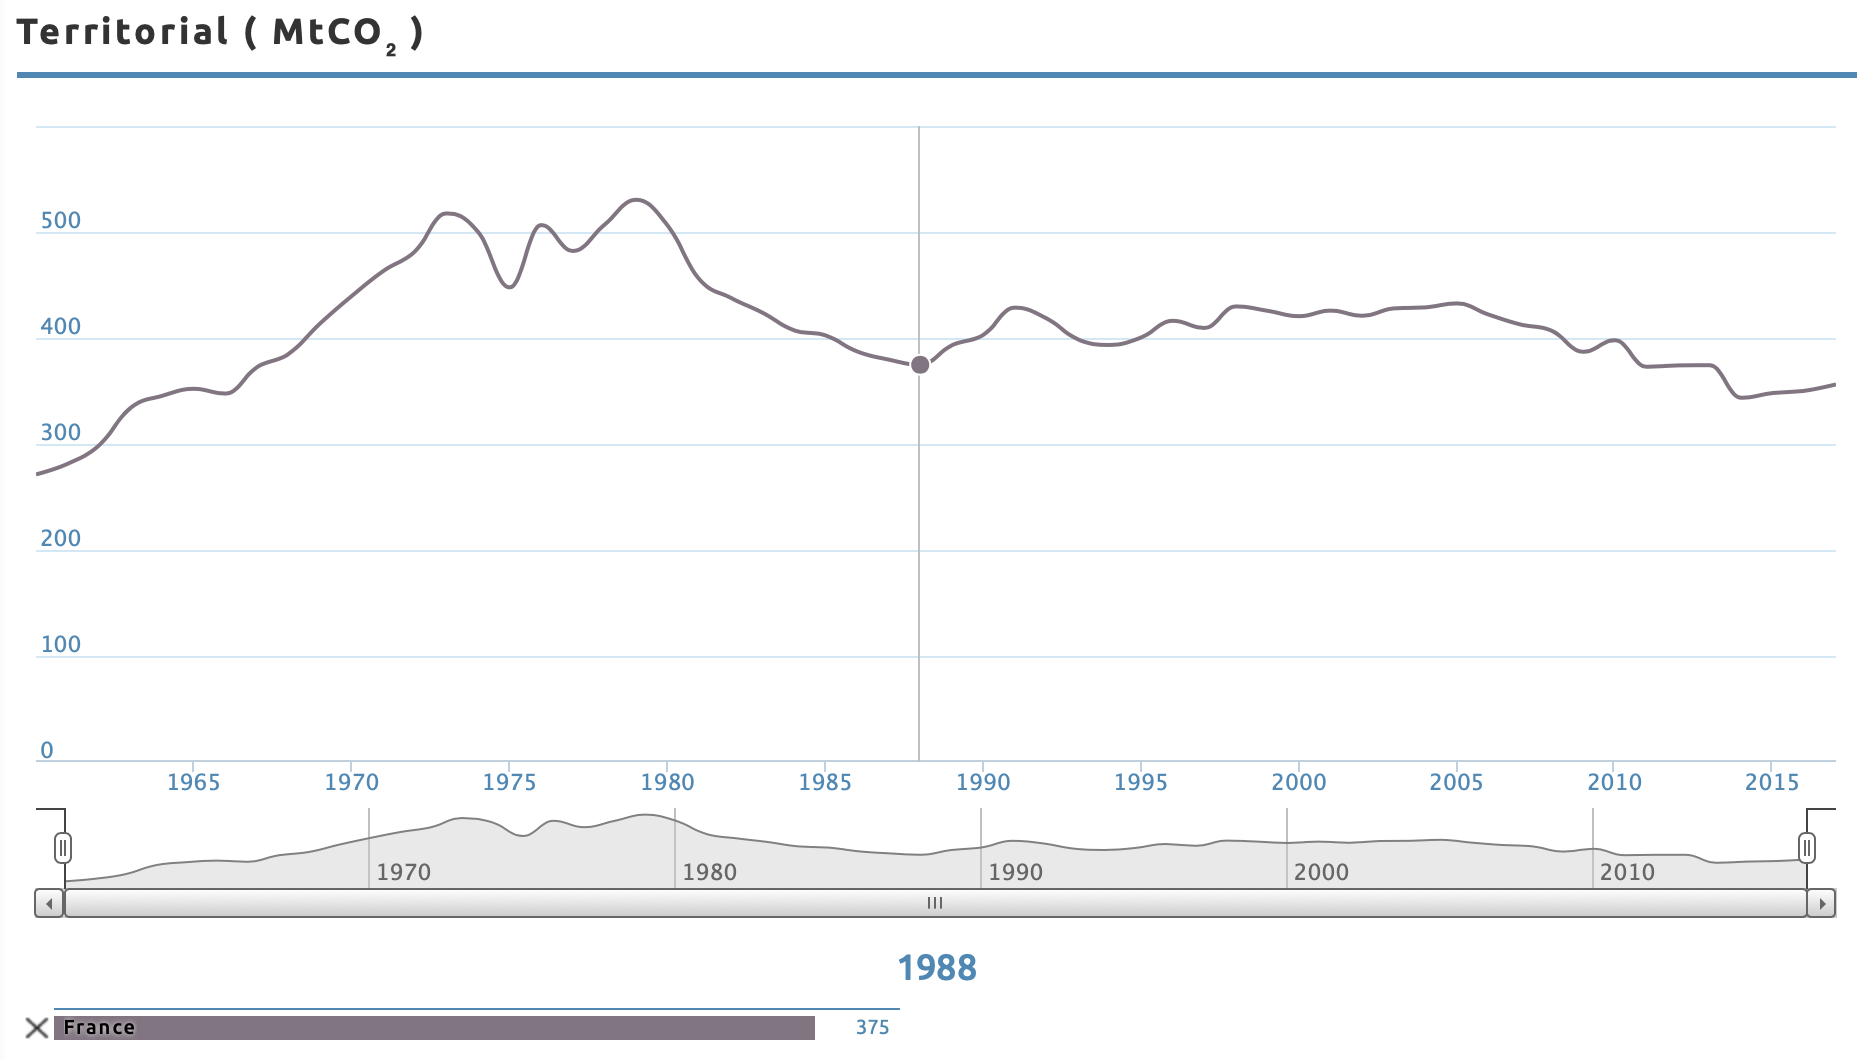
For each of the pathways above, there are corresponding prescribed future rates of decarbonisation and associated increasing CDR. Placing CDR aside for the moment, it’s useful to consider historic examples of decarbonisation. There have been three notable examples: France and Sweden in the 1980s due to an increased supply of nuclear energy, and Russia in the 1990s after the collapse of the Soviet Union.
As shown below, the decarbonisation in France occurred between 1979 and 1988, and at a rate equivalent to a linear decline of -3.25%/yr of the initial level of emissions in 1979. Sweden managed -5.6%/yr3 and Russia endured -5.9%.
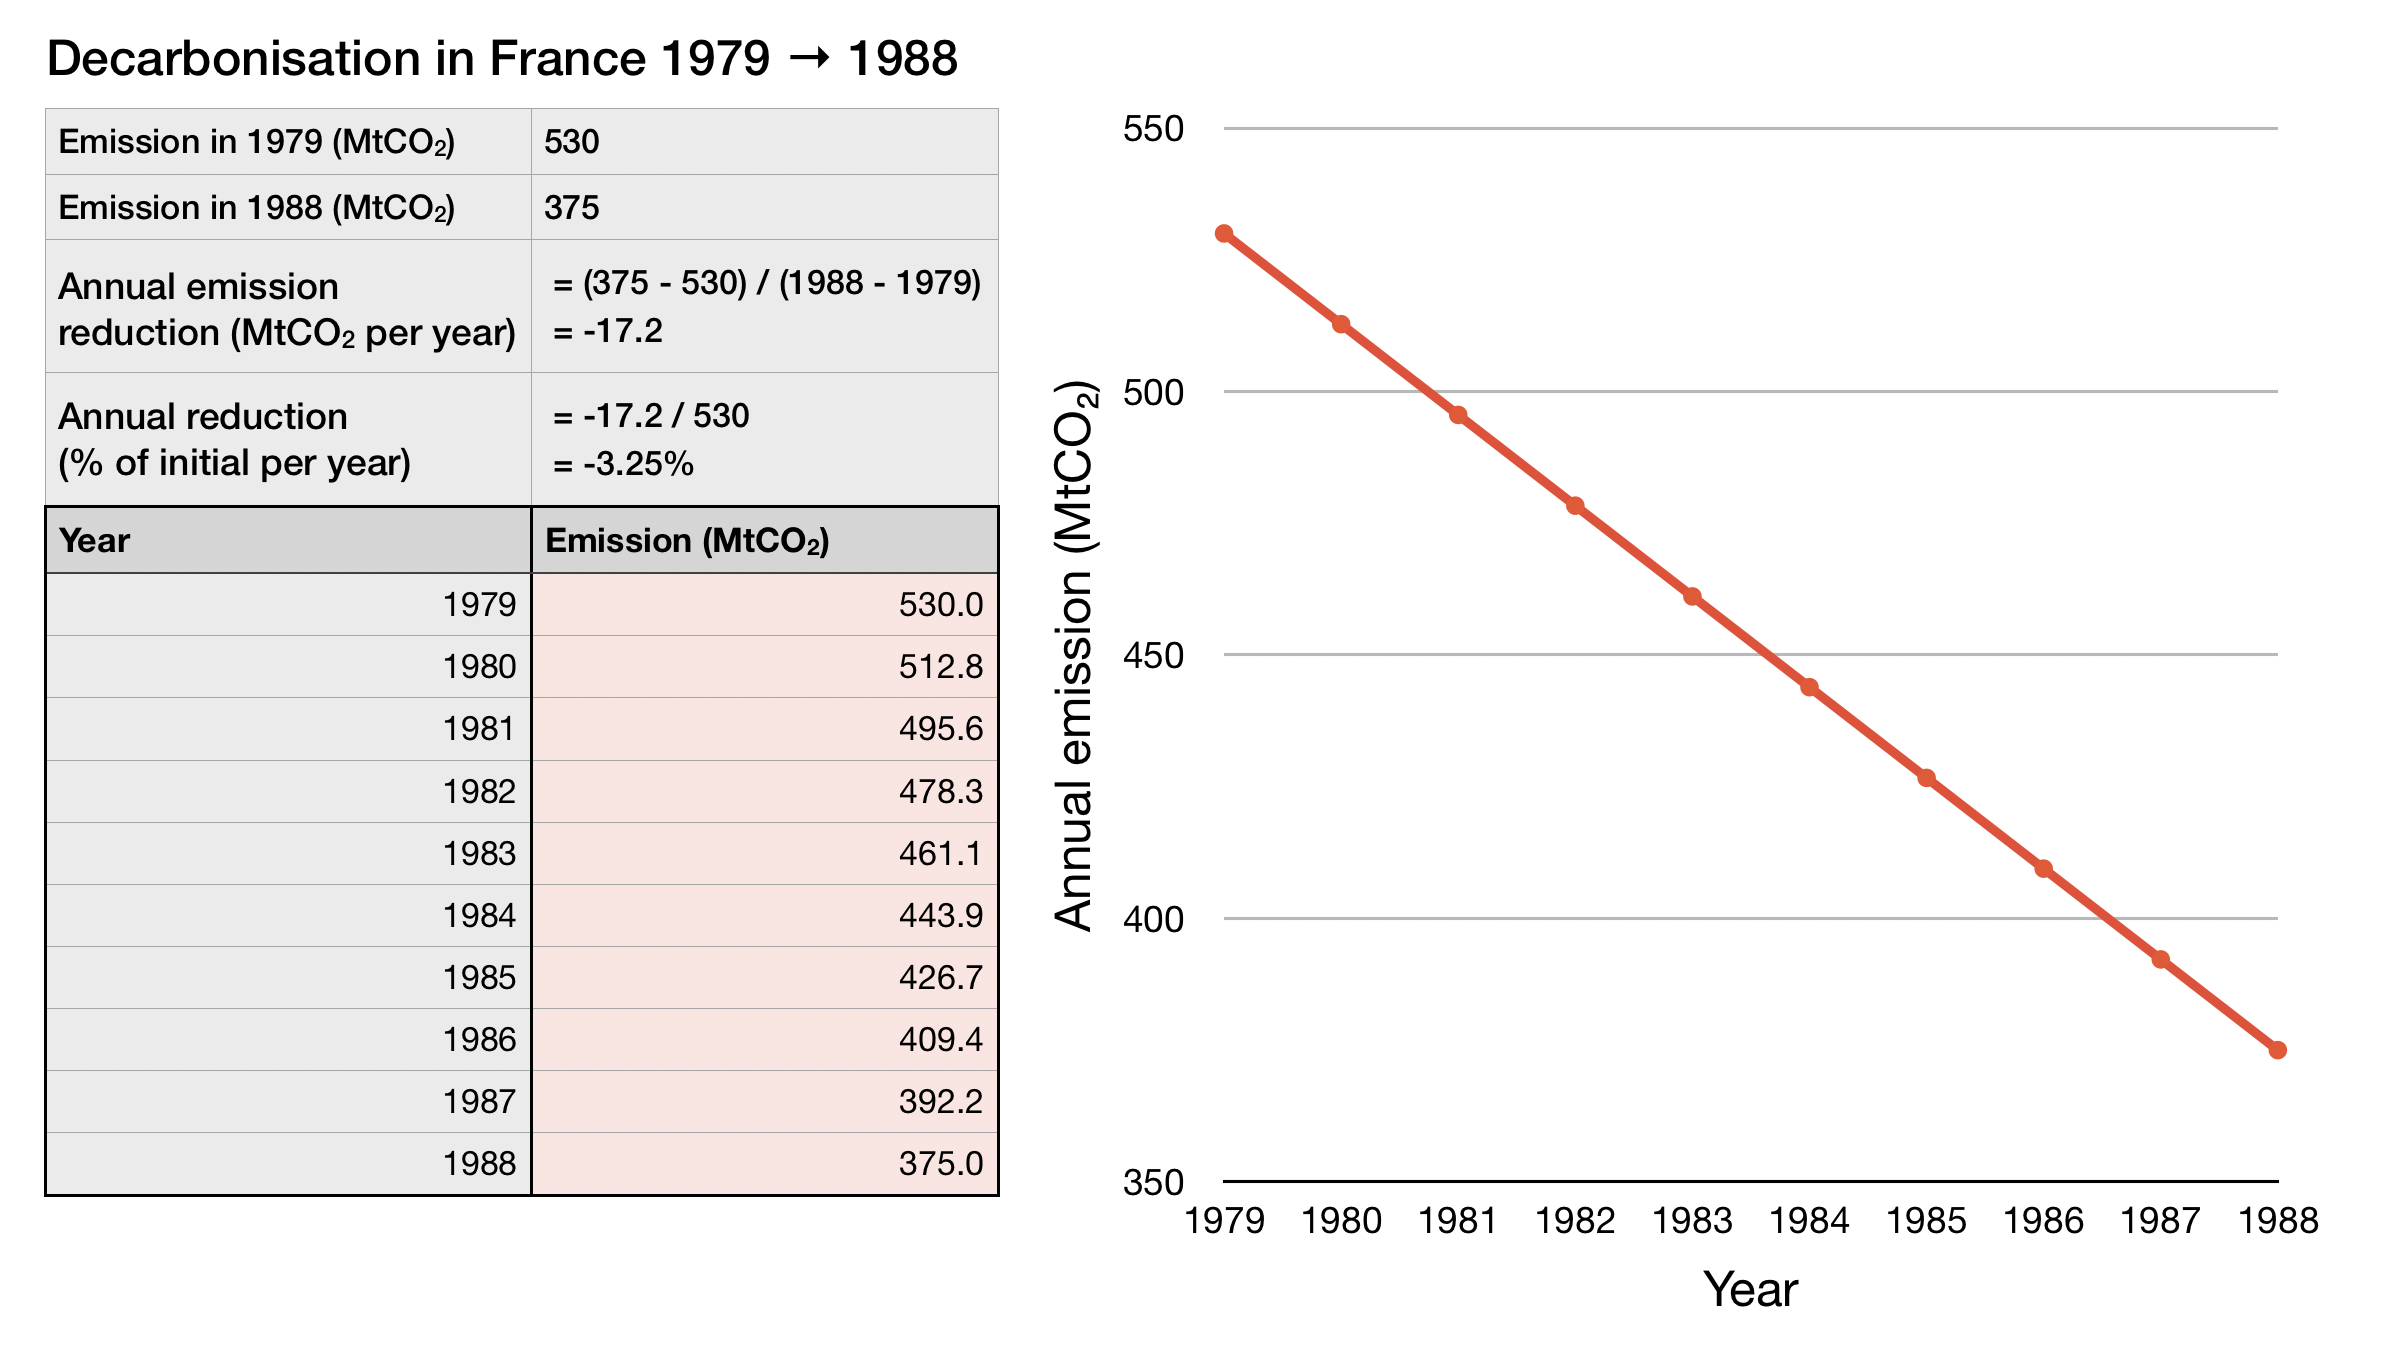
Prescribed decarbonisation rates for the next decade can be calculated using the table below and compared to the historic reductions above.
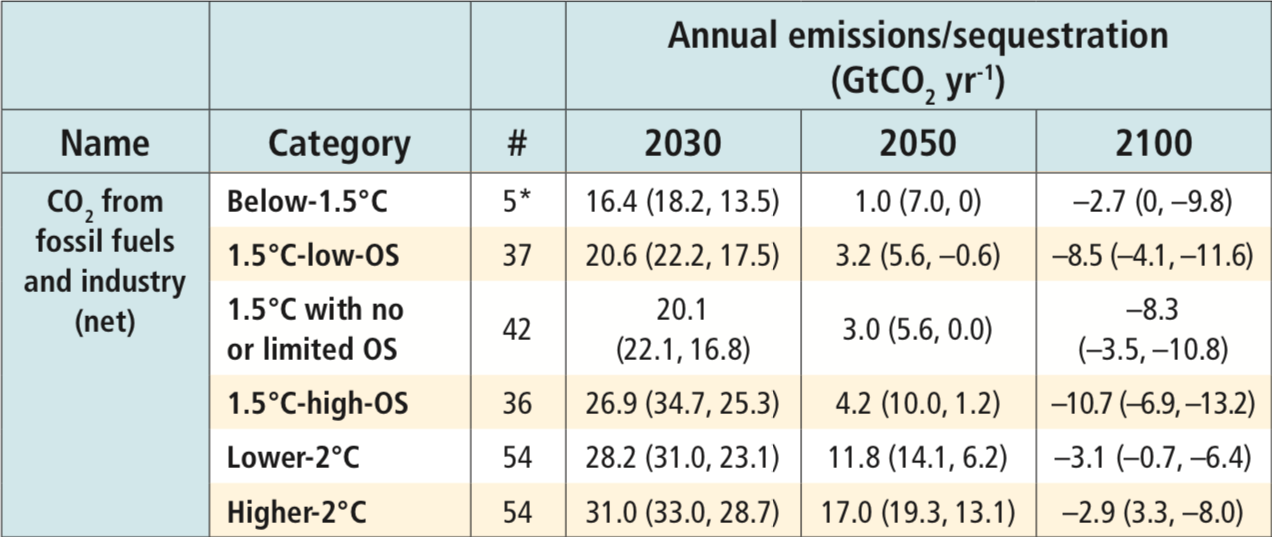
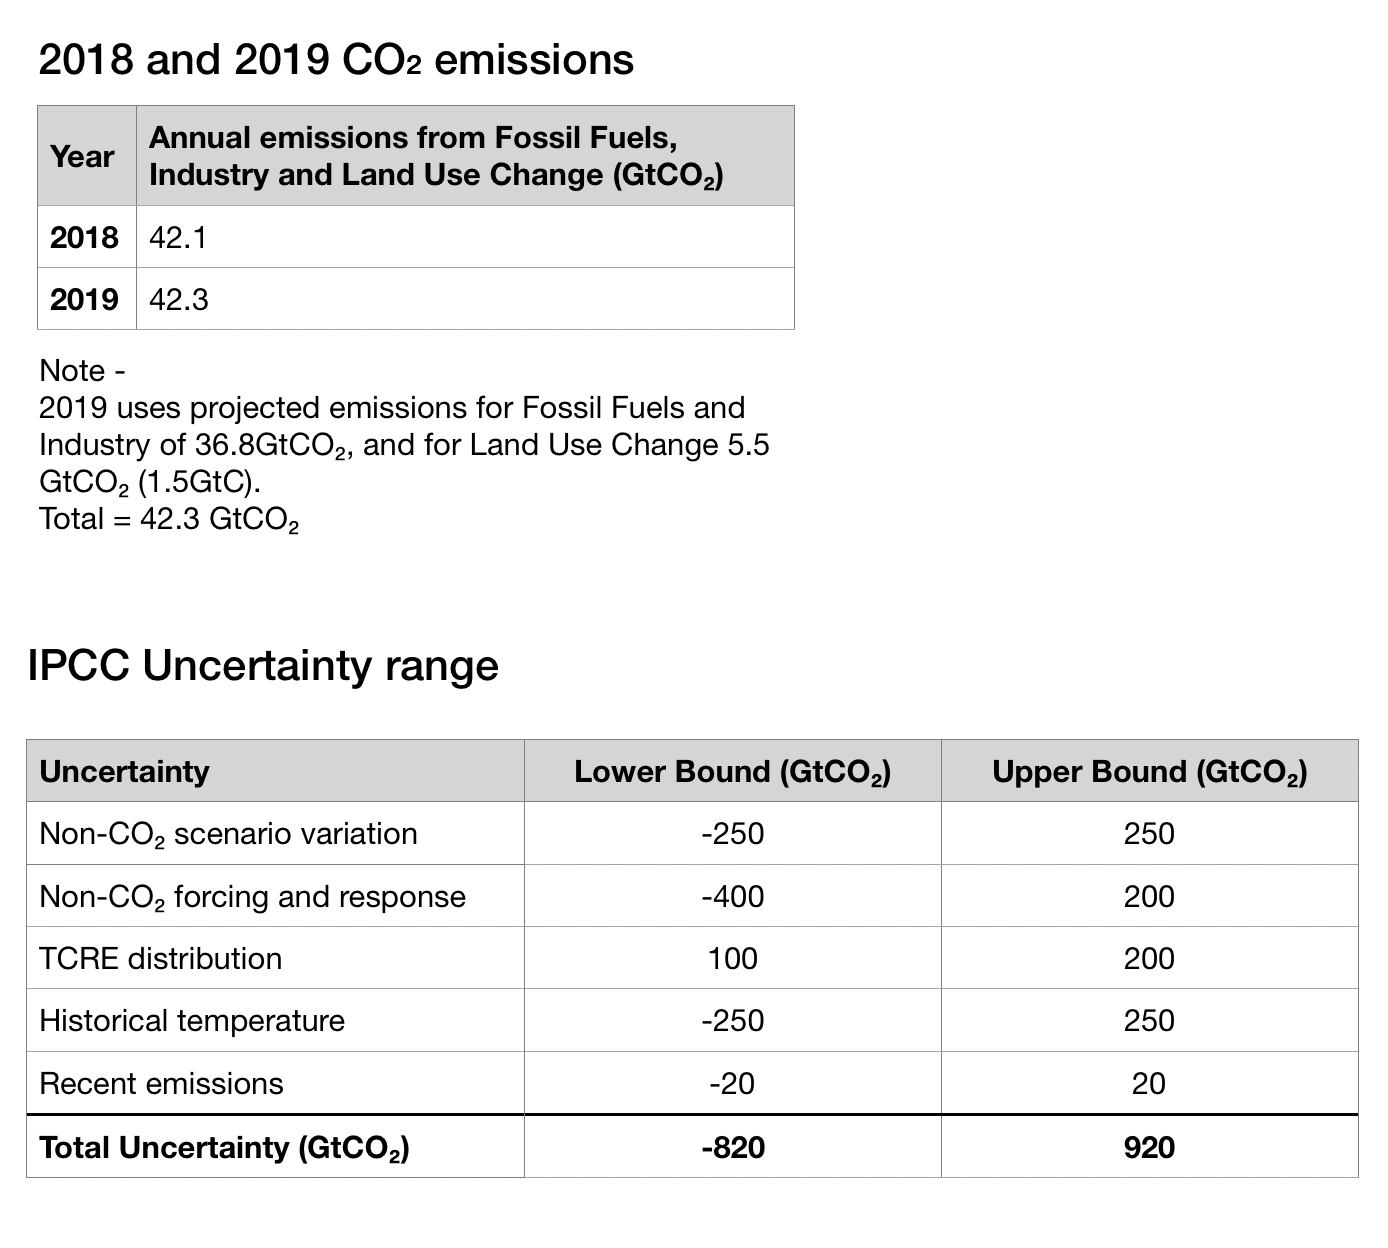
The level of CO2 from fossil fuels and industry (net) in 2019 was 36.8GtCO2.6 Under the assumption that the prescribed decarbonisation for the future pathway 1.5°C-with-low-overshoot begins in 2021, and that emissions in 2020 equal those in 2019, then CO2 emissions from fossil fuels and industry would need to decline from 36.8GtCO2 to 20.6GtCO2 in a decade (refer to the table above). This is equivalent to an annual linear decline of -4.4% of the original amount each year, as calculated below.
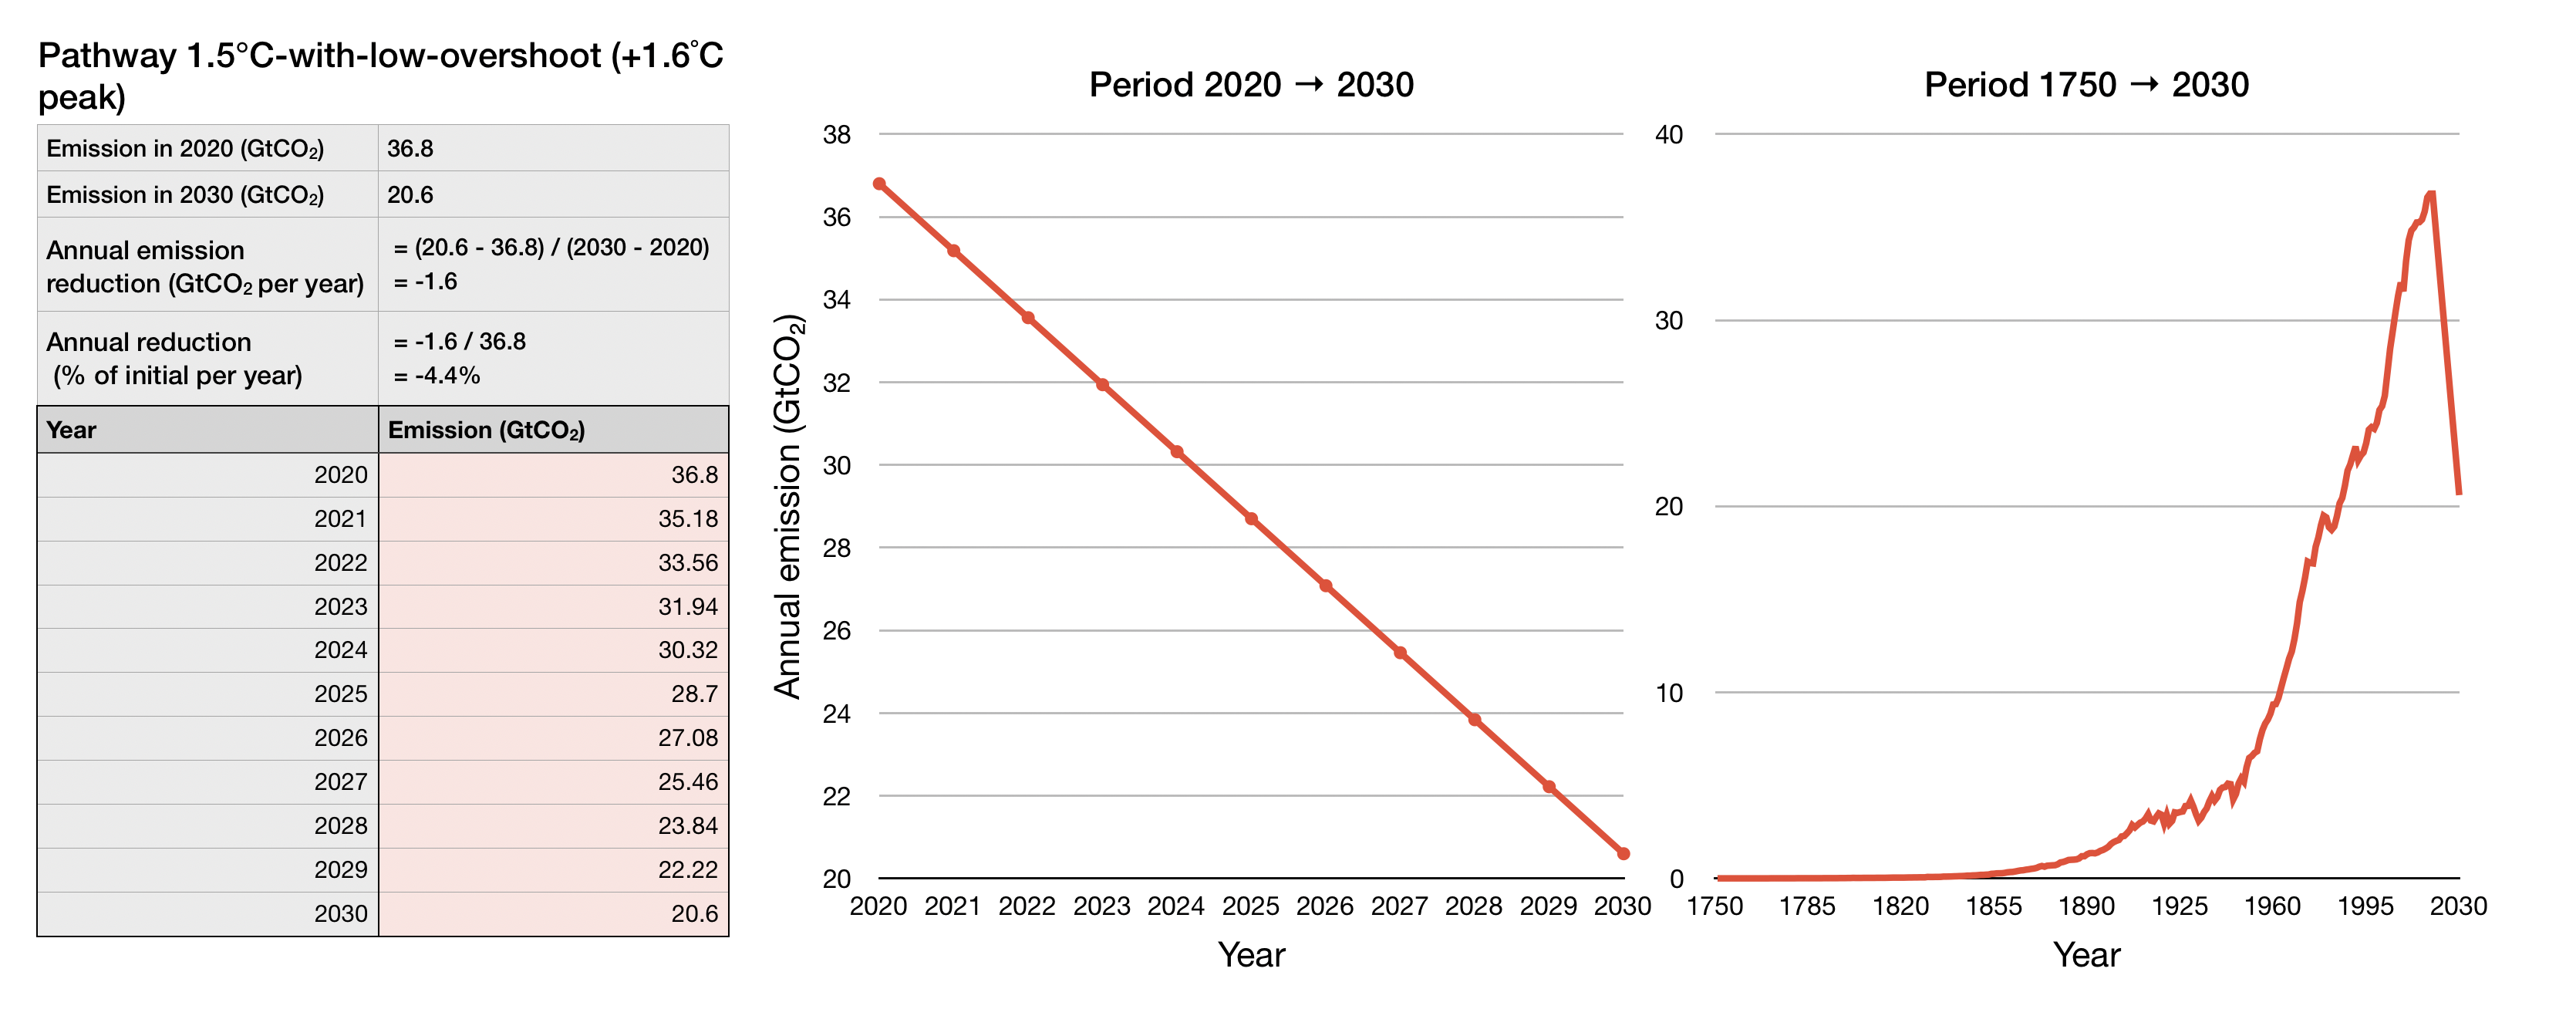
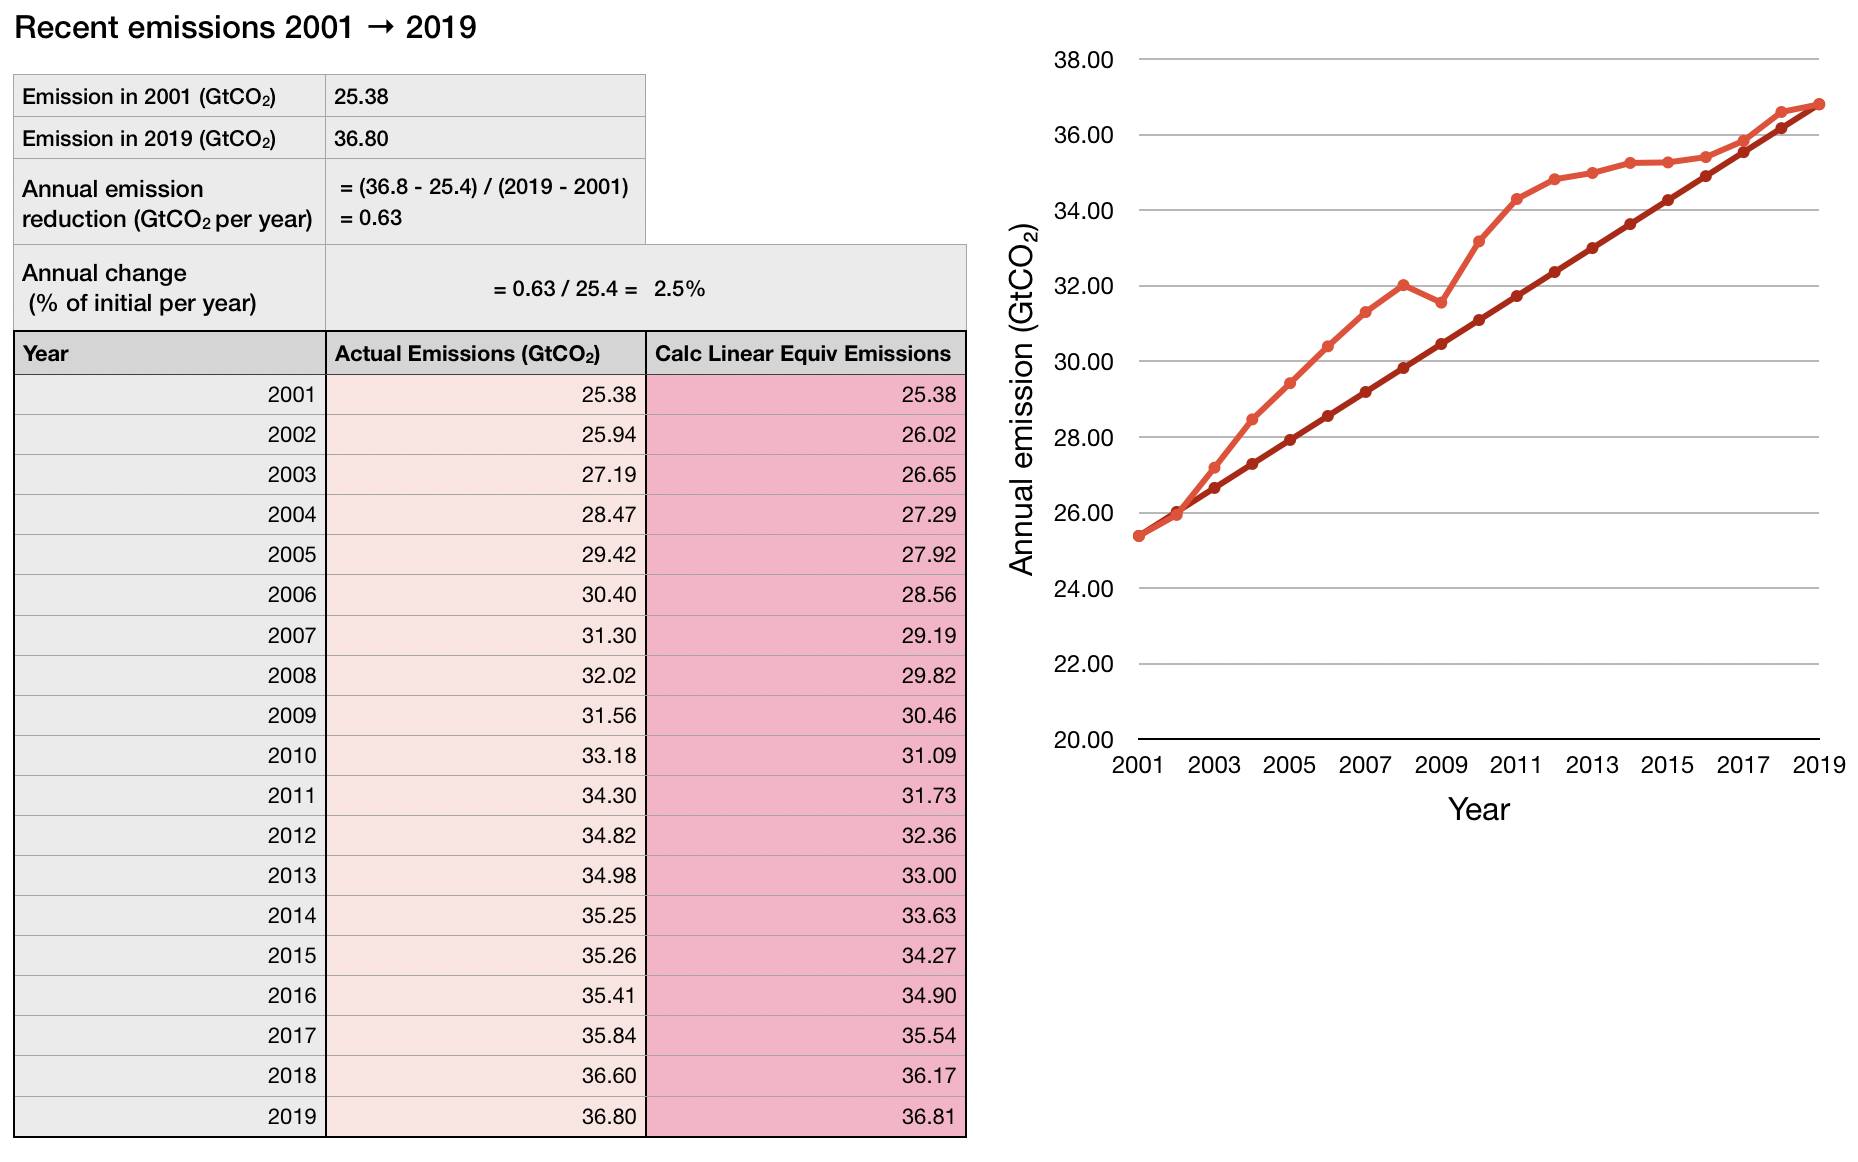
While this rate of decarbonisation is similar to that which occurred in France, Sweden and Russia, the scale of these examples should be considered: During their respective decarbonisation, France was responsible for 2.1% of global CO2 emissions,8 Sweden 0.4%9 and Russia 9%.10 The decarbonisation that occurred in Russia is the only example that was significant at rate and scale, but this caused hardship, riots, massacres and even a decline in the life expectancy of males from 65 down to 58 years.11 A global decarbonisation at any rate for a decade is without historic precedent. Alternatively, the pathway 1.5°C-with-high-overshoot, that has a median warming of +1.7˚C and a 20% chance of exceeding +2°C12 demands a global decarbonisation rate to 2030 of -2.7%/yr. This rate would need to be enacted in 2021, despite civilisation having carbonised at about this rate since year 2000, as shown below, effectively somehow being an emissions-backflip.12
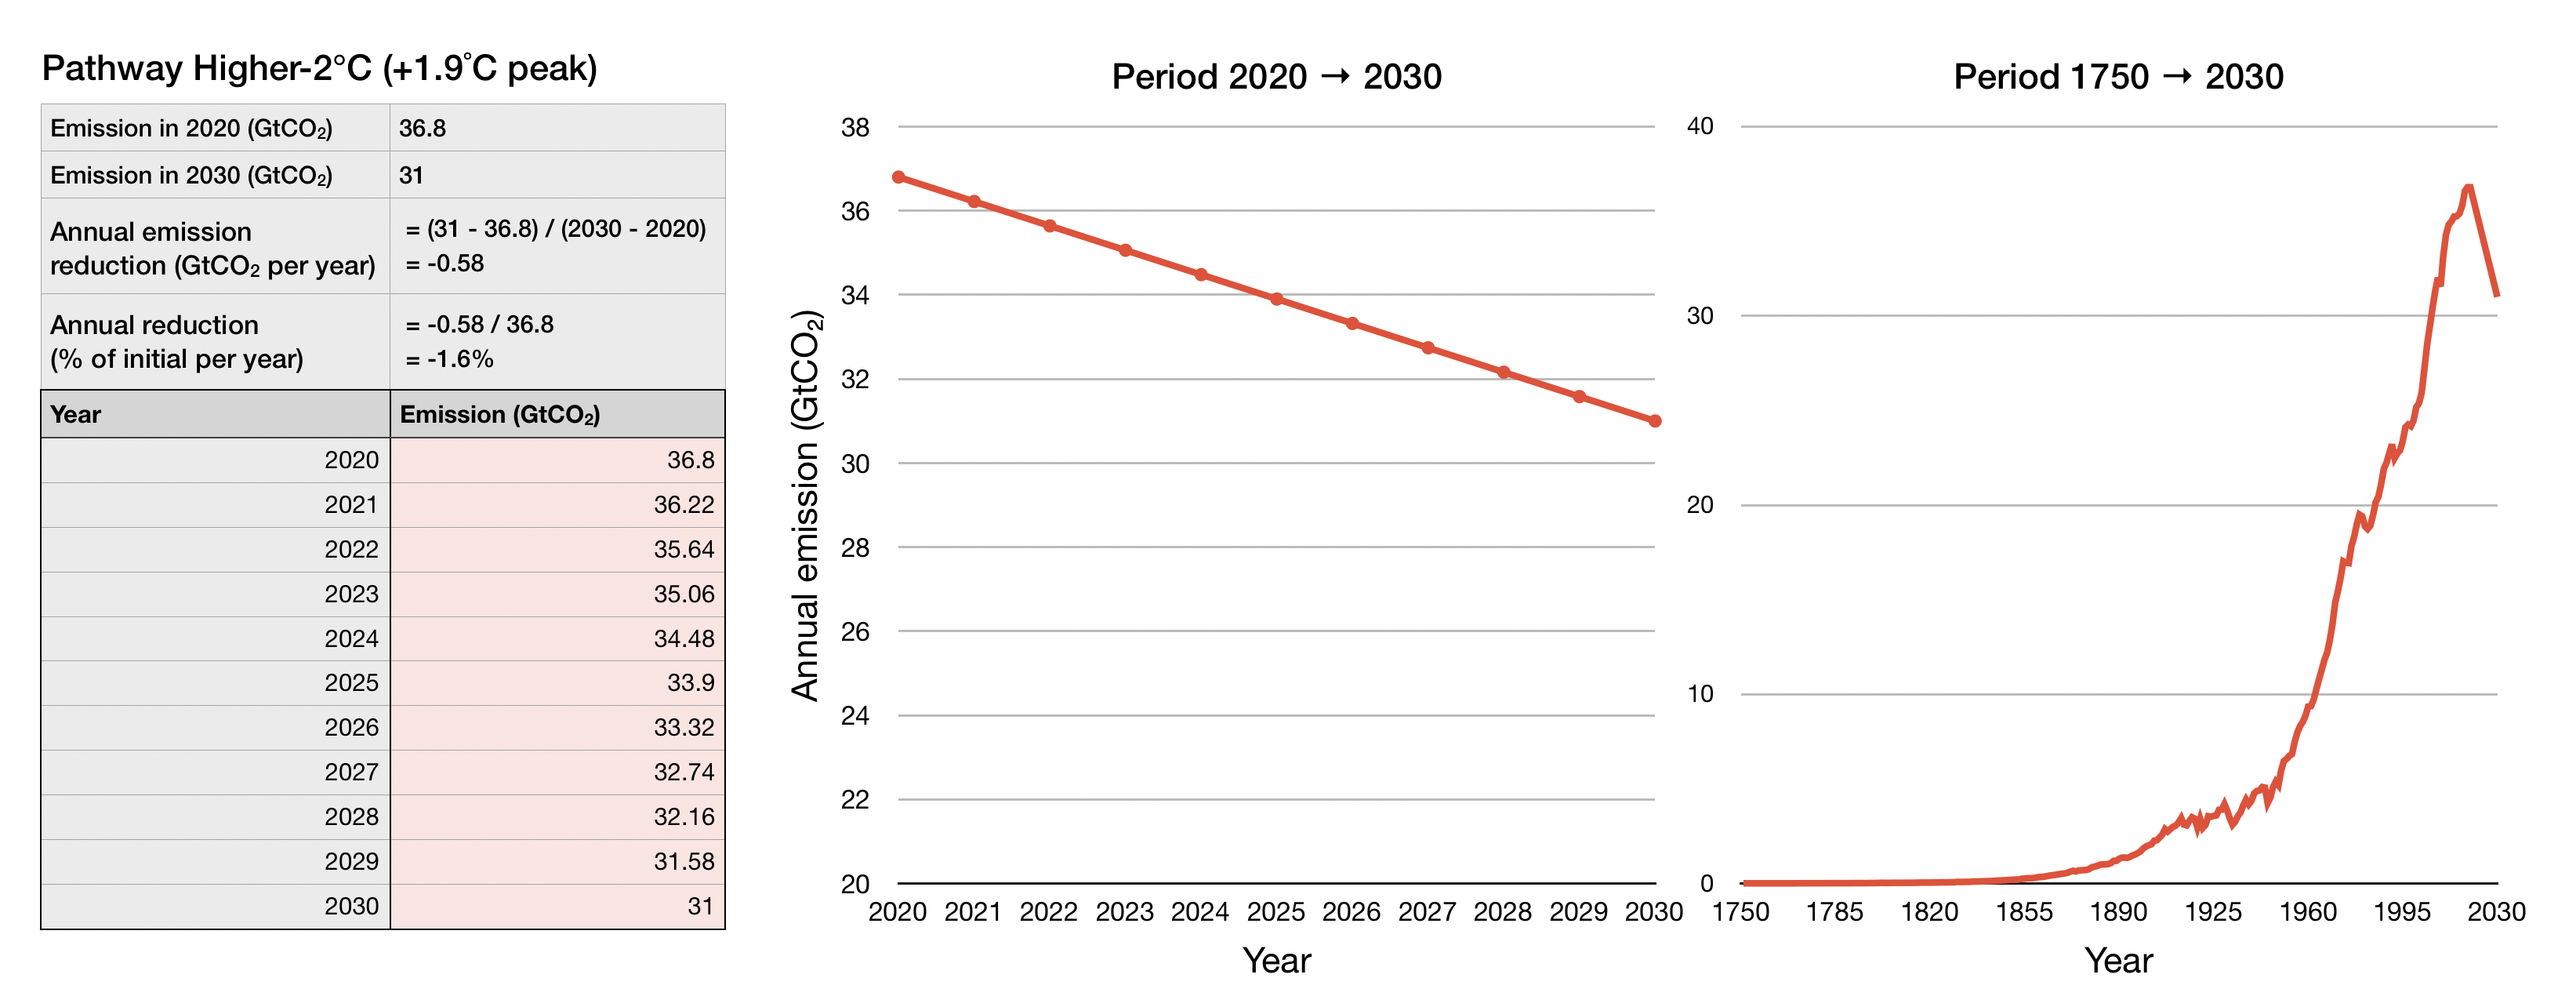
Even the pathway Higher-2°C, that has 40% chance of exceeding 2°C, and a 13% chance of exceeding 2.5°C as early as 207512 requires immediate decarbonisation at a rate of -1.6%/yr.
Therefore even the rapid and drastic decarbonisation shown in Chart 5 above, along with the prescribed concurrent CDR detailed further below, leaves us with a 40% chance of warming the planet to a temperature that hasn’t occurred for around 3–5 million years.13
In the mid-Pliocene, 3–5 million years ago, the last time that the Earth’s atmosphere contained 400ppm of CO2, global mean surface temperature was 2–3℃ warmer than today, the Greenland and West Antarctic ice sheets melted and even some of the East Antarctic ice was lost, leading to sea levels that were 10–20m higher than they are today.
WMO, 2017, State of the Global Climate in 2017.14
Decarbonisation is only “half the story”. Pathways to limit warming become more challenging once the prescribed scale and rate of concurrent carbon dioxide removal (CDR) is considered.
All analysed pathways limiting warming to 1.5°C with no or limited overshoot use CDR to some extent to neutralize emissions from sources for which no mitigation measures have been identified and, in most cases, also to achieve net negative emissions to return global warming to 1.5°C following a peak (high confidence). The longer the delay in reducing CO2 emissions towards zero, the larger the likelihood of exceeding 1.5°C, and the heavier the implied reliance on net negative emissions after mid-century to return warming to 1.5°C (high confidence).
IPCC Special Report on 1.5°C.15
The CDR required for pathways Below-1.5°C and 1.5°C-with-low-overshoot is shown in Chart 6; (a) shows the annual quantity of CDR to be removed each year, and (b) the cumulative quantity over time.
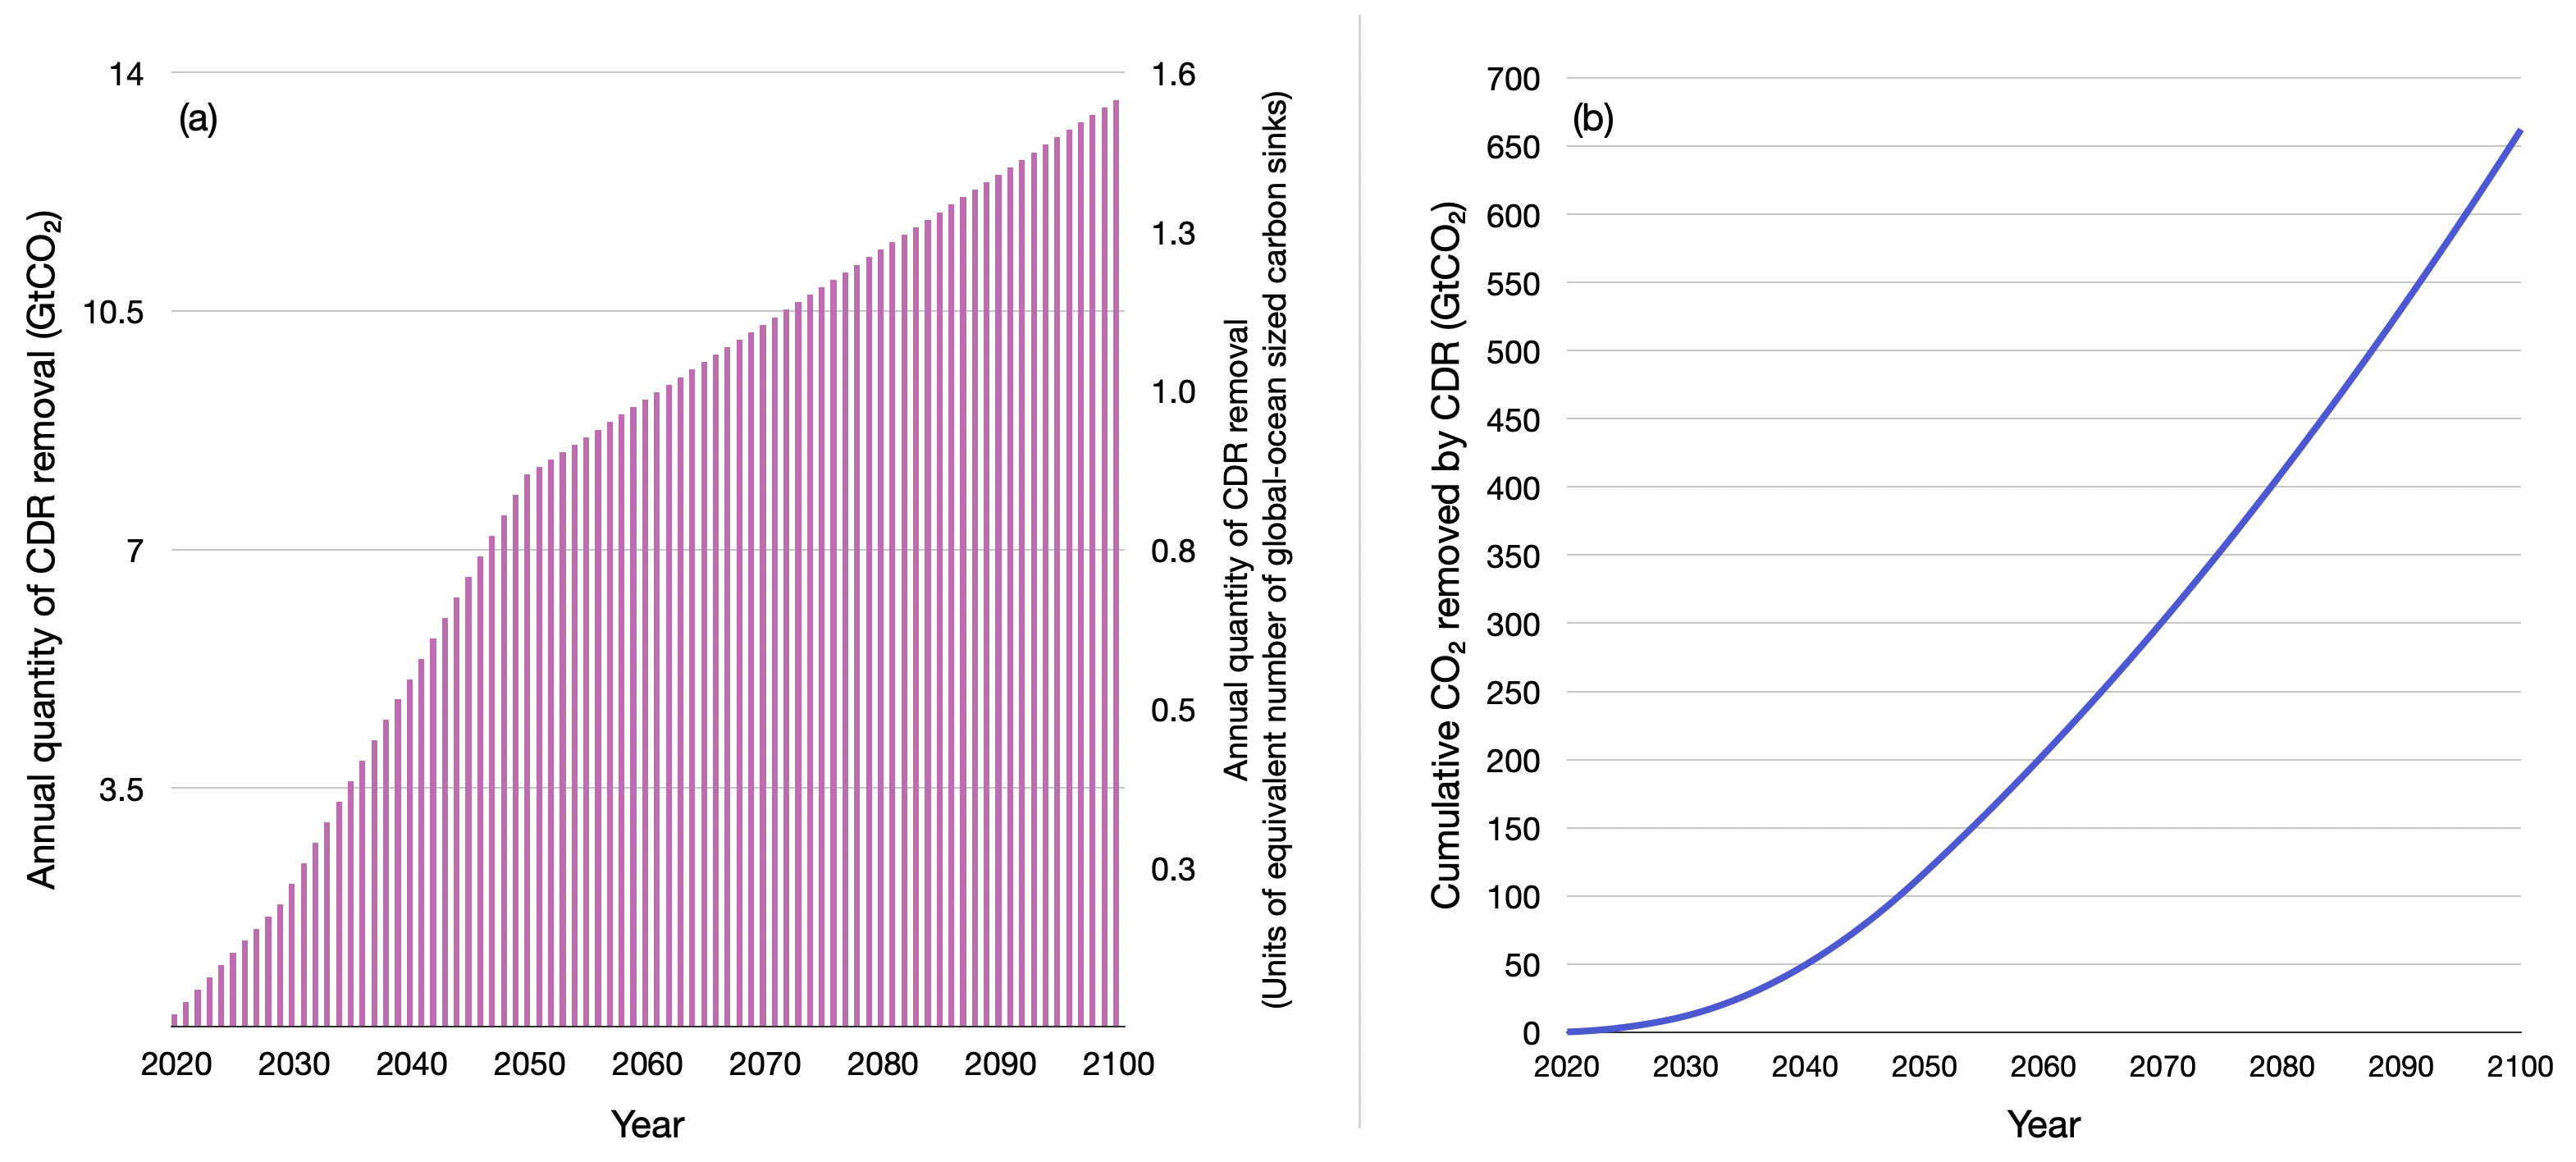
640–950 GtCO2 removal is required for a likely chance of limiting end-of-century warming to 1.5 °C. In the absence of strengthened pre-2030 pledges, long-term CO2 commitments are increased by 160–330 GtCO2, further jeopardizing achievement of the 1.5 °C goal and increasing dependence on CO2 removal.
Residual fossil CO2 emissions in 1.5–2 °C pathways.17
The scale of the decarbonisation challenge to meet the Paris Agreement is underplayed in the public arena. It will require precipitous emissions reductions within 40 years and a new carbon sink on the scale of the ocean sink. Even then, the world is extremely likely to overshoot. A catastrophic failure of policy, for example, waiting another decade for transformative policy and full commitments to fossil-free economies, will have irreversible and deleterious repercussions for humanity’s remaining time on Earth. Only a global zero carbon roadmap will put the world on a course to phase-out greenhouse gas emissions and create the essential carbon sinks for Earth-system stability, without which, world prosperity is not possible.
Rockström, J. et al. (2016), The world’s biggest gamble.18
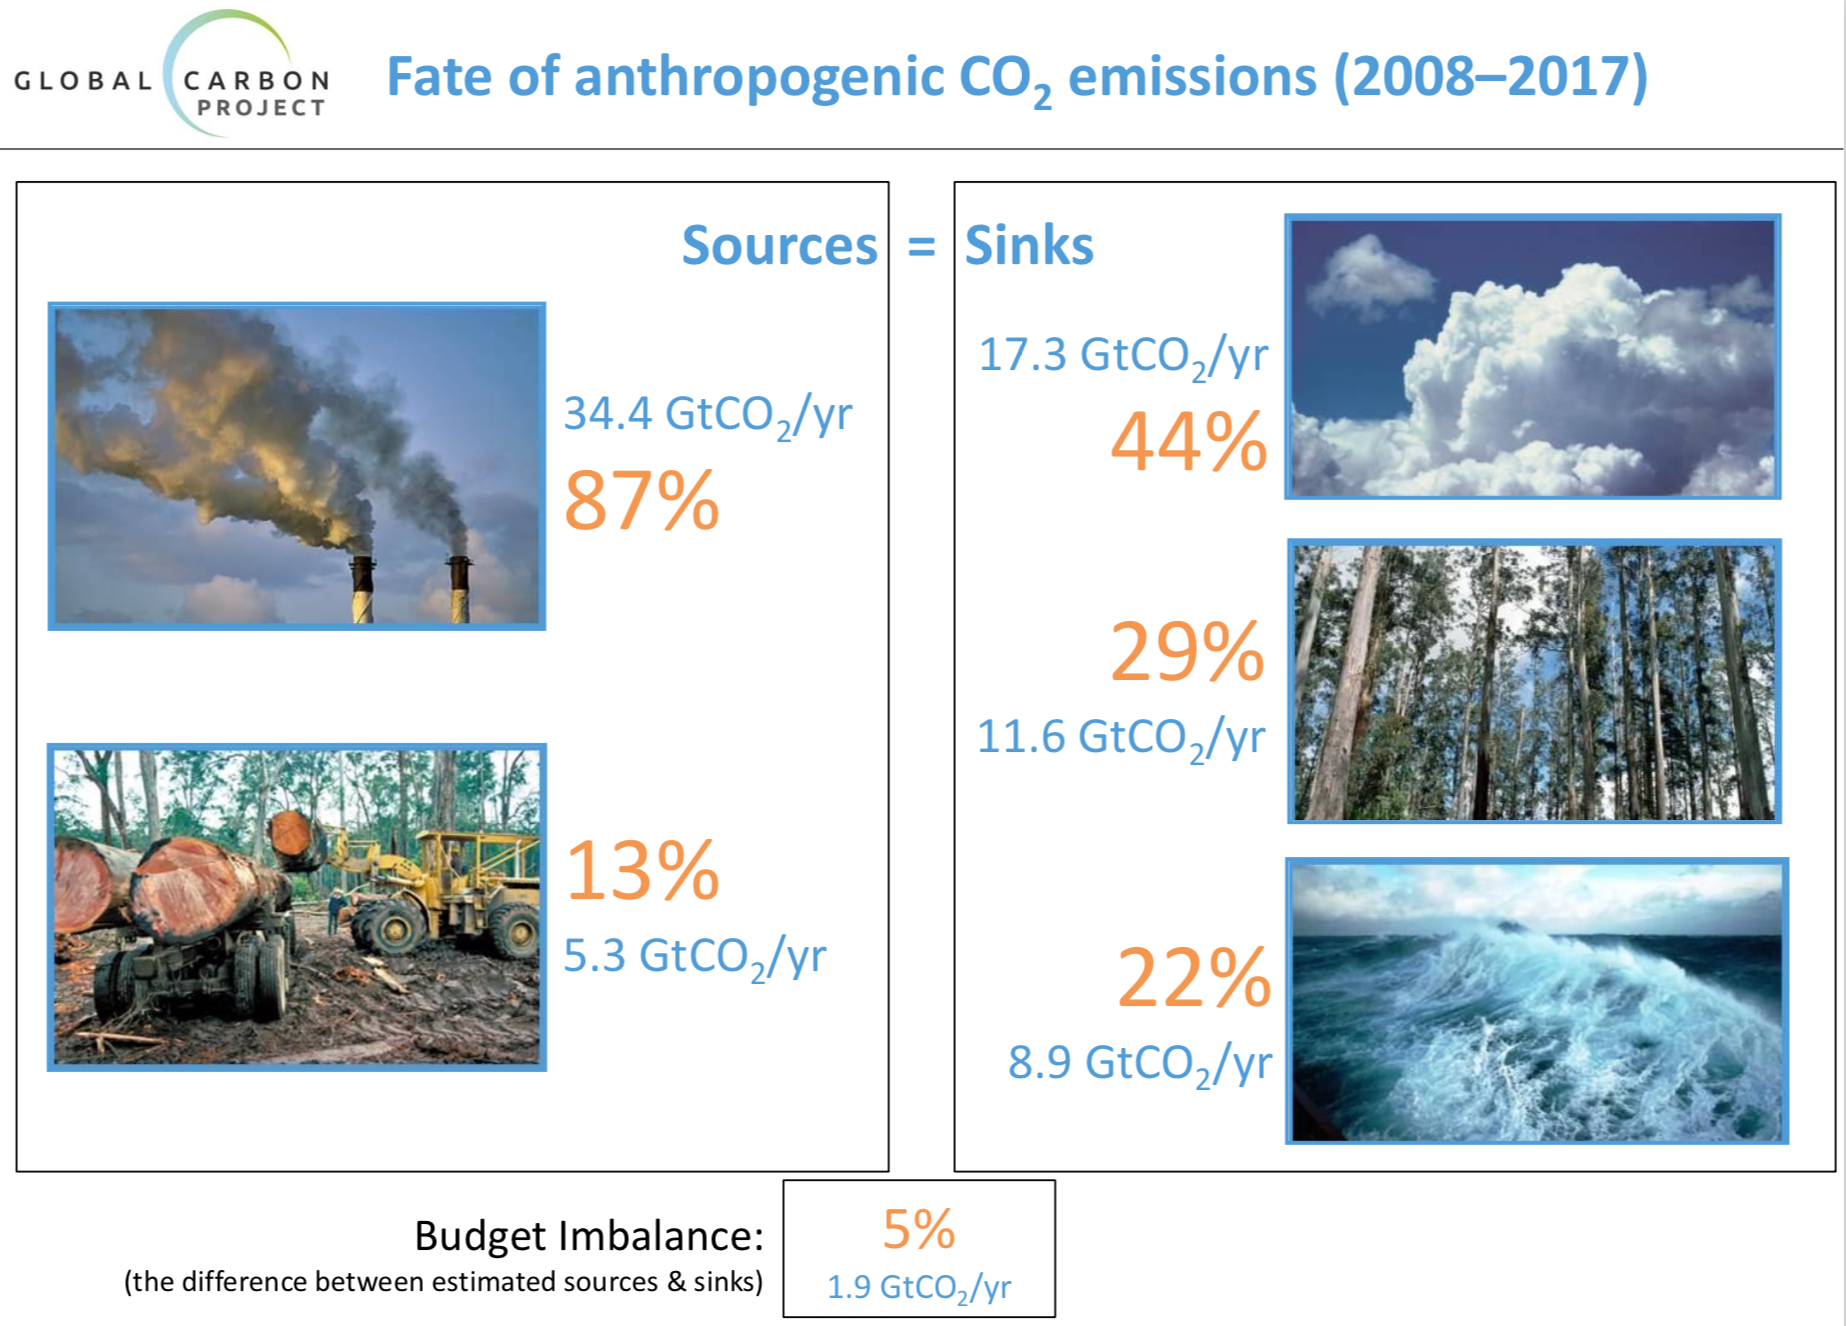
As shown below, the global ocean absorbed about 9GtCO2/yr of anthropogenic emissions over the last decade, and the land carbon sink about 12GtCO2/yr. (Interestingly, also shown is the carbon budget imbalance of 2GtCO2/yr; this is a gap in our understanding as stated in figure 7 and amounts to about 5% of our total emissions).19 Therefore, the quantity of annual CDR by 2050, prescribed for the pathways Below-1.5°C and 1.5°C-with-low-overshoot, is equivalent to an additional carbon sink of the size of a global ocean. By 2100 this is just under 1.7 global oceans, as shown by the right hand axis of Chart 10(a) above.
CDR deployed at scale is unproven, and reliance on such technology is a major risk in the ability to limit warming to 1.5°C.
IPCC Special Report on 1.5°C.21
Approaches under consideration include the enhancement of terrestrial and coastal carbon storage in plants and soils such as afforestation and reforestation, soil carbon enhancement, and other conservation, restoration, and management options for natural and managed land and coastal ecosystems. Biochar sequestration provides an additional route for terrestrial carbon storage. Other approaches are concerned with storing atmospheric carbon dioxide in geological formations. They include the combination of biomass use for energy production with carbon capture and storage (BECCS) and direct air capture with storage (DACCS) using chemical solvents and sorbents. Further approaches investigate the mineralization of atmospheric carbon dioxide, including enhanced weathering of rocks. A fourth group of approaches is concerned with the sequestration of carbon dioxide in the oceans, for example by means of ocean alkalinization. The costs, CDR potential and environmental side effects of several of these measures are increasingly investigated and compared in the literature, but large uncertainties remain, in particular concerning the feasibility and impact of large-scale deployment of CDR measures.
IPCC Special Report on 1.5°C.22
Note that carbon capture and storage (CCS) is not a form of CDR because it does not remove CO2 from the atmosphere; instead its aim is to lower the emission of CO2 from fossil fuelled electricity generation.
A variety of pilot projects failed in the past. One was a joint effort by one of the largest U.S. utilities, American Electric Power, and the Energy Department23 to capture 15 percent of emissions from coal-fired power plants. It closed down after two years. Another carbon capture project attached to a new coal-fired power plant in Mississippi ran into so many technical problems and billions of dollars in cost overruns that after six years its owners abandoned the carbon capture project and converted the plant to burn natural gas for power generation.
Dec 2018, The Washington Post, ‘Carbon removal is now a thing’: Radical fixes get a boost at climate talks.24
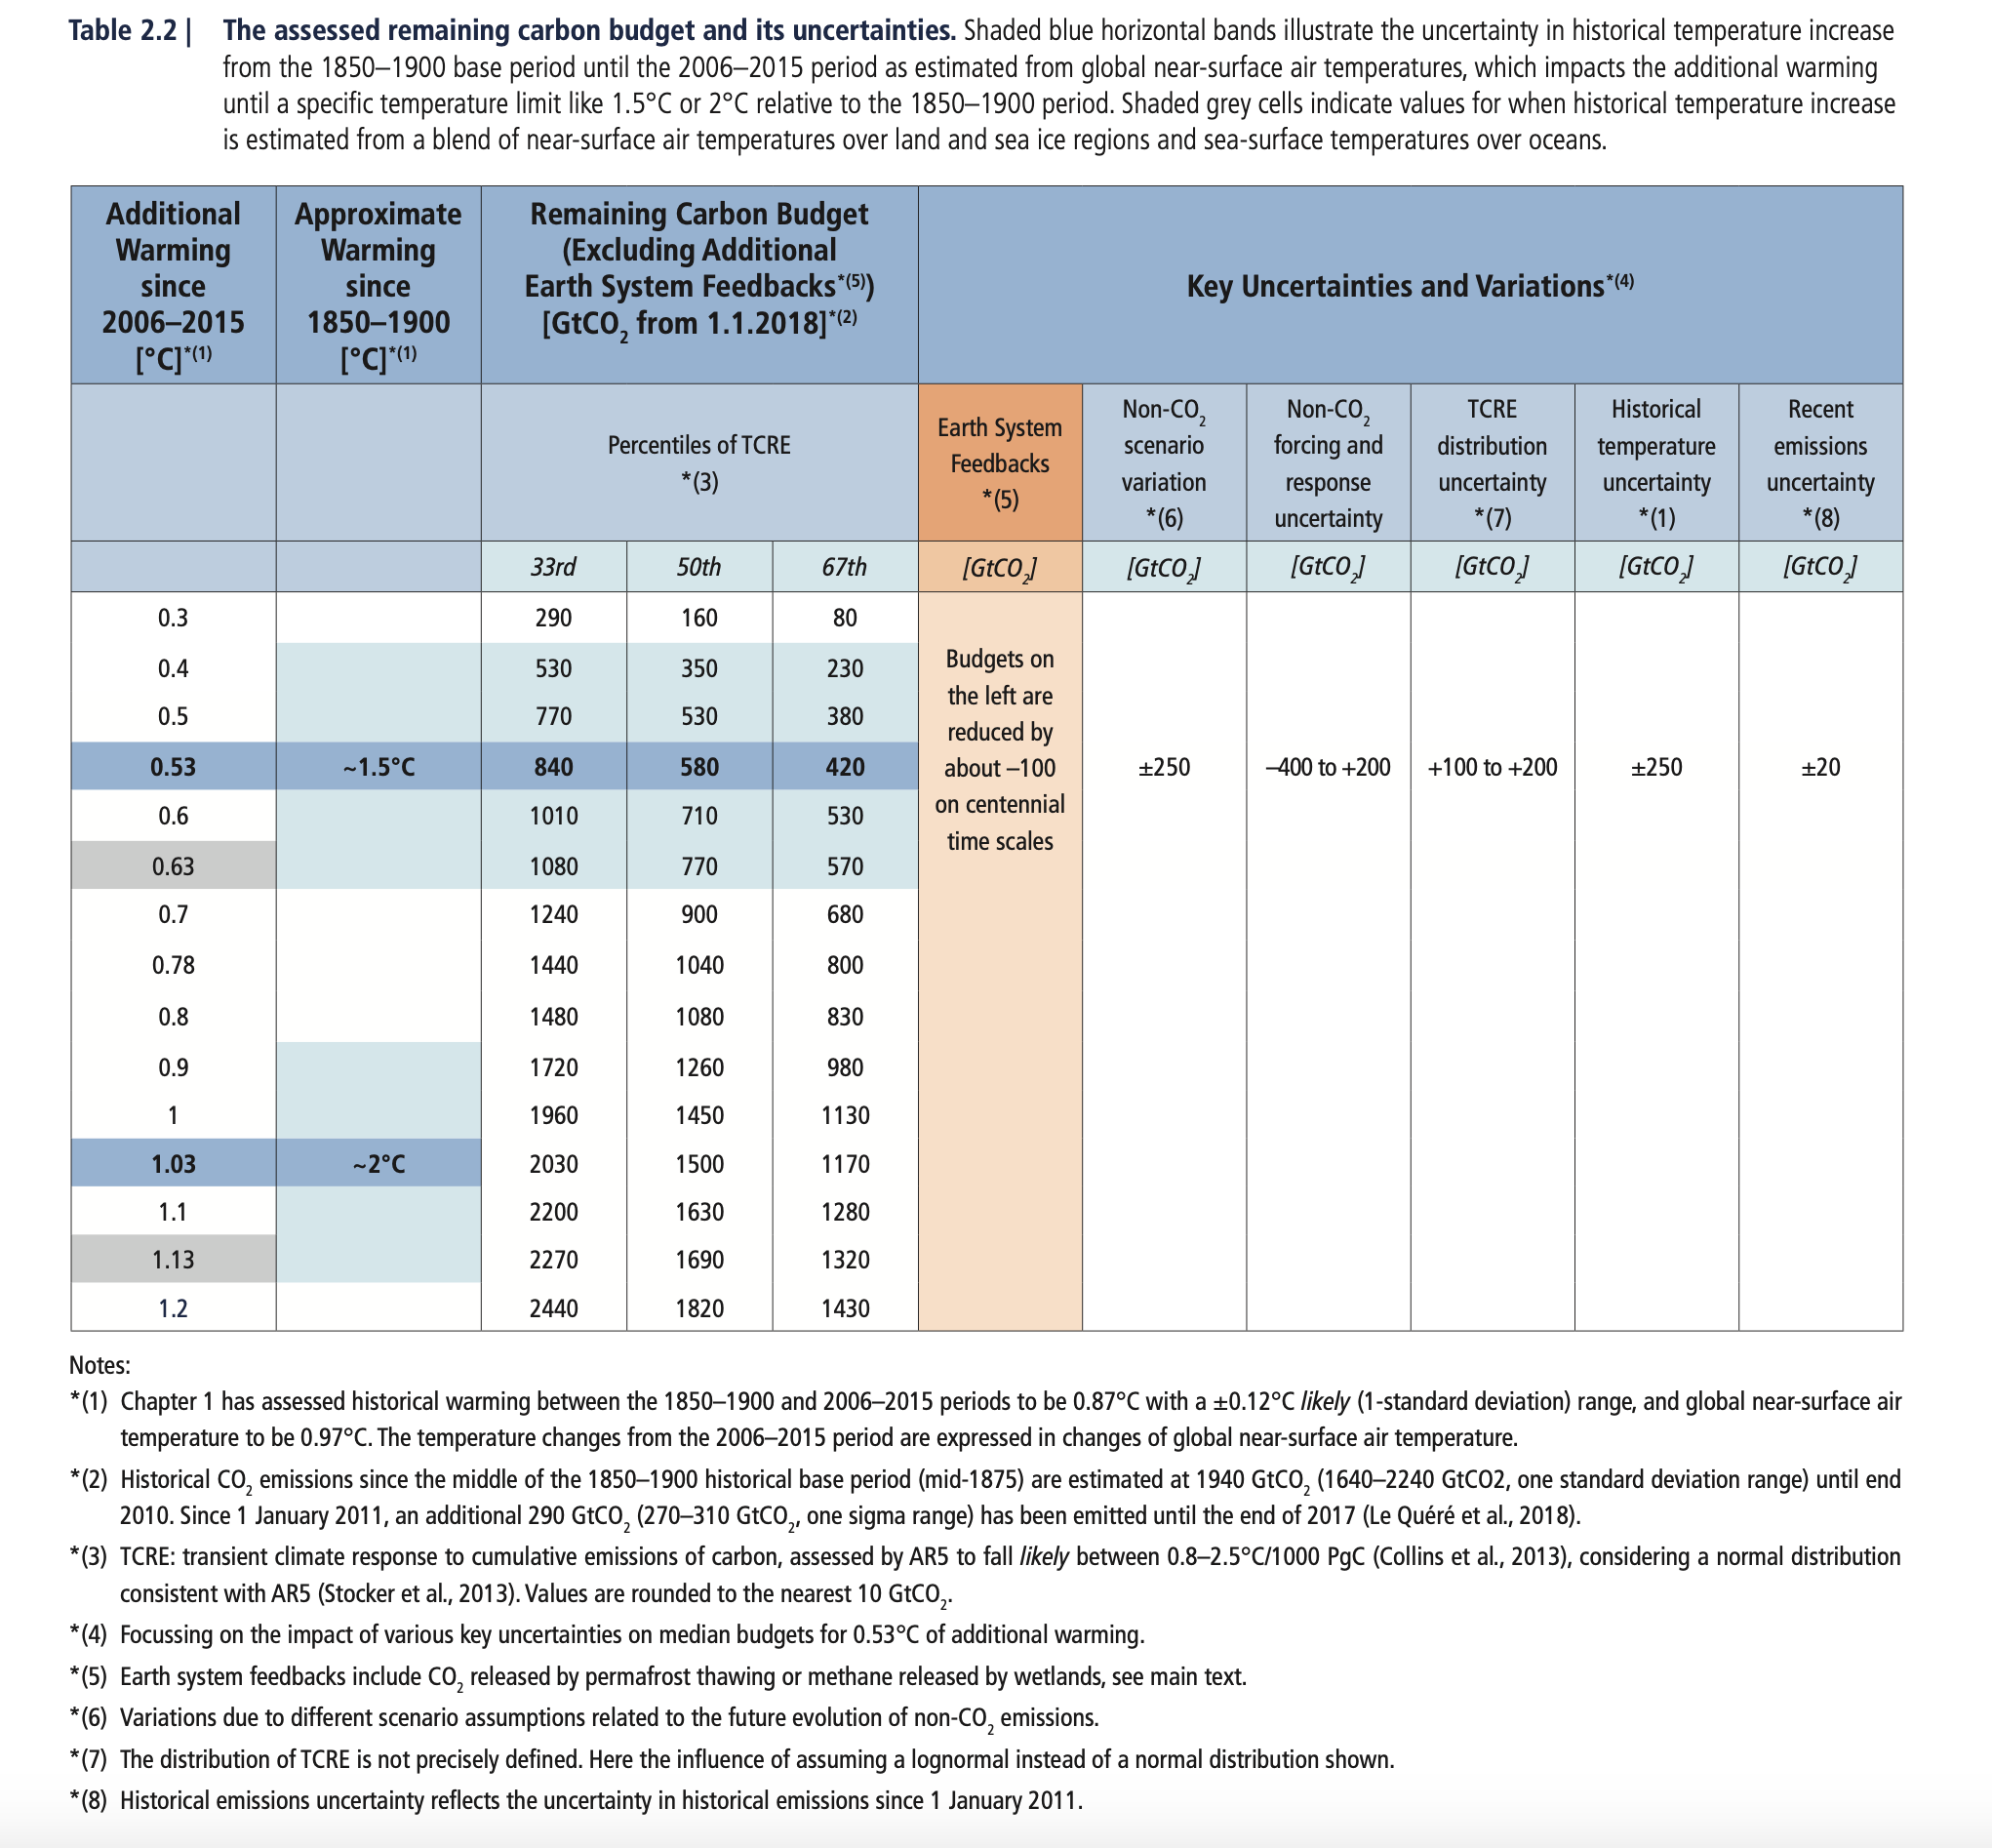
Our long-term warming commitment is determined by the quantity of long-lived greenhouse gasses emitted. Therefore the specific warming limits of 1.5˚C and 2˚C have corresponding carbon budgets, expressed in quantities of tonnes of CO2. The IPCC budgets include forcings (i.e. warming contributions) from nonCO2 gases in their range of budget uncertainties.
The size of the remaining budgets are extremely small relative to our annual emissions, suggesting that technological change has a limited role in the short term. Social change is also required, such as carbon pricing and or rationing of carbon.
The remaining carbon budget from 2018 onwards is 580GtCO2 for a 50% chance of keeping warming below 1.5C. This is less than 15 years of global emissions at current rates.25
So, what does that mean?
This means that if we start reducing emissions steeply now and by the time we reach net-zero levels we have not emitted more than 580GtCO2, our best scientific understanding tells us have we expect a one-in-two chance that warming would be kept to 1.5C.
Moreover, if we want to be sure that this is also true until the end of the century, we’d have to aim to emit only 480GtCO2 until we reach net-zero instead. This is under 12 years of current emissions.
‘A new approach for understanding the remaining carbon budget’, Dr Joeri Rogelj, Prof Piers Forster, CarbonBrief 2019.26
The remaining carbon budgets from 2020 onwards are listed below in table 3, calculated by subtracting the annual emissions of years 2018 and 2019 (shown in the supporting tables), away from the IPCC’s budgets shown in table 3. Also shown are the same remaining budgets with 50% of total uncertainties applied in either direction (50% was chosen because it would be unlikely for all uncertainties to align at an extremity). Note that 50th percentile of climate sensitivity refers to the most likely value.
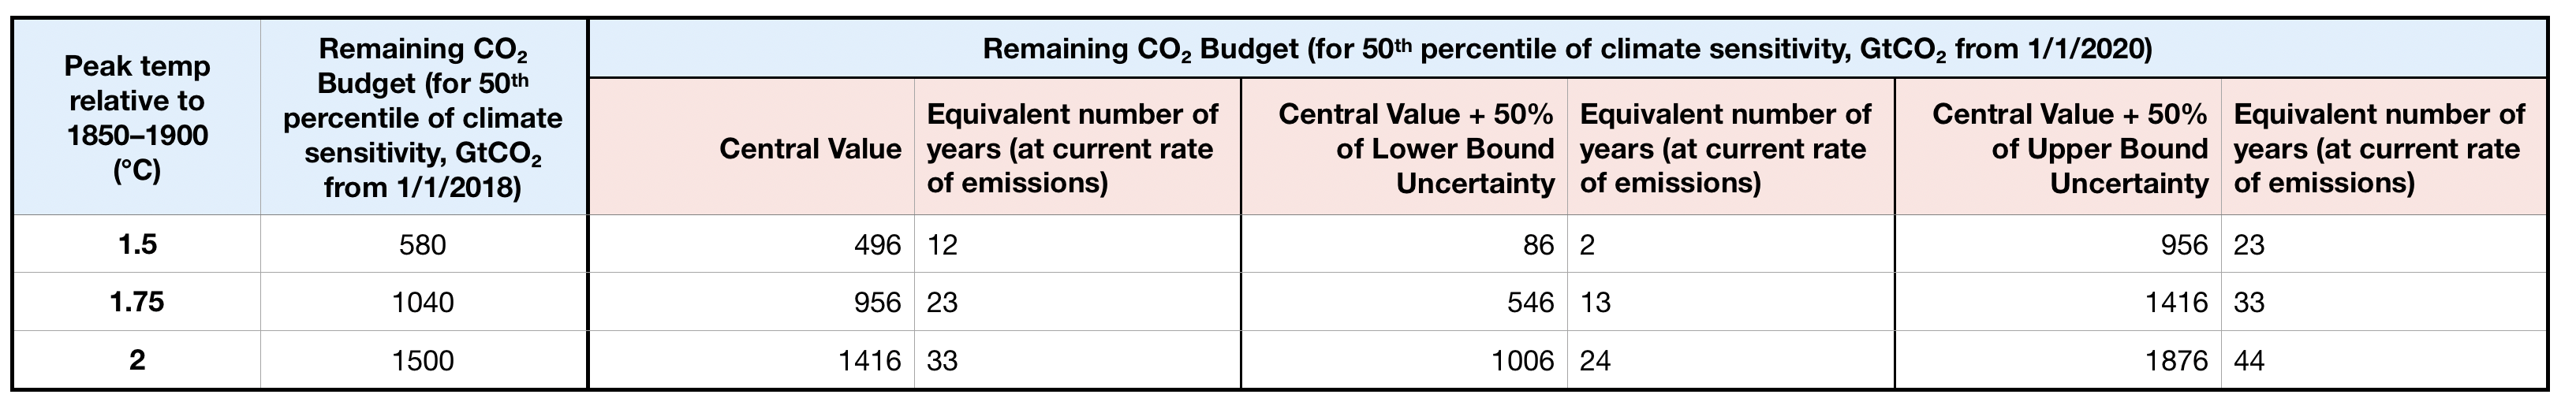
Table 1 shows the IPCC’s remaining carbon budget for 1.5˚C may be spent in 12 years at the current rate of emissions, but if 50% of total uncertainties are applied in either direction, the same budget is spent sometime in the next 2 to 23 years. The usefulness of IPCC budgets is questionable because associated with each budget are very large uncertainties and warming that will trigger rapid and large sea level rise. The exceedance of any budget doesn’t herald the end of our chance to limit and reduce warming. Instead it should be a very loud alarm that reminds us our greenhouse gas emissions remain dangerously excessive and unmanaged.
In summary, the IPCC’s pathway 1.5°C-with-low-overshoot prescribes the world decarbonise at a rate 1.6 times faster than it has recently carbonised (-4.4%/2.5%), and carbon dioxide removal (CDR) on the scale of the global ocean operational by 2050, and 1.7 oceans by 2100. In year 2100, this pathway has a 28% chance of exceeding 1.5°C, and a 7% chance of exceeding 2°C.27
Supporting information
- https://library.wmo.int/doc_num.php?explnum_id=5188[↩][↩]
- p. 100, Table 2.1, IPCC, 2018: Global Warming of 1.5°C. An IPCC Special Report on the impacts of global warming of 1.5°C above pre-industrial levels and related global greenhouse gas emission pathways, in the context of strengthening the global response to the threat of climate change, sustainable development, and efforts to eradicate poverty [Masson-Delmotte, V., P. Zhai, H.-O. Pörtner, D. Roberts, J. Skea, P.R. Shukla, A. Pirani, W. Moufouma-Okia, C. Péan, R. Pidcock, S. Connors, J.B.R. Matthews, Y. Chen, X. Zhou, M.I. Gomis, E. Lonnoy, T. Maycock, M. Tignor, and T. Waterfield (eds.)]. In Press. https://www.ipcc.ch/sr15/download/[↩]
- Territorial emissions in 1979 = 85MtCO2, 1984 = 57MtCO2(ref: http://www.globalcarbonatlas.org/en/CO2-emissions), (57 – 85)/(1984 – 1979) = -5.6%/yr of original amount.[↩]
- http://www.globalcarbonatlas.org/en/CO2-emissions[↩][↩]
- p. 119, Table 2.4, IPCC, 2018: Global Warming of 1.5°C. An IPCC Special Report on the impacts of global warming of 1.5°C above pre-industrial levels and related global greenhouse gas emission pathways, in the context of strengthening the global response to the threat of climate change, sustainable development, and efforts to eradicate poverty [Masson-Delmotte, V., P. Zhai, H.-O. Pörtner, D. Roberts, J. Skea, P.R. Shukla, A. Pirani, W. Moufouma-Okia, C. Péan, R. Pidcock, S. Connors, J.B.R. Matthews, Y. Chen, X. Zhou, M.I. Gomis, E. Lonnoy, T. Maycock, M. Tignor, and T. Waterfield (eds.)]. In Press. https://www.ipcc.ch/sr15/download/[↩]
- https://www.globalcarbonproject.org/carbonbudget/19/files/GCP_CarbonBudget_2019.pdf[↩]
- Global Carbon Project. (2019). Supplemental data of Global Carbon Budget 2019 (Version 1.0) [Data set]. Global Carbon Project, https://www.icos-cp.eu/GCP/2019, download labelled ‘2019 Global Budget v1.0’.[↩][↩][↩]
- In 1984 France emitted 407MtCO2 and the World 19,217MtCO2 (refer http://www.globalcarbonatlas.org/en/CO2-emissions), 407/19,217 = 2.1%.[↩]
- In 1981 Sweden emitted 69MtCO2 and the World 18,787MtCO2, 69/18,787 = 0.4%.[↩]
- In 1992 Russia emitted 1,993MtCO2 and the World 22,195MtCO2, 1,993/22,195 = 9%.[↩]
- https://en.wikipedia.org/wiki/Dissolution_of_the_Soviet_Union[↩]
- p. 2A-28, Table 2.SM.12, Huppmann, D., Kriegler, E. and Mundaca, L., 2. SM Mitigation pathways compatible with 1.5 C in the context of sustainable development–Supplementary Material. https://www.ipcc.ch/site/assets/uploads/2018/11/sr15_chapter2_supplementary_materials.pdf[↩][↩][↩]
- WMO, 2017, State of the Global Climate in 2017, http://public.wmo.int/en/our-mandate/climate/wmo-statement-state-of-global-climate[↩]
- WMO Statement on the State of the Global Climate in 2017, https://public.wmo.int/en/our-mandate/climate/wmo-statement-state-of-global-climate[↩]
- p. 34, IPCC, 2018: Global Warming of 1.5°C. An IPCC Special Report on the impacts of global warming of 1.5°C above pre-industrial levels and related global greenhouse gas emission pathways, in the context of strengthening the global response to the threat of climate change, sustainable development, and efforts to eradicate poverty [Masson-Delmotte, V., P. Zhai, H.-O. Pörtner, D. Roberts, J. Skea, P.R. Shukla, A. Pirani, W. Moufouma-Okia, C. Péan, R. Pidcock, S. Connors, J.B.R. Matthews, Y. Chen, X. Zhou, M.I. Gomis, E. Lonnoy, T. Maycock, M. Tignor, and T. Waterfield (eds.)]. In Press. https://www.ipcc.ch/sr15/download/[↩]
- Calculated using average values of annual CDR addition shown in p. 128, fig 2.13, IPCC, 2018: Global Warming of 1.5°C. An IPCC Special Report on the impacts of global warming of 1.5°C above pre-industrial levels and related global greenhouse gas emission pathways, in the context of strengthening the global response to the threat of climate change, sustainable development, and efforts to eradicate poverty [Masson-Delmotte, V., P. Zhai, H.-O. Pörtner, D. Roberts, J. Skea, P.R. Shukla, A. Pirani, W. Moufouma-Okia, C. Péan, R. Pidcock, S. Connors, J.B.R. Matthews, Y. Chen, X. Zhou, M.I. Gomis, E. Lonnoy, T. Maycock, M. Tignor, and T. Waterfield (eds.)]. In Press.https://www.ipcc.ch/sr15/download/[↩]
- Luderer, G., Vrontisi, Z., Bertram, C., Edelenbosch, O.Y., Pietzcker, R.C., Rogelj, J., De Boer, H.S., Drouet, L., Emmerling, J., Fricko, O. and Fujimori, S., 2018. Residual fossil CO 2 emissions in 1.5–2° C pathways. Nature Climate Change, 8(7), p.626. https://www.nature.com/articles/s41558-018-0198-6, https://dspace.library.uu.nl/bitstream/handle/1874/365540/s41558_018_0198_6.pdf?sequence=1[↩]
- p. 1, Rockström, J. et al. (2016), The world’s biggest gamble, Earth’s Future, 4, 465 – 470, doi:10.1002/2016EF000392. https://agupubs.onlinelibrary.wiley.com/doi/full/10.1002/2016EF000392[↩]
- On average over 2008 – 2017, emissions from fossil fuels and industry were 34.4GtCO2/yr and from land use change 5.3GtCO2/yr, (1.9 / (34.4 + 5.3) = 4.7%) [↩]
- https://www.globalcarbonproject.org/carbonbudget/18/presentation.htm[↩]
- p. 96, IPCC, 2018: Global Warming of 1.5°C. An IPCC Special Report on the impacts of global warming of 1.5°C above pre-industrial levels and related global greenhouse gas emission pathways, in the context of strengthening the global response to the threat of climate change, sustainable development, and efforts to eradicate poverty [Masson-Delmotte, V., P. Zhai, H.-O. Pörtner, D. Roberts, J. Skea, P.R. Shukla, A. Pirani, W. Moufouma-Okia, C. Péan, R. Pidcock, S. Connors, J.B.R. Matthews, Y. Chen, X. Zhou, M.I. Gomis, E. Lonnoy, T. Maycock, M. Tignor, and T. Waterfield (eds.)]. In Press. https://www.ipcc.ch/sr15/download/[↩]
- p. 121, IPCC, 2018: Global Warming of 1.5°C. An IPCC Special Report on the impacts of global warming of 1.5°C above pre-industrial levels and related global greenhouse gas emission pathways, in the context of strengthening the global response to the threat of climate change, sustainable development, and efforts to eradicate poverty [Masson-Delmotte, V., P. Zhai, H.-O. Pörtner, D. Roberts, J. Skea, P.R. Shukla, A. Pirani, W. Moufouma-Okia, C. Péan, R. Pidcock, S. Connors, J.B.R. Matthews, Y. Chen, X. Zhou, M.I. Gomis, E. Lonnoy, T. Maycock, M. Tignor, and T. Waterfield (eds.)]. In Press. https://www.ipcc.ch/sr15/download/[↩]
- http://www.washingtonpost.com/wp-dyn/content/article/2009/08/10/AR2009081002709.html[↩]
- https://www.washingtonpost.com/national/health-science/carbon-removal-is-now-a-thing-radical-fixes-get-a-boost-at-climate-talks/2018/12/11/d22efd40-fd01-11e8-83c0-b06139e540e5_story.html?utm_term=.1aac8acdcff4[↩]
- https://www.carbonbrief.org/analysis-fossil-fuel-emissions-in-2018-increasing-at-fastest-rate-for-seven-years[↩]
- https://www.carbonbrief.org/guest-post-a-new-approach-for-understanding-the-remaining-carbon-budget[↩]
- p. 2A-28, Table 2.SM.12, row ‘1.5°C-low-OS’, column ‘Geophysical characteristics in 2100’, Huppmann, D., Kriegler, E. and Mundaca, L., 2. SM Mitigation pathways compatible with 1.5 C in the context of sustainable development–Supplementary Material, https://www.ipcc.ch/site/assets/uploads/2018/11/sr15_chapter2_supplementary_materials.pdf[↩]
- p. 108, table 2.2, IPCC, 2018: Global Warming of 1.5°C. An IPCC Special Report on the impacts of global warming of 1.5°C above pre-industrial levels and related global greenhouse gas emission pathways, in the context of strengthening the global response to the threat of climate change, sustainable development, and efforts to eradicate poverty [Masson-Delmotte, V., P. Zhai, H.-O. Pörtner, D. Roberts, J. Skea, P.R. Shukla, A. Pirani, W. Moufouma-Okia, C. Péan, R. Pidcock, S. Connors, J.B.R. Matthews, Y. Chen, X. Zhou, M.I. Gomis, E. Lonnoy, T. Maycock, M. Tignor, and T. Waterfield (eds.)]. In Press. https://www.ipcc.ch/sr15/[↩]