Updated August 2023 – improved appearance of chart 1.
Annual shares
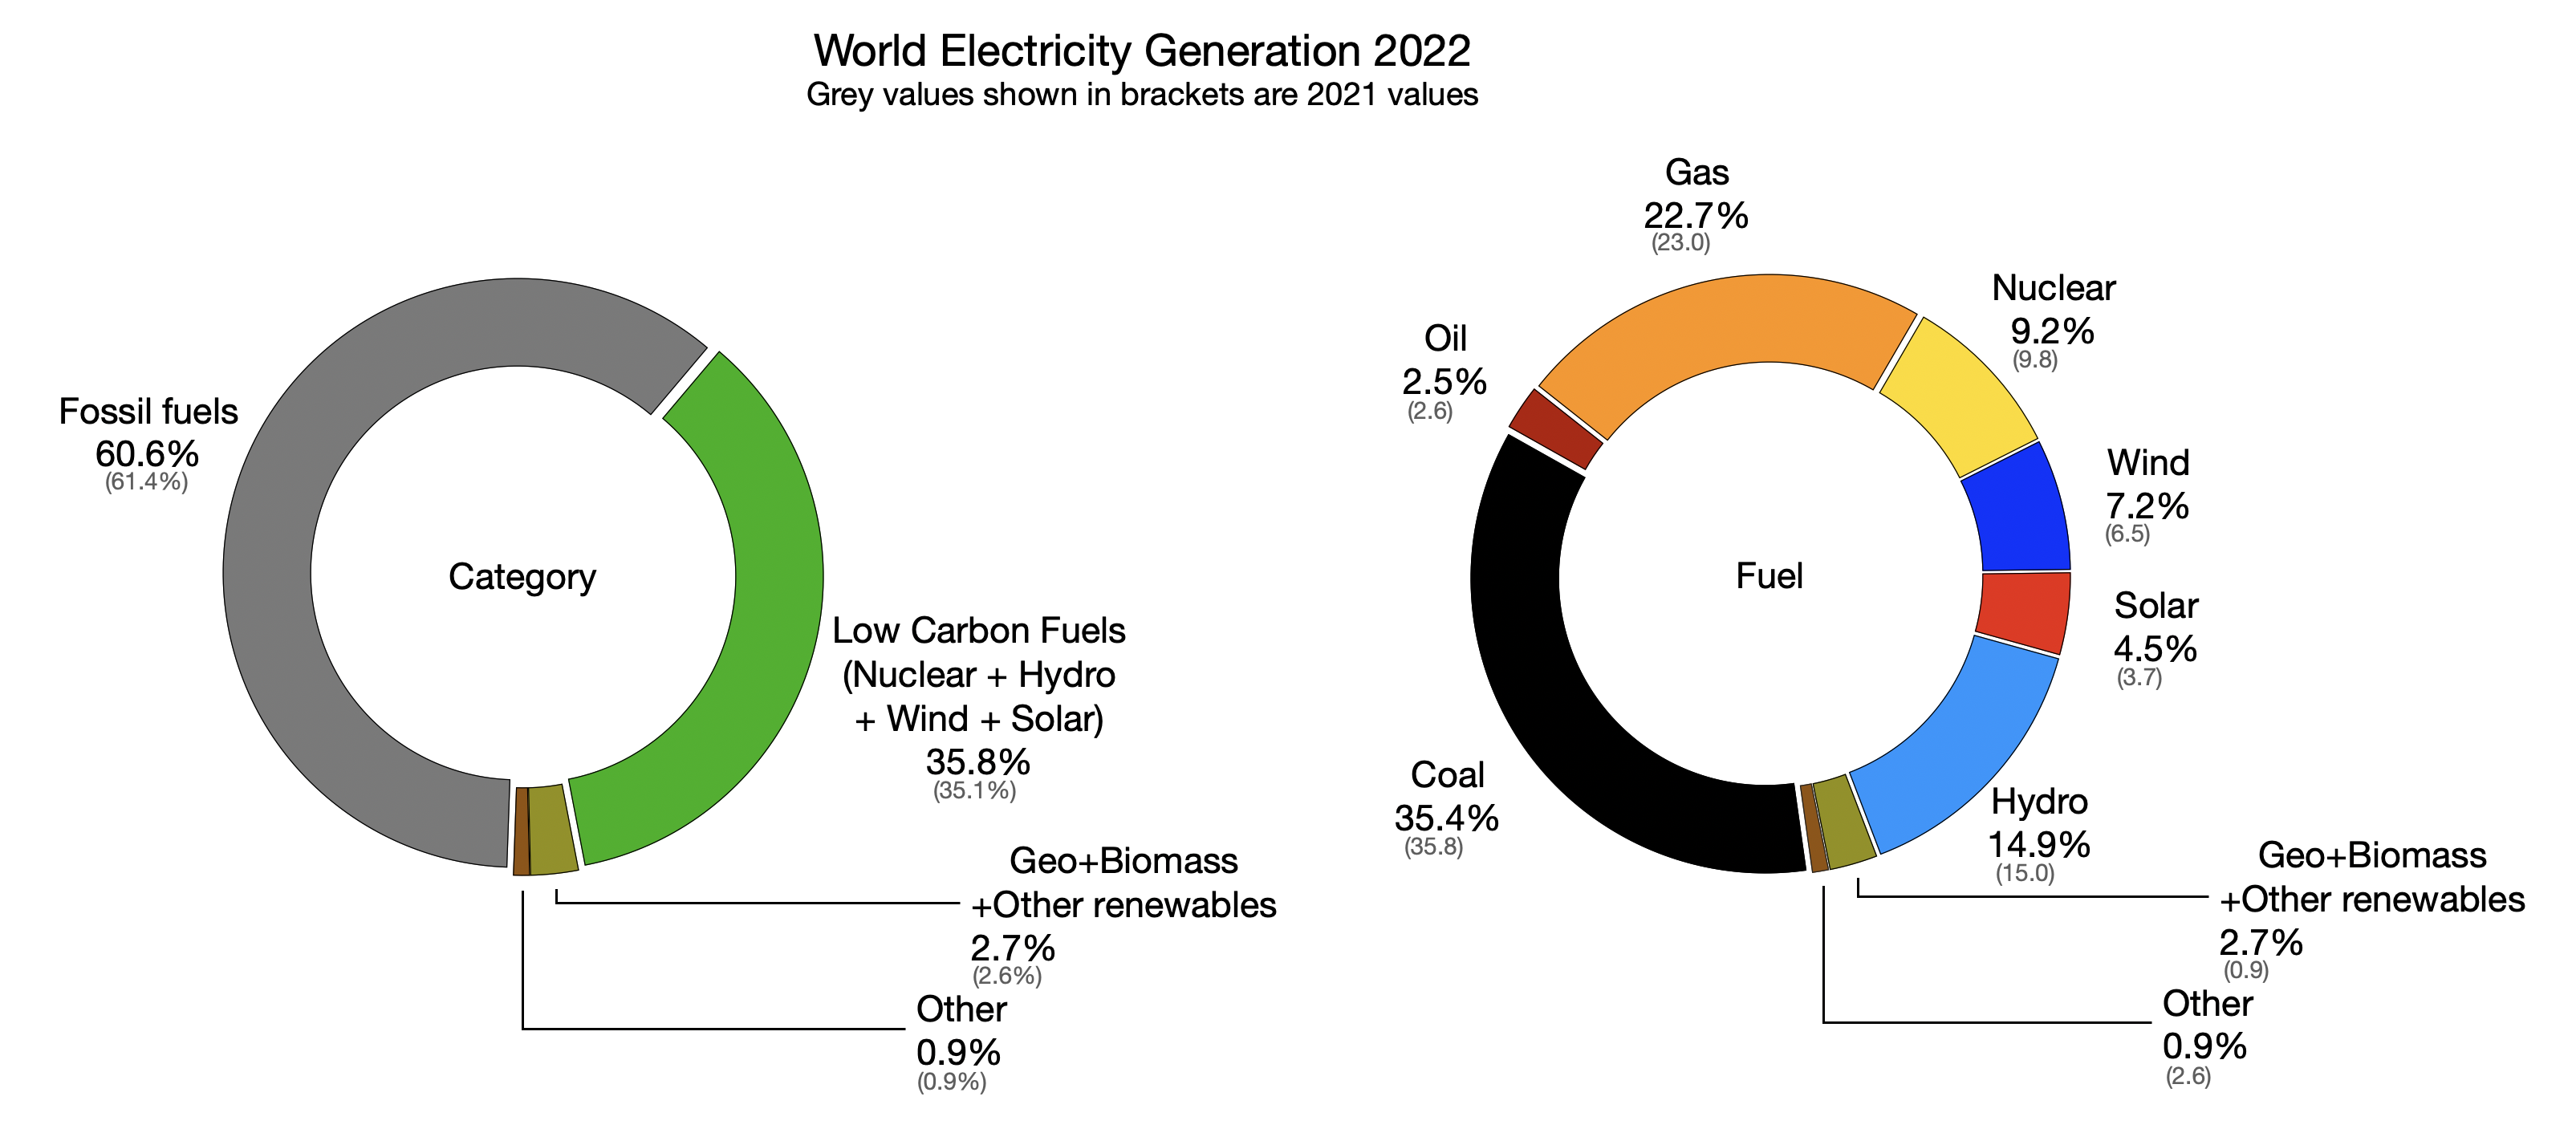
Chart 1. World electricity generation by share in 2022. Data: Energy Institute Statistical Review of World Energy 20231.
Trends
By share
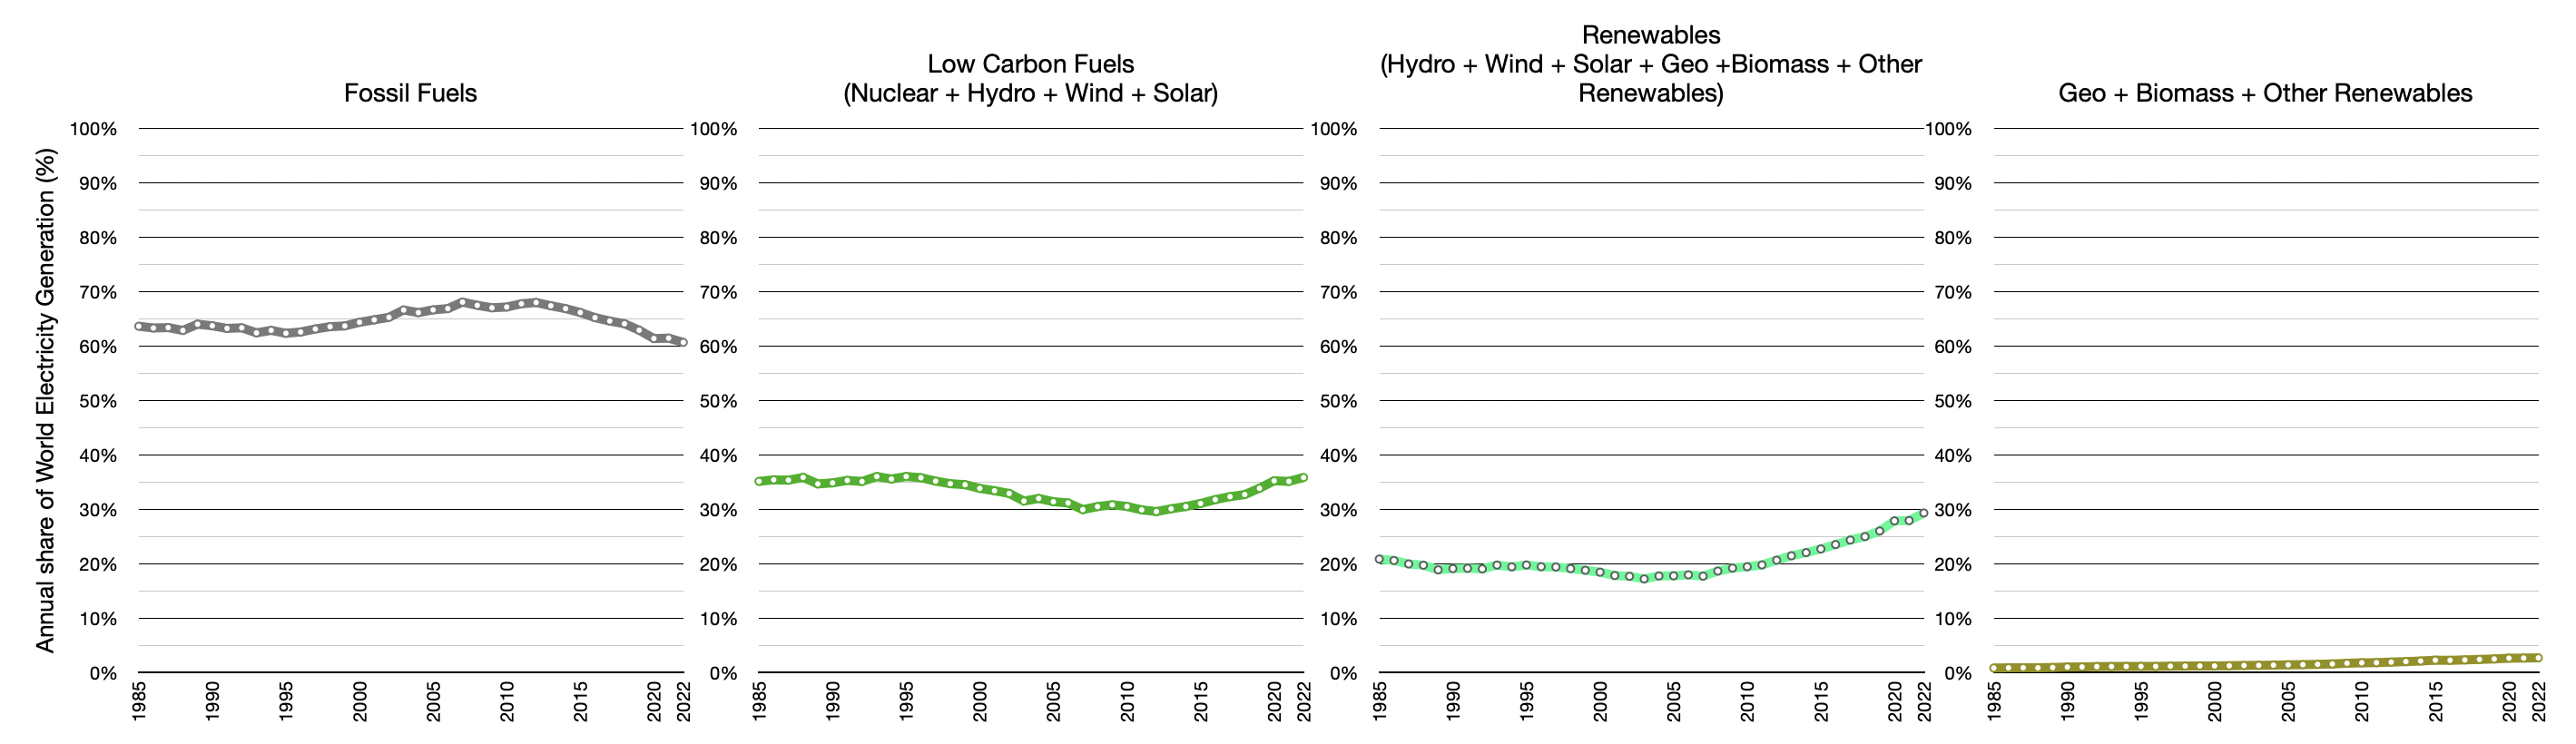
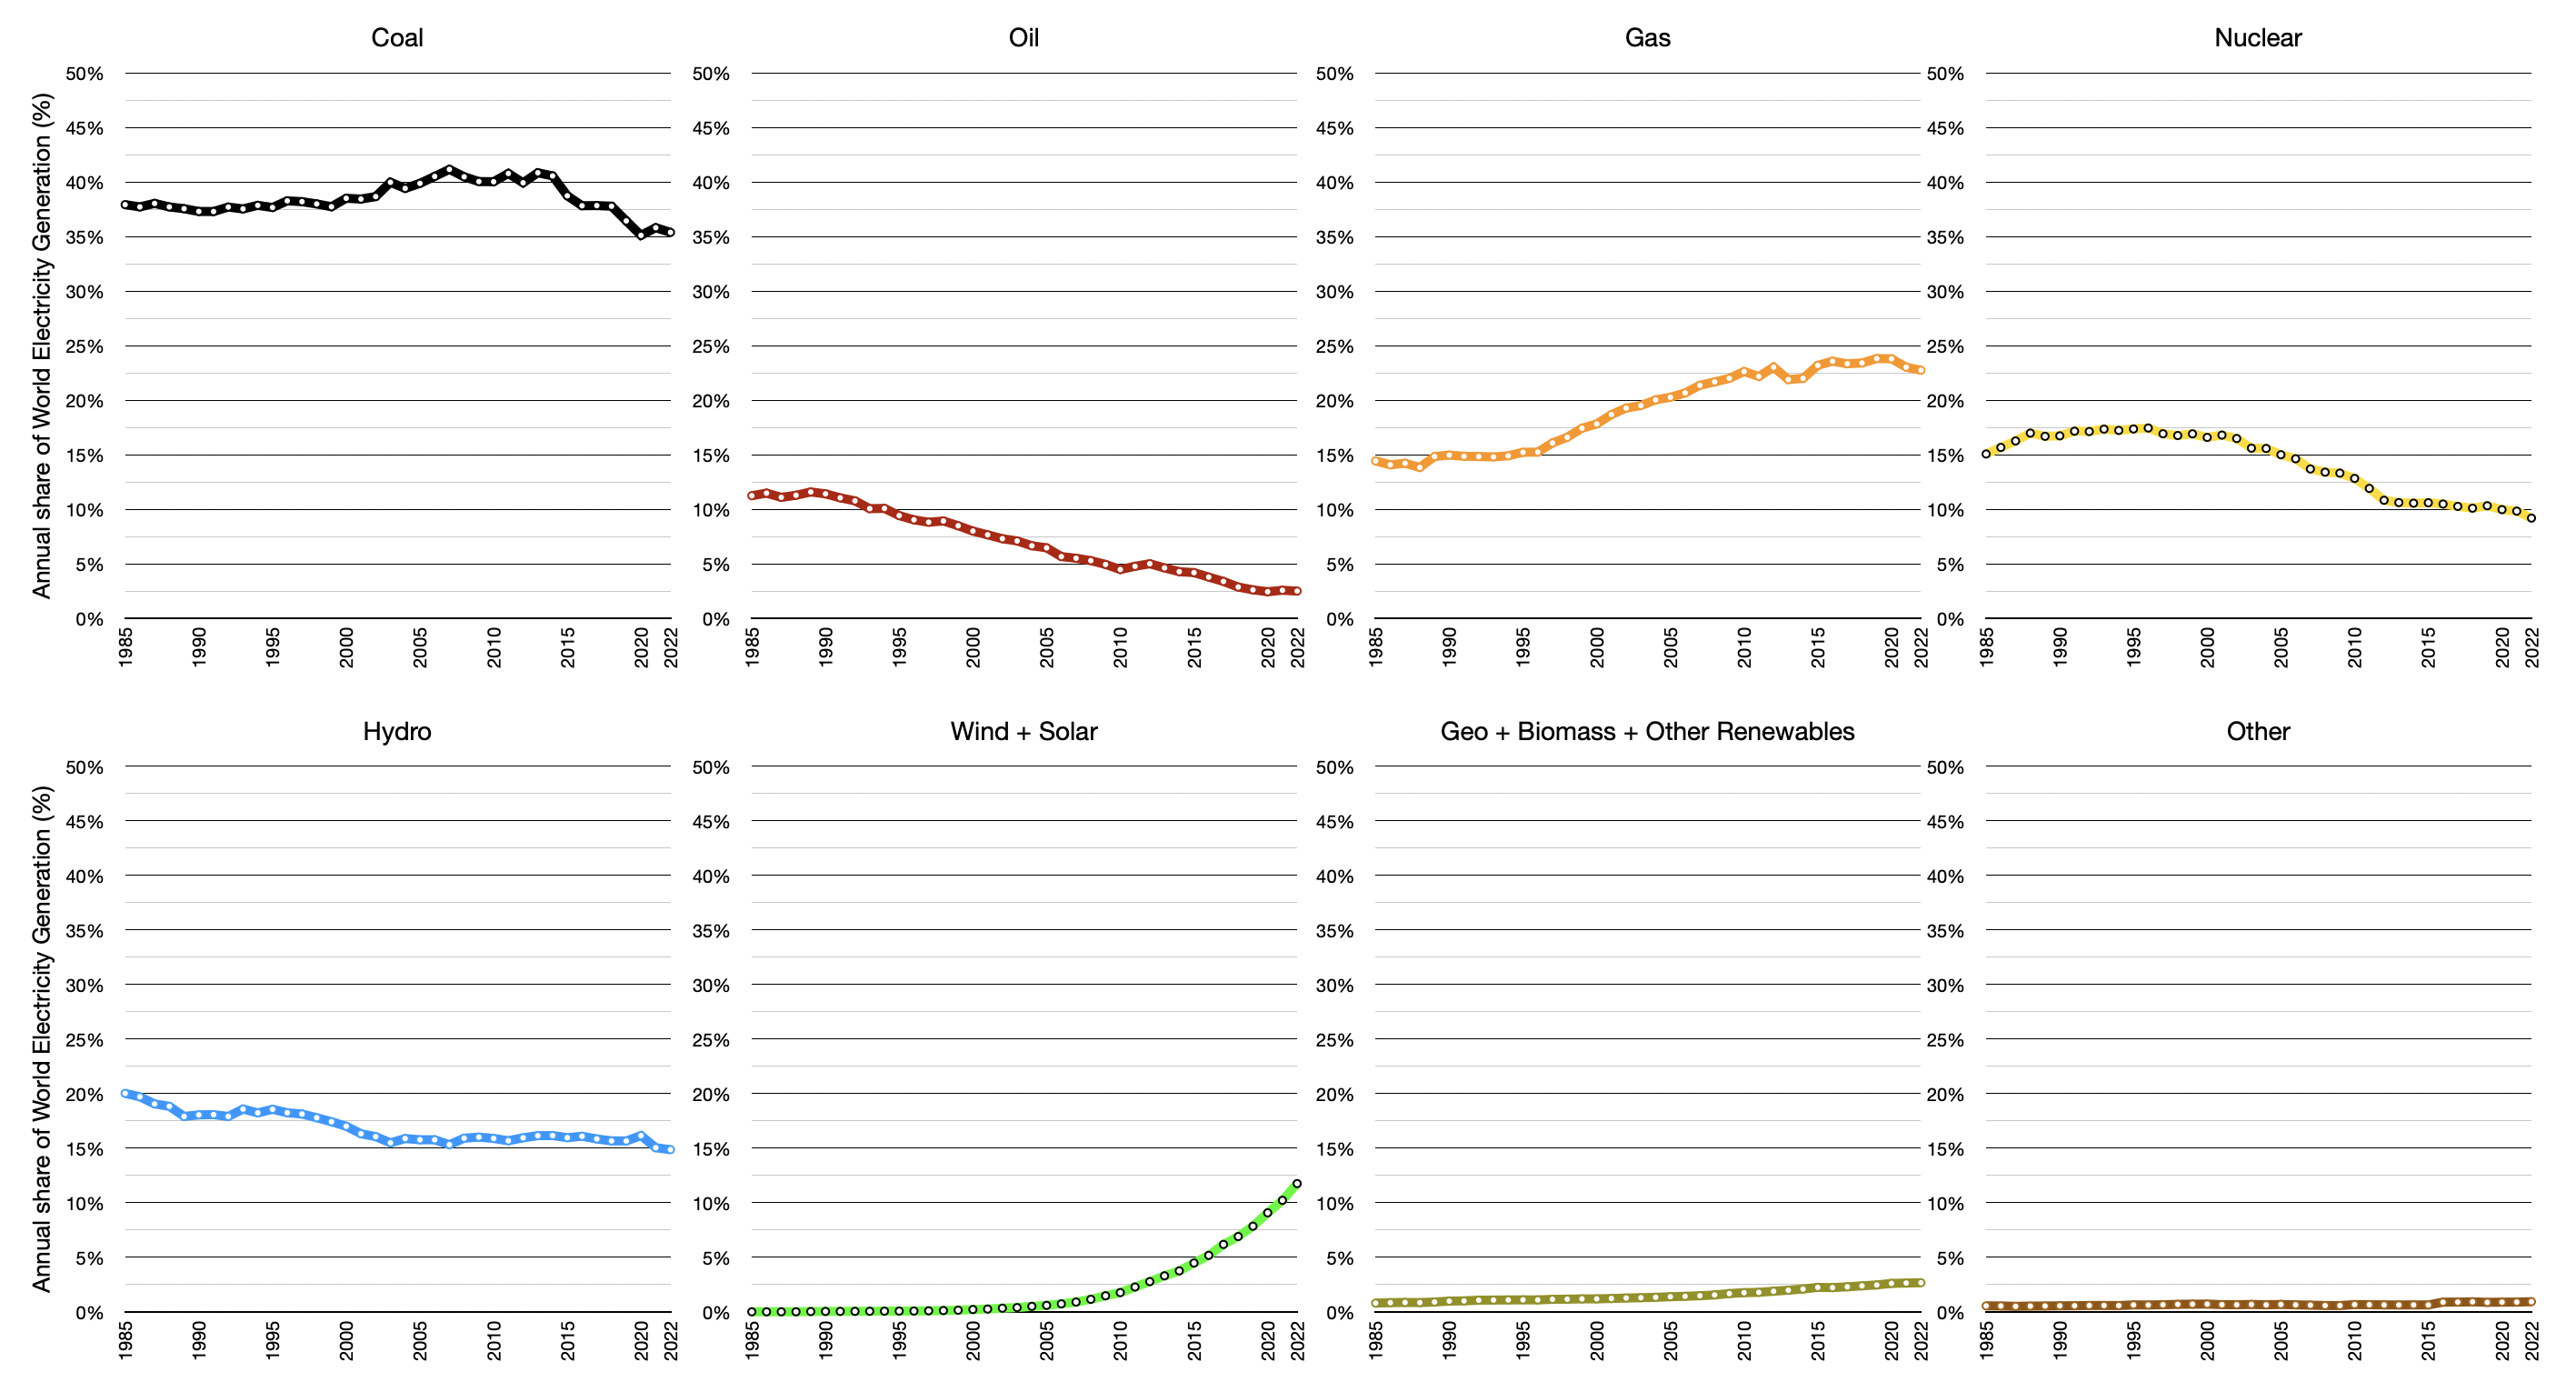
Chart 2. World electricity generation by annual share of category. Data: Energy Institute Statistical Review of World Energy 20231.Chart 3. World electricity generation by annual share of fuel. Data: Energy Institute Statistical Review of World Energy 20231.
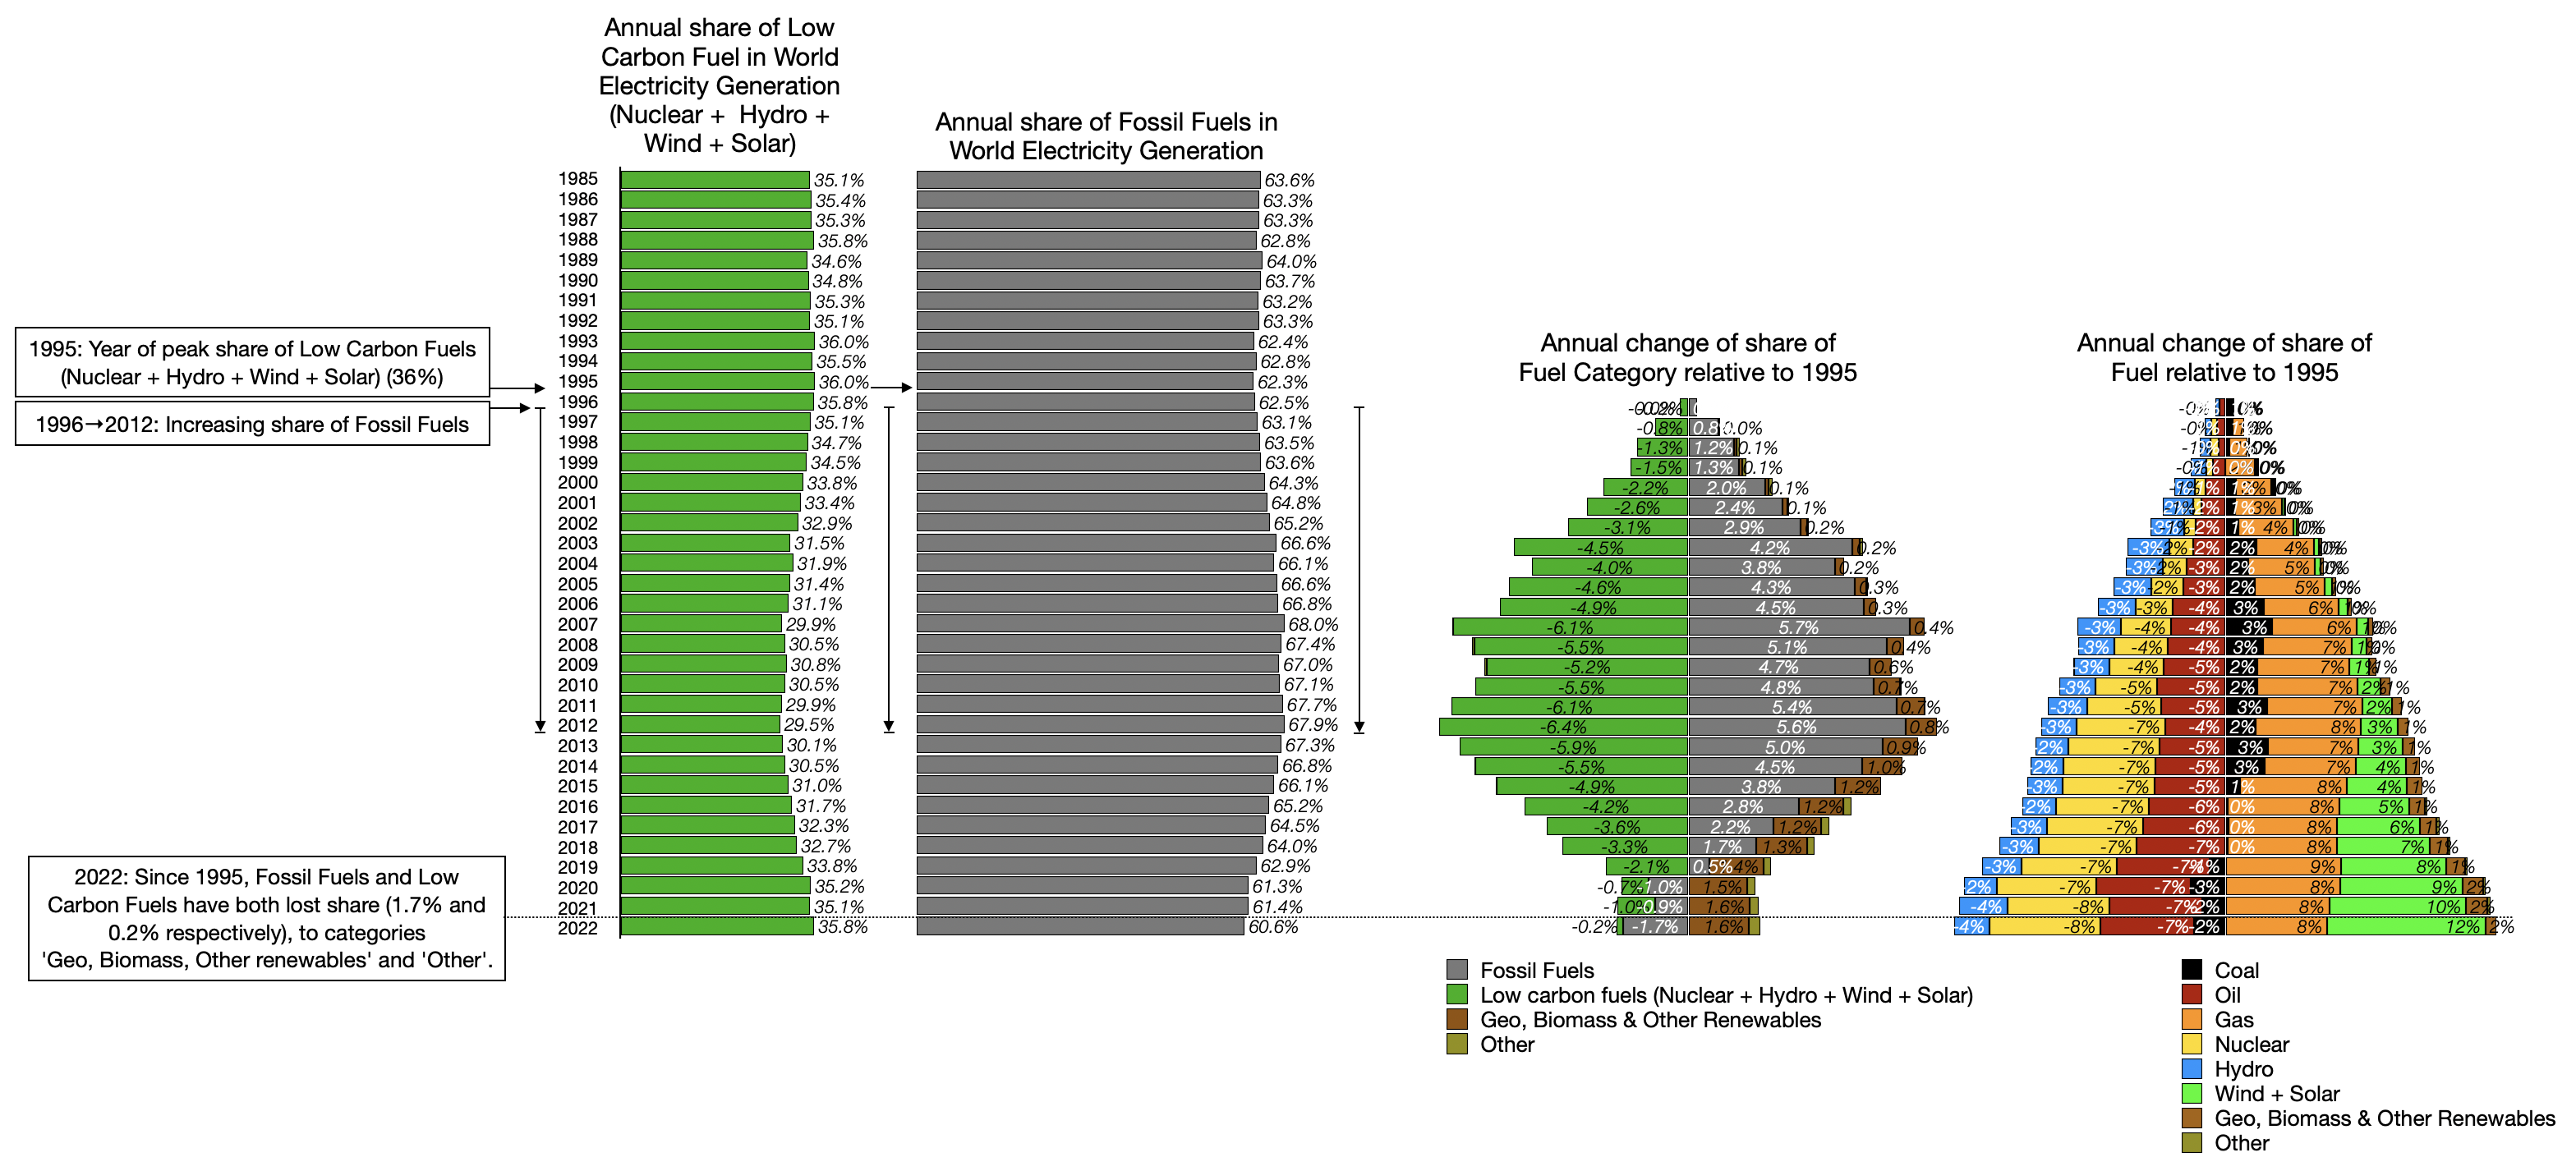
Chart 4 below shows the trends of global electricity generation by share in detail. The share of low carbon fuels (nuclear, hydro, wind & solar) peaked at 36% in 1995, coinciding with COP12.
Over the following 17 years, from 1996 to 2012, fossil fuels gained share, mainly due to the increased share of gas and the declining share of nuclear and hydro. As wind and solar then became significant, this trend reversed. Despite this, and the hosting of twenty seven UN climate conferences, the share of electricity generation by low carbon fuels in 2022 was only roughly equivalent to the peak in 1995.
Chart 4. World electricity generation by share and change of share with respect to 1995, the year of the United Nations’ first Climate Change Conference of Parties (COP1)2. Data: Energy Institute Statistical Review of World Energy 20231.
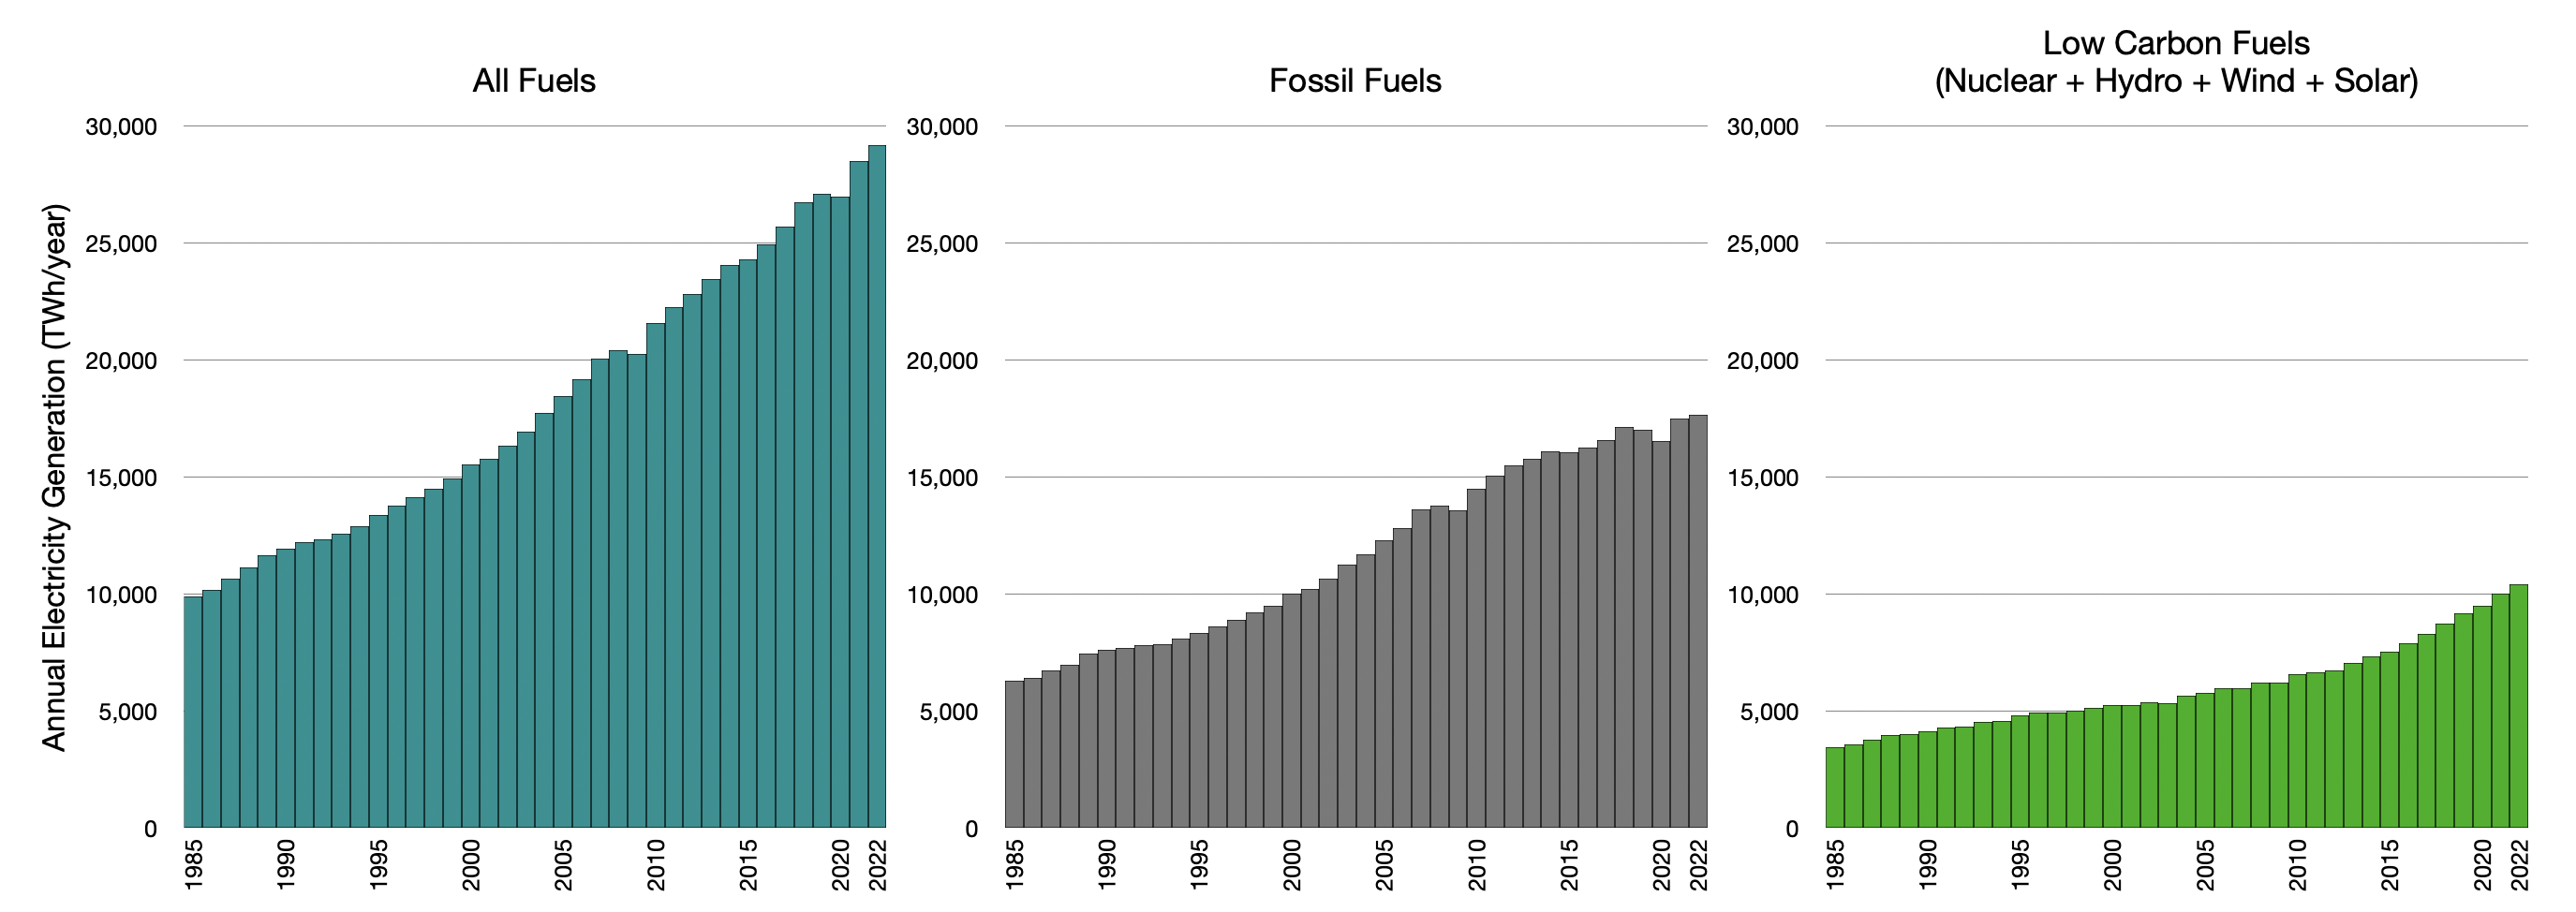
Absolute quantities
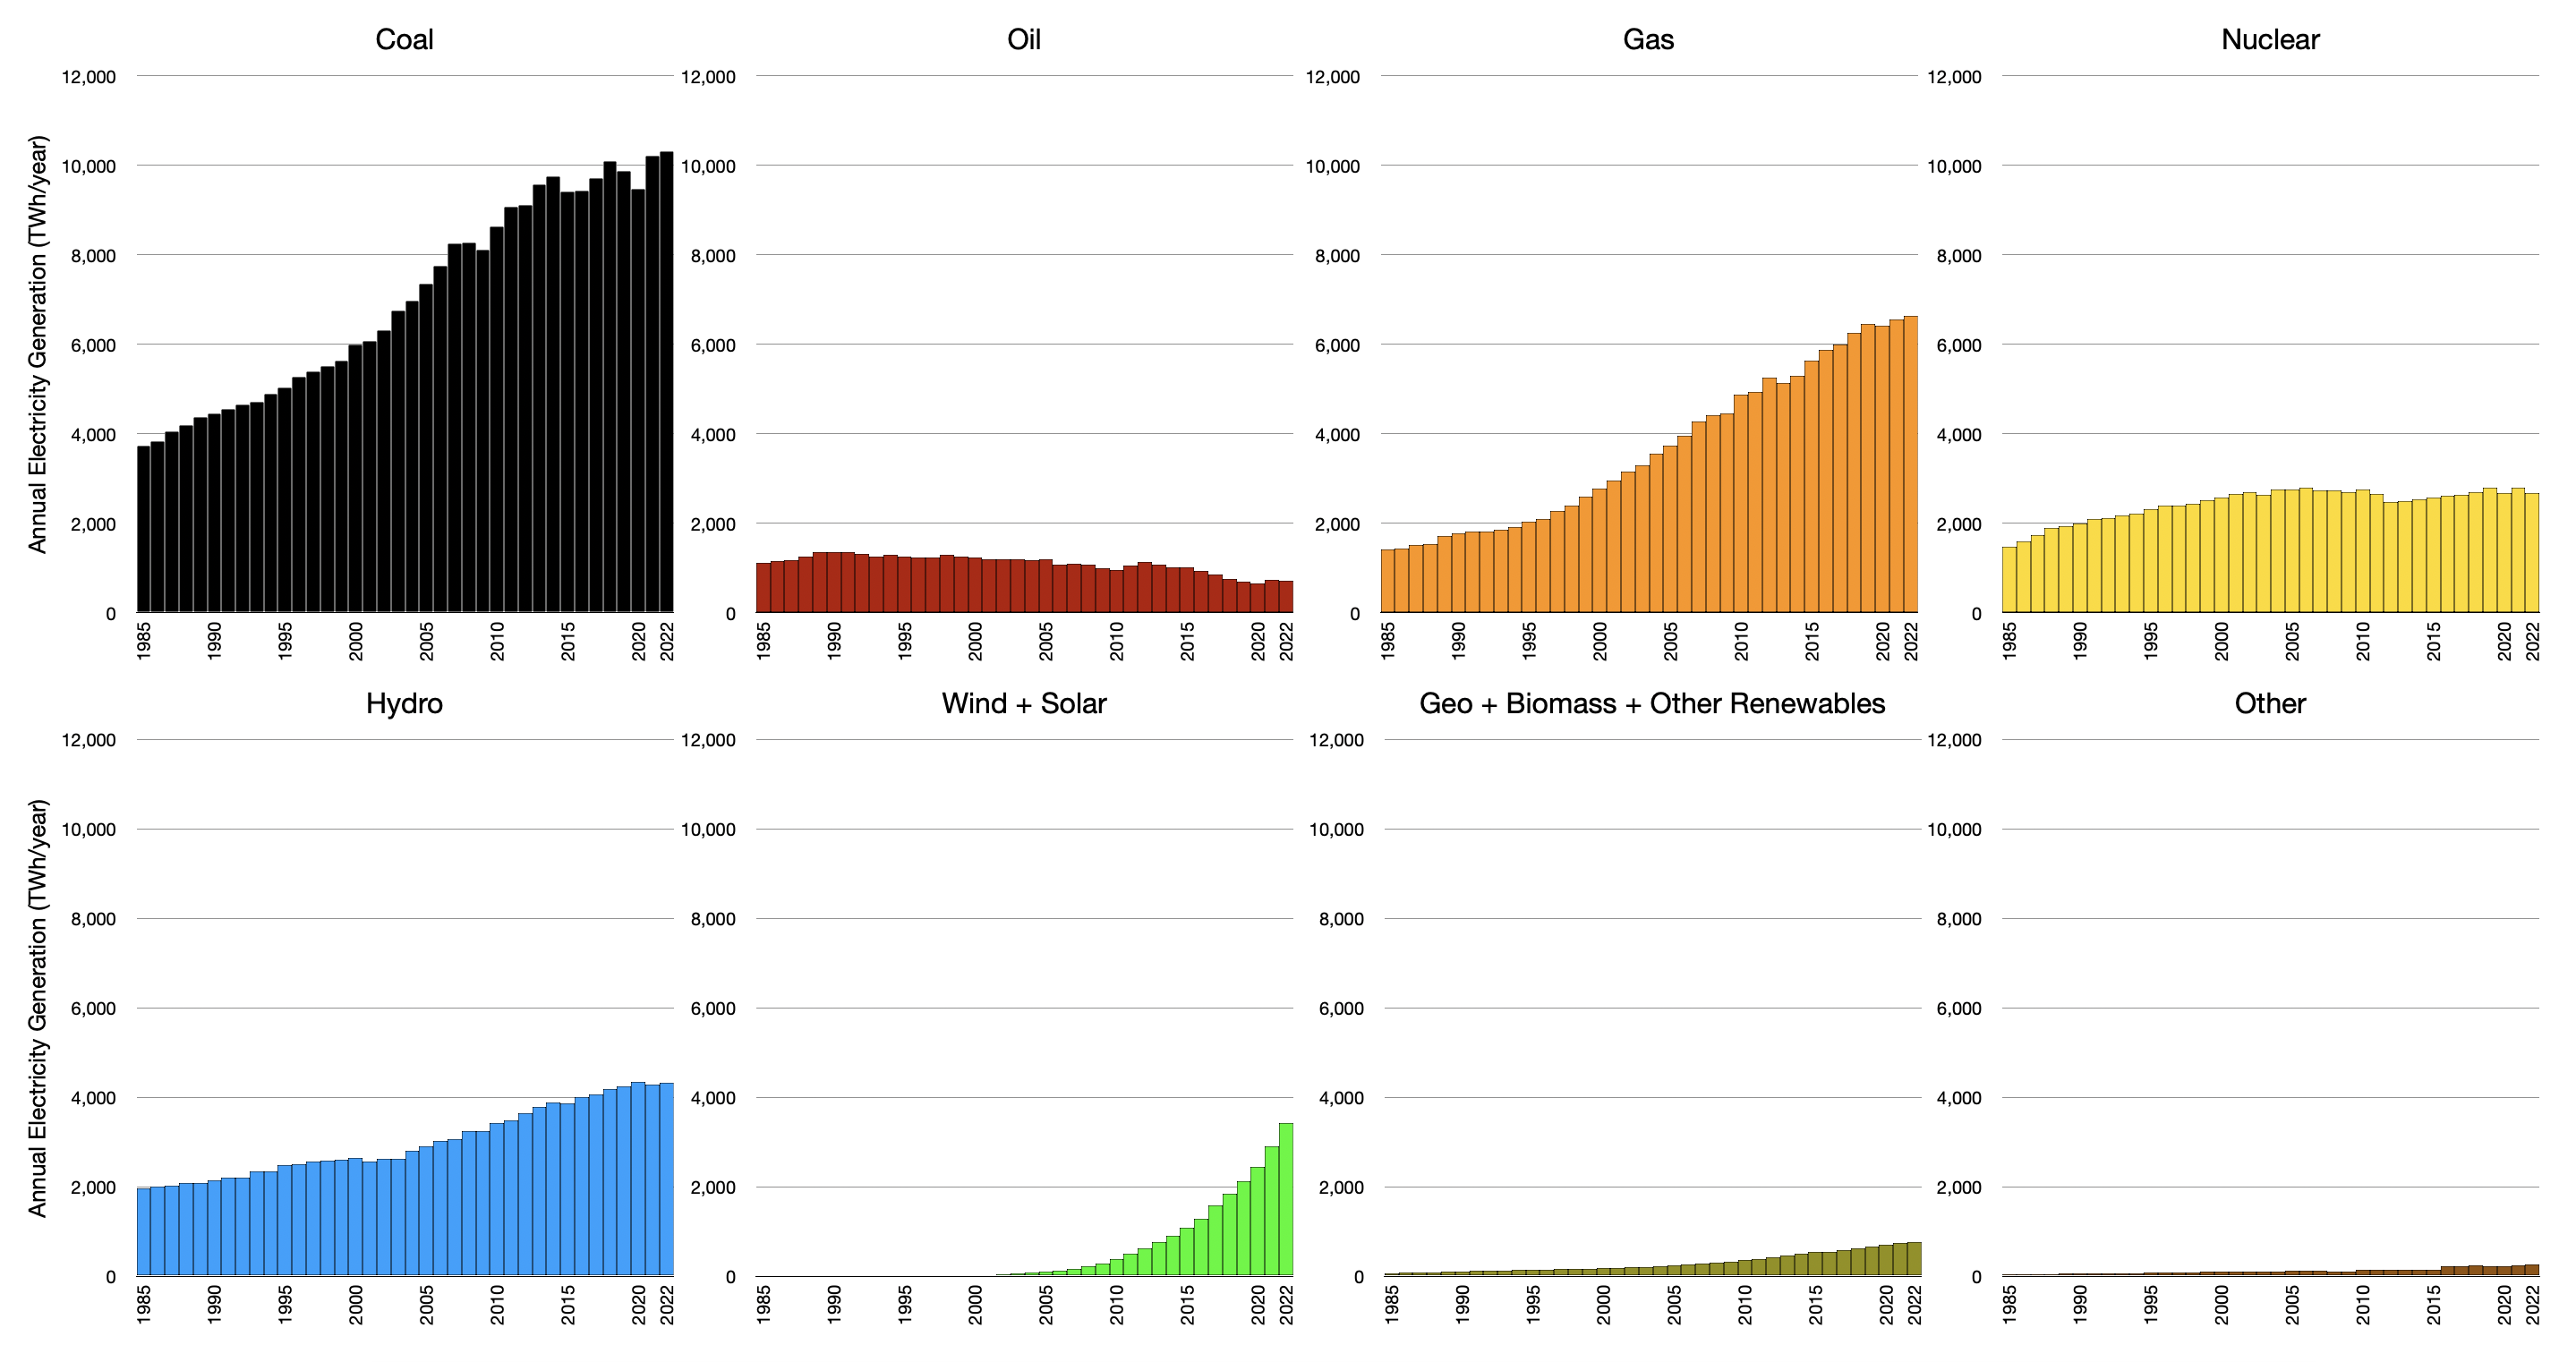
Chart 5. Annual world electricity generation, by category. Data: Energy Institute Statistical Review of World Energy 20231. For clarity, categories ‘Geo, Biomass and Other renewables’ and ‘Other’ are not shown.Chart 6. Annual world electricity generation, by fuel. Data: Energy Institute Statistical Review of World Energy 20231.
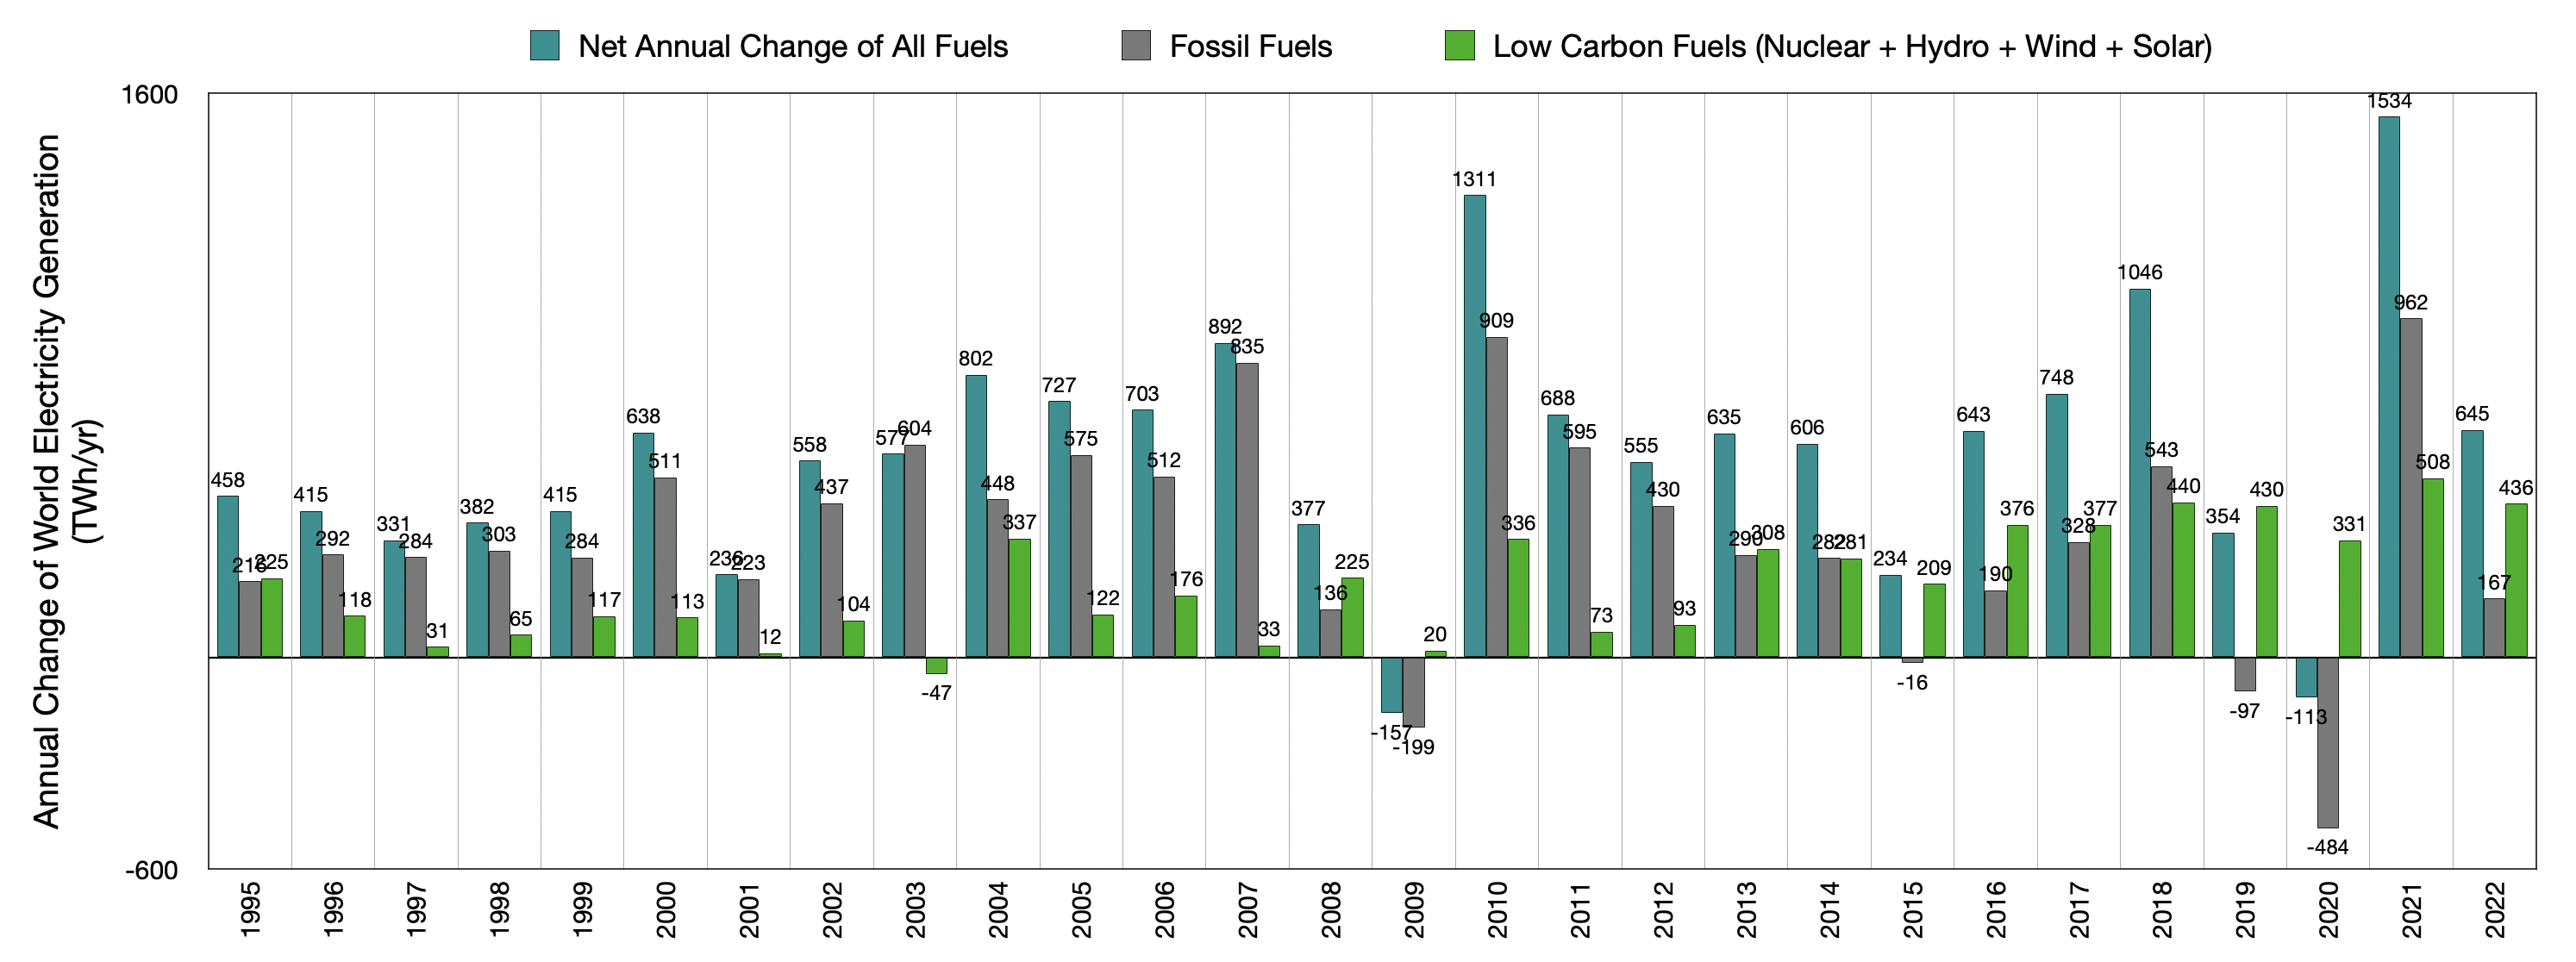
Annual additions & subtractions
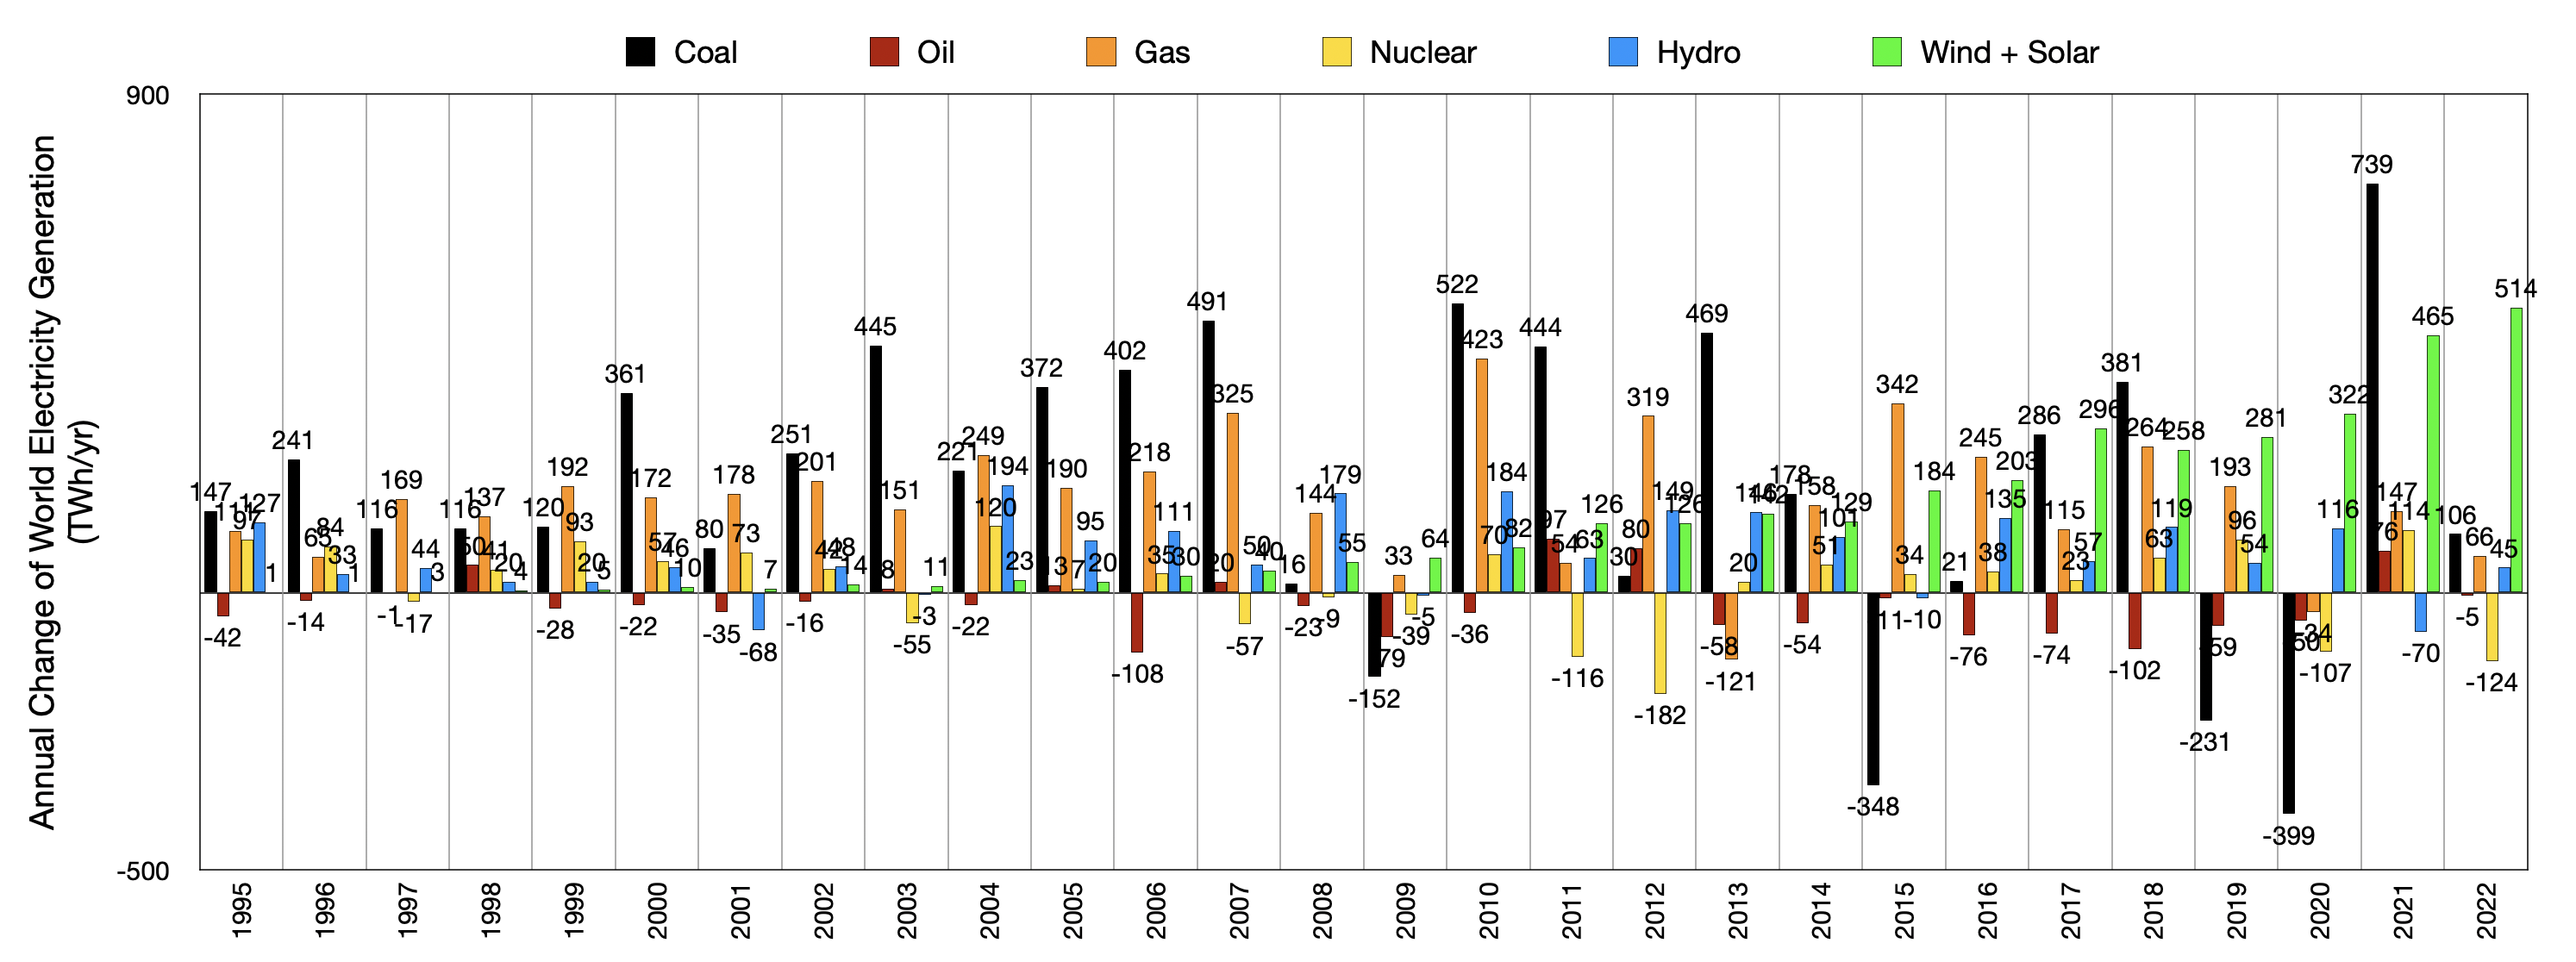
Chart 7. Annual change of world electricity generation, by category. Data: Energy Institute Statistical Review of World Energy 20231. For clarity, categories ‘Geo, Biomass and Other renewables’ and ‘Other’ are not shown. Annual changes are shown at the top of each column, values rounded.Chart 8. Annual change of world electricity generation by fuel. Data: Energy Institute Statistical Review of World Energy 20231. For clarity, categories ‘Geo, Biomass and Other renewables’ and ‘Other’ are not shown. Annual changes are shown at the top of each column, values rounded.