Updated December 2023.
Fossil Fuel Production & Consumption
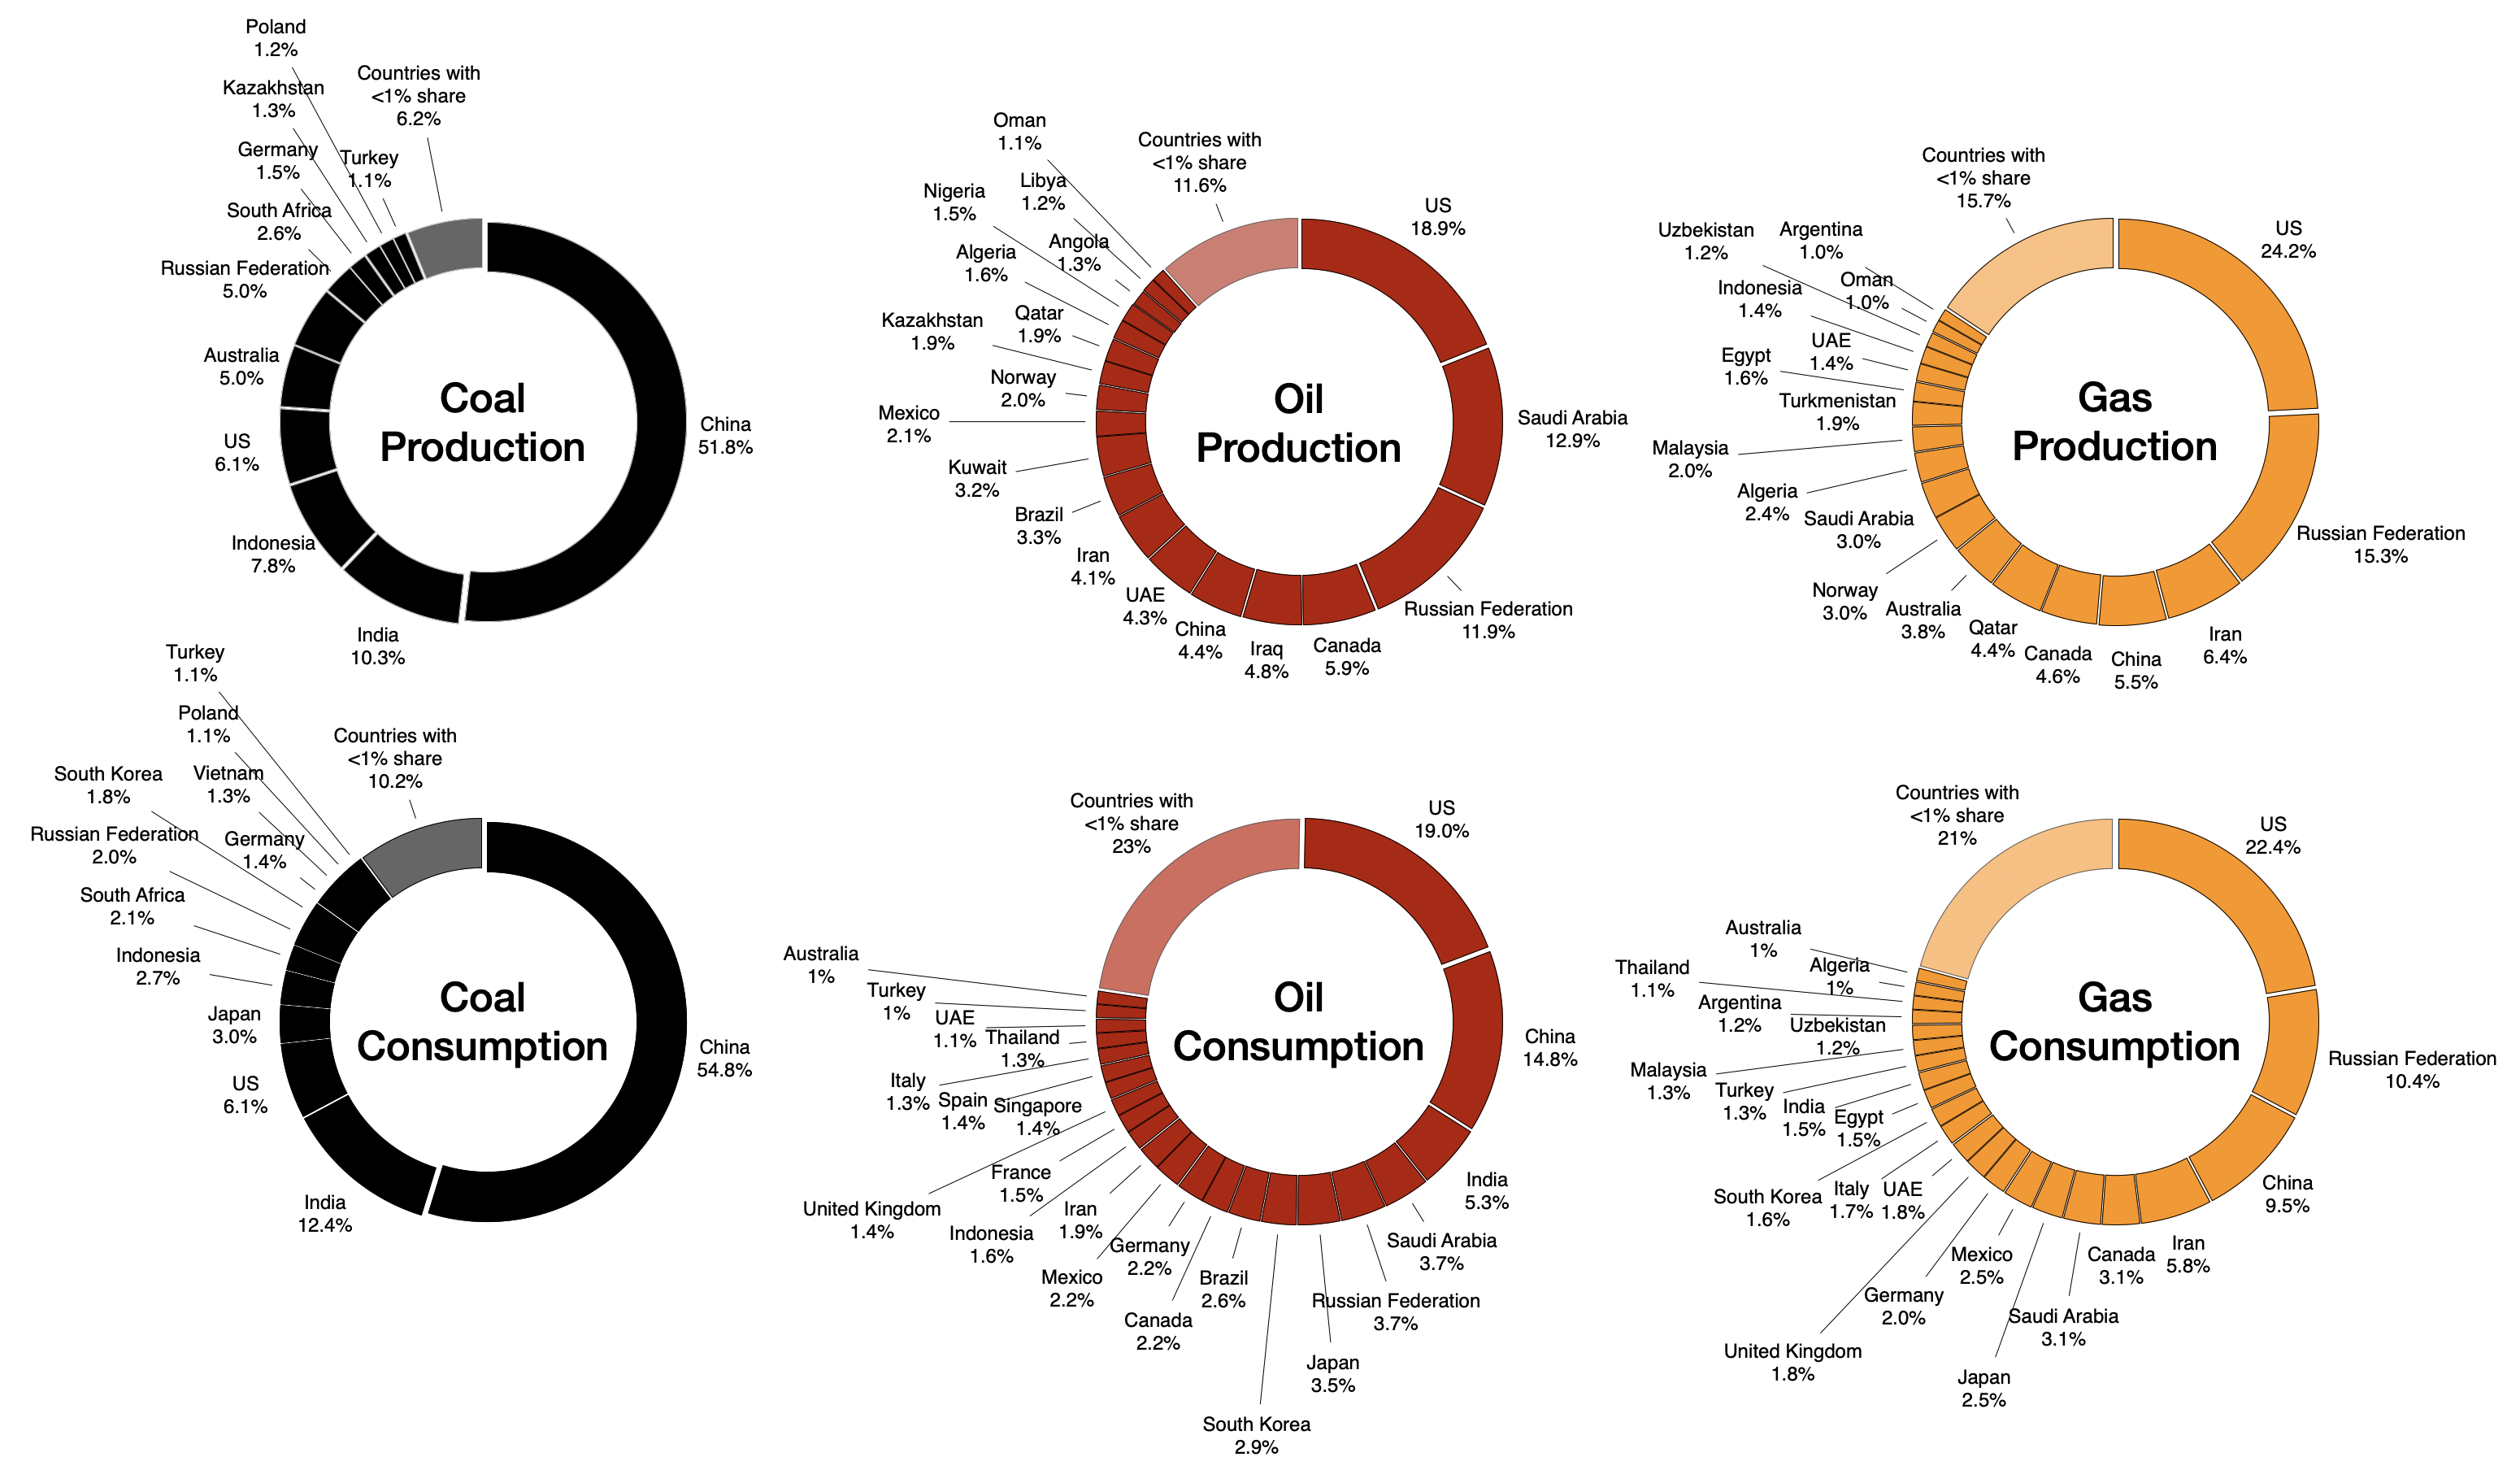
Nine countries produced a 5% or greater share of a fossil fuel in 2022 – China, India, Indonesia, the USA, Australia, Russia, Saudi Arabia, Canada, and Iran.
Territorial Fossil Fuel CO2 Emissions
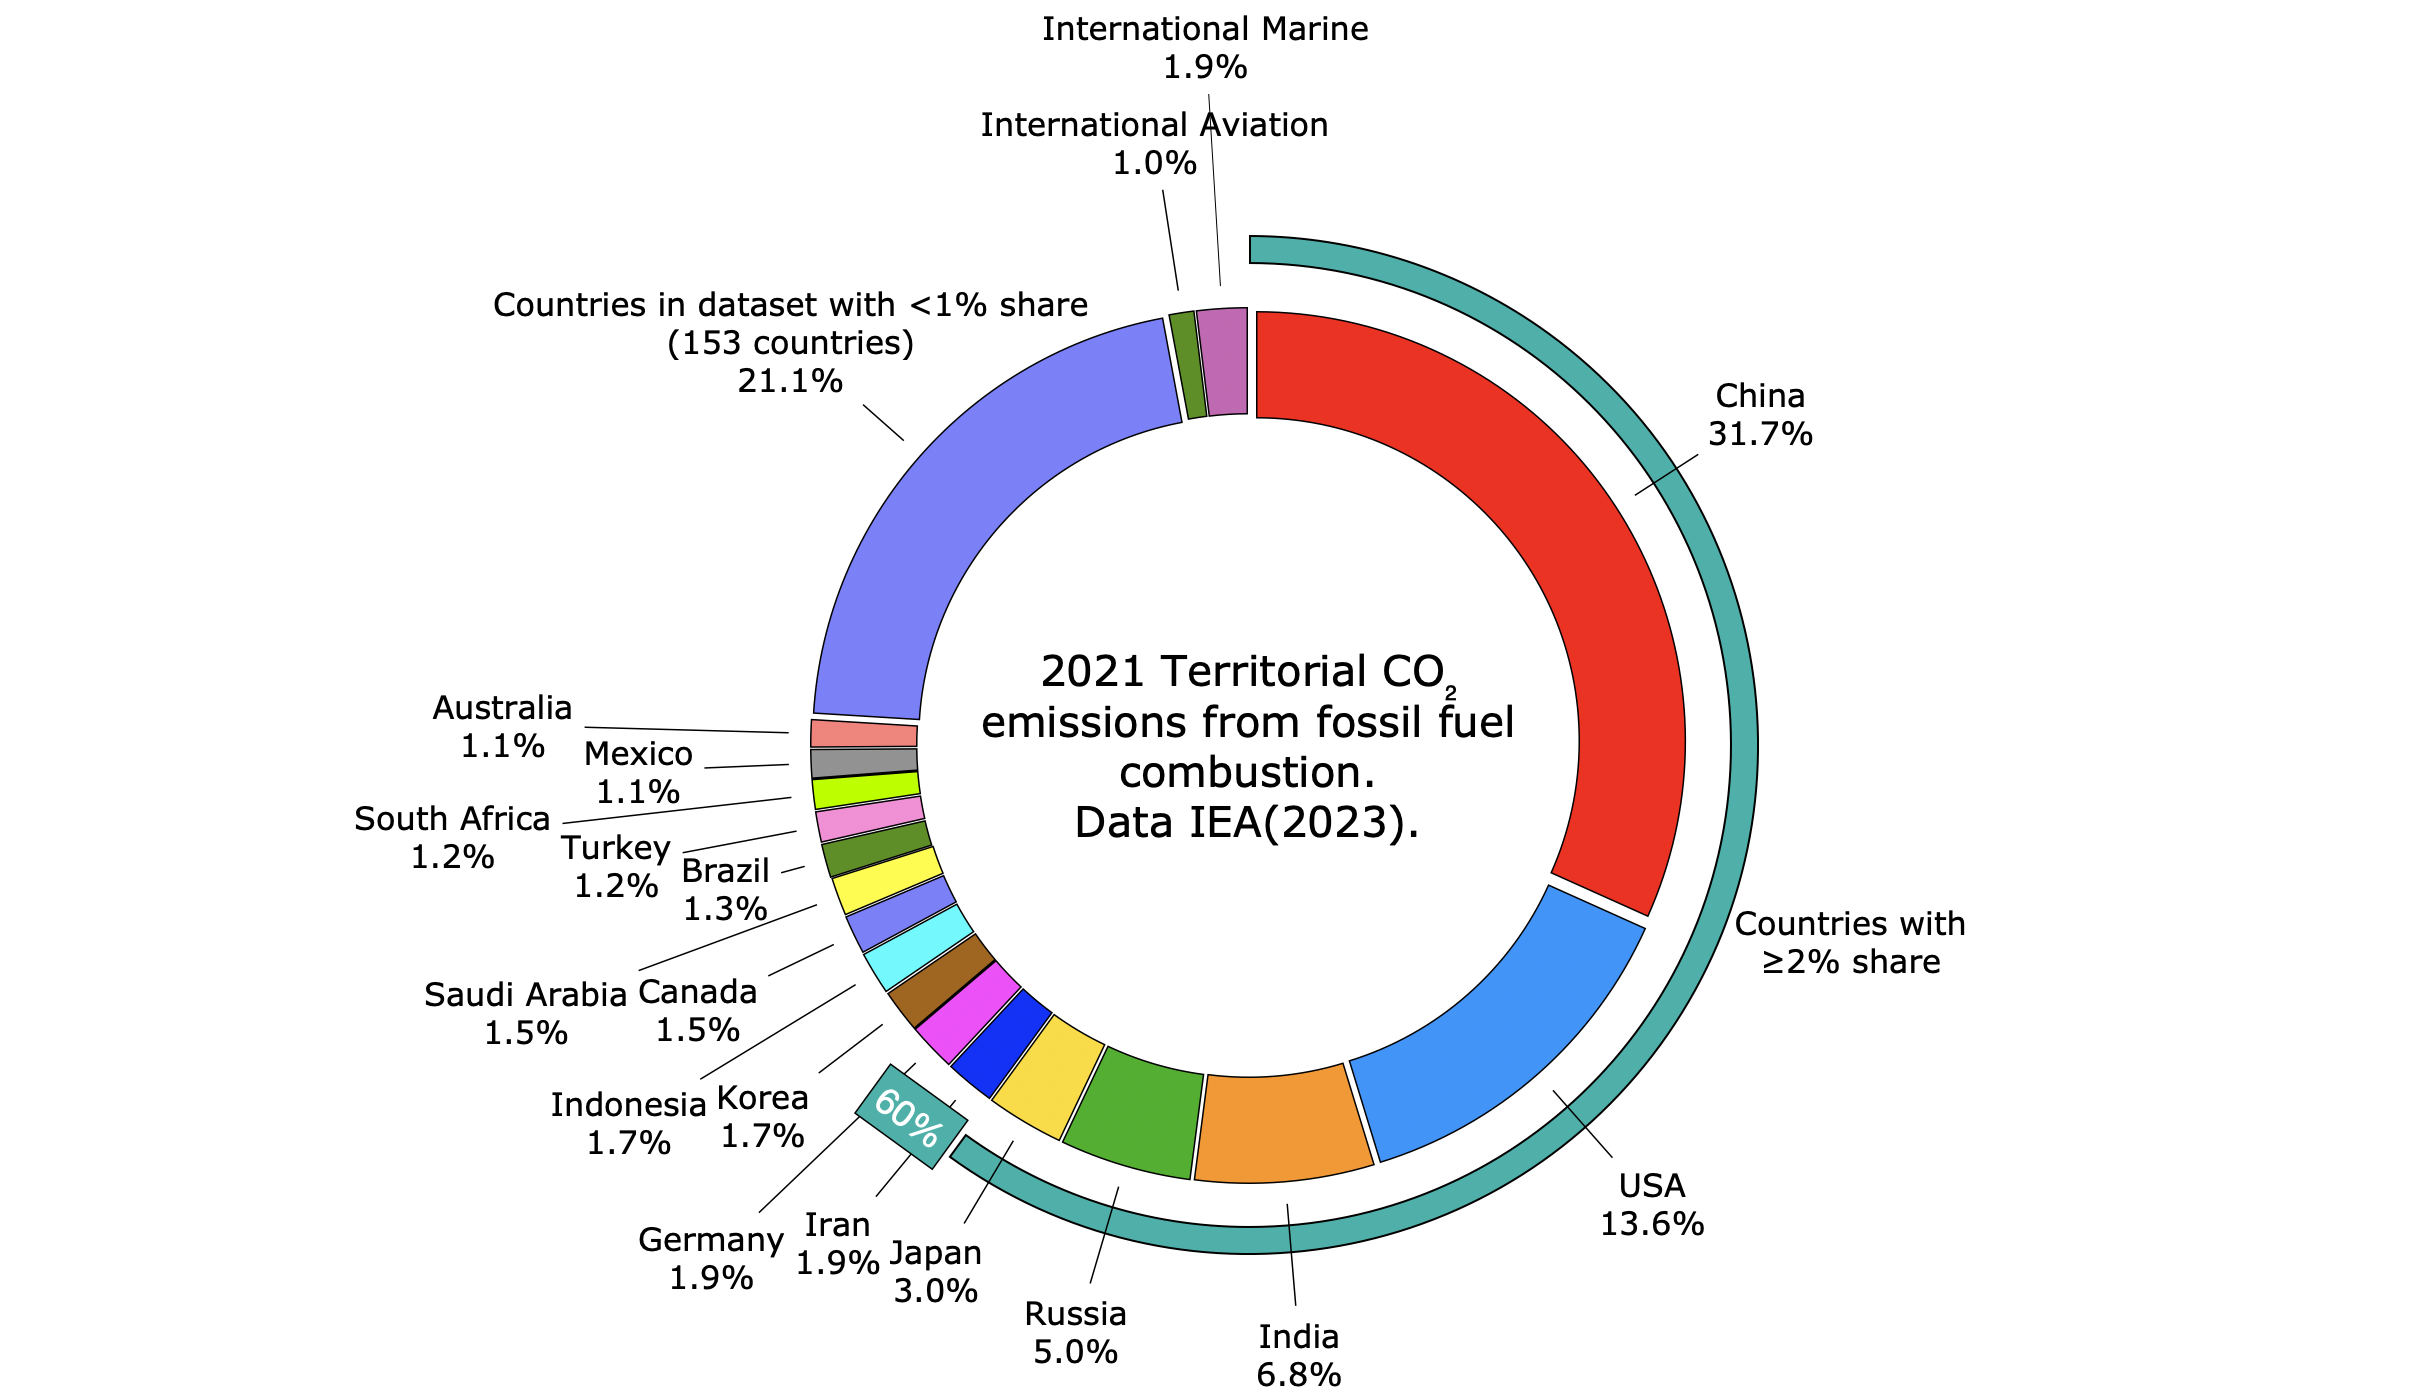
Only two countries emitted 45%5 of global CO2 from the combustion of fossil fuels in 2021 – China, and the USA.
Five countries emitted 60% – China, the USA, India, Russia, and Japan.
The above two charts show the following ten countries were responsible for a 5% or greater annual share of production of a fossil fuel, and or a 2% or greater annual share of CO2 emissions from fossil fuel combustion, accounting for 60% of the global total –
- China
- the USA
- India
- Indonesia
- Australia
- Russia
- Saudi Arabia
- Canada
- Iran
- Japan
Sector Fossil Fuel CO2 Emissions
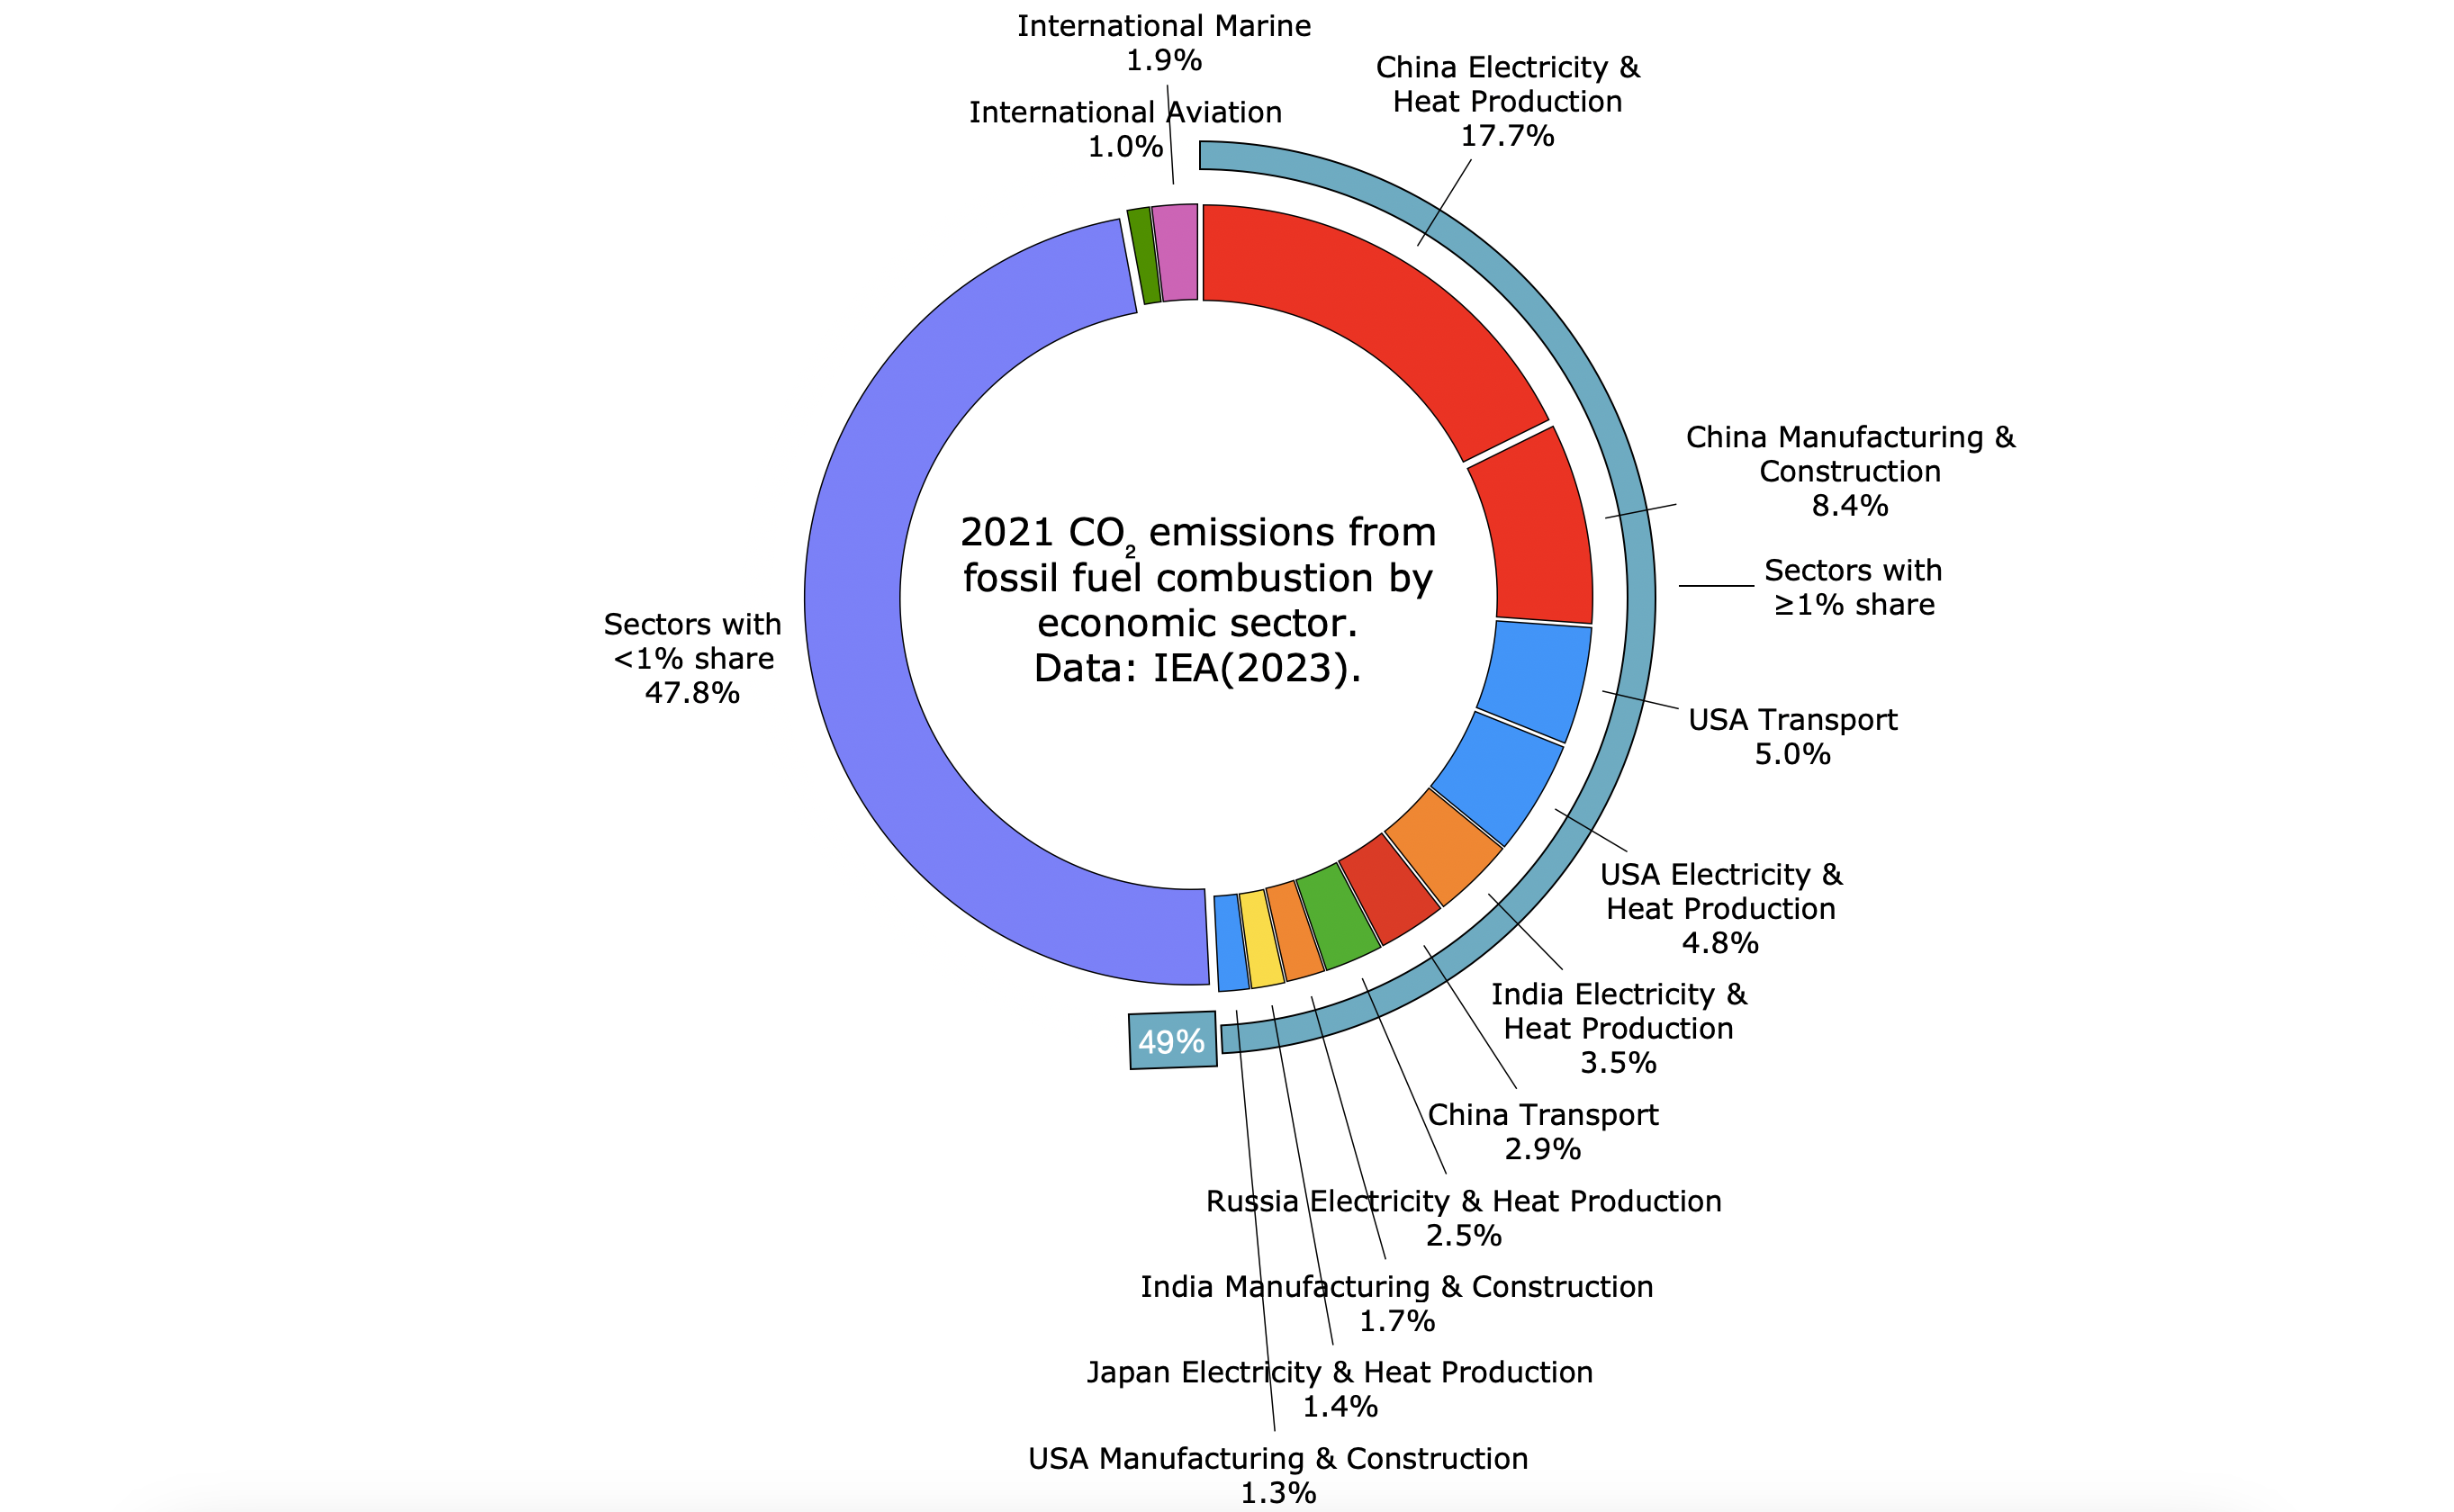
Economic sectors within five countries accounted for about half of CO2 emissions from combustion of fossil fuels in 2021 – China, the USA, India, Russia, and Japan.
The share of CO2 emissions by transport in the USA (5% of global share) is greater than the share of national emissions of all other countries excluding China, India and Russia.
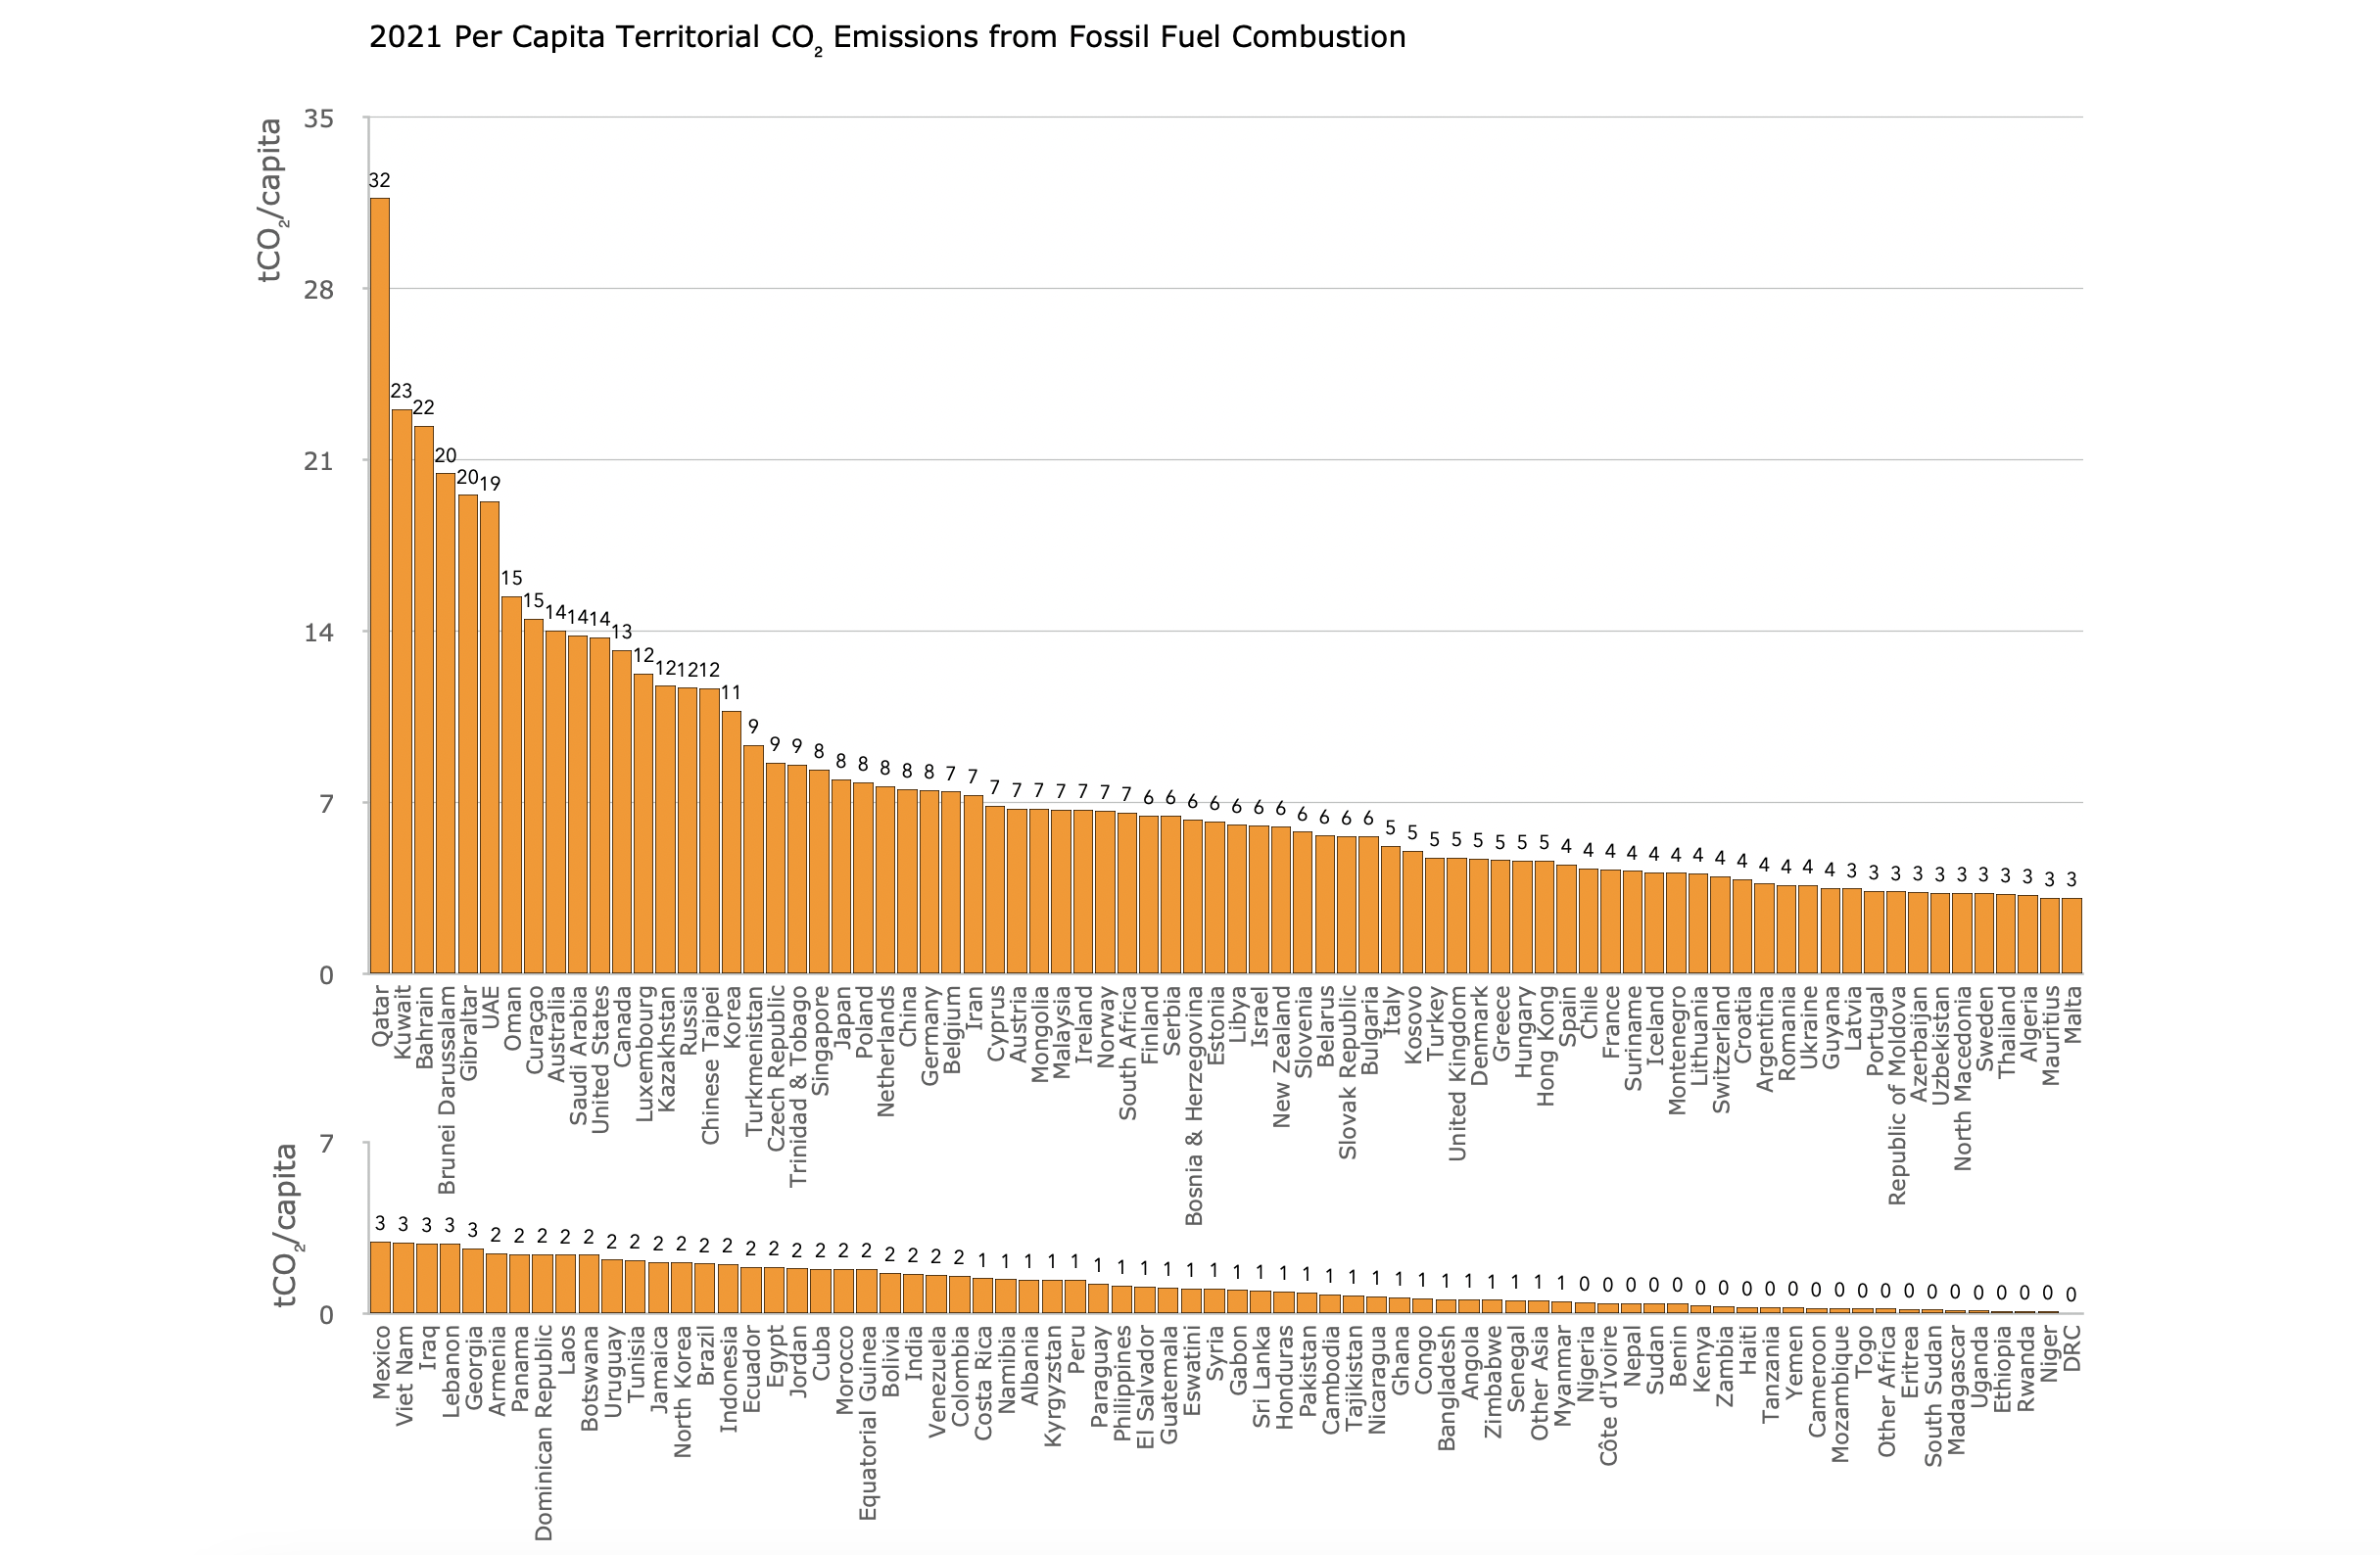
Per Capita Fossil Fuel CO2 Emissions by Territory
Per Capita Fossil Fuel Production by Territory
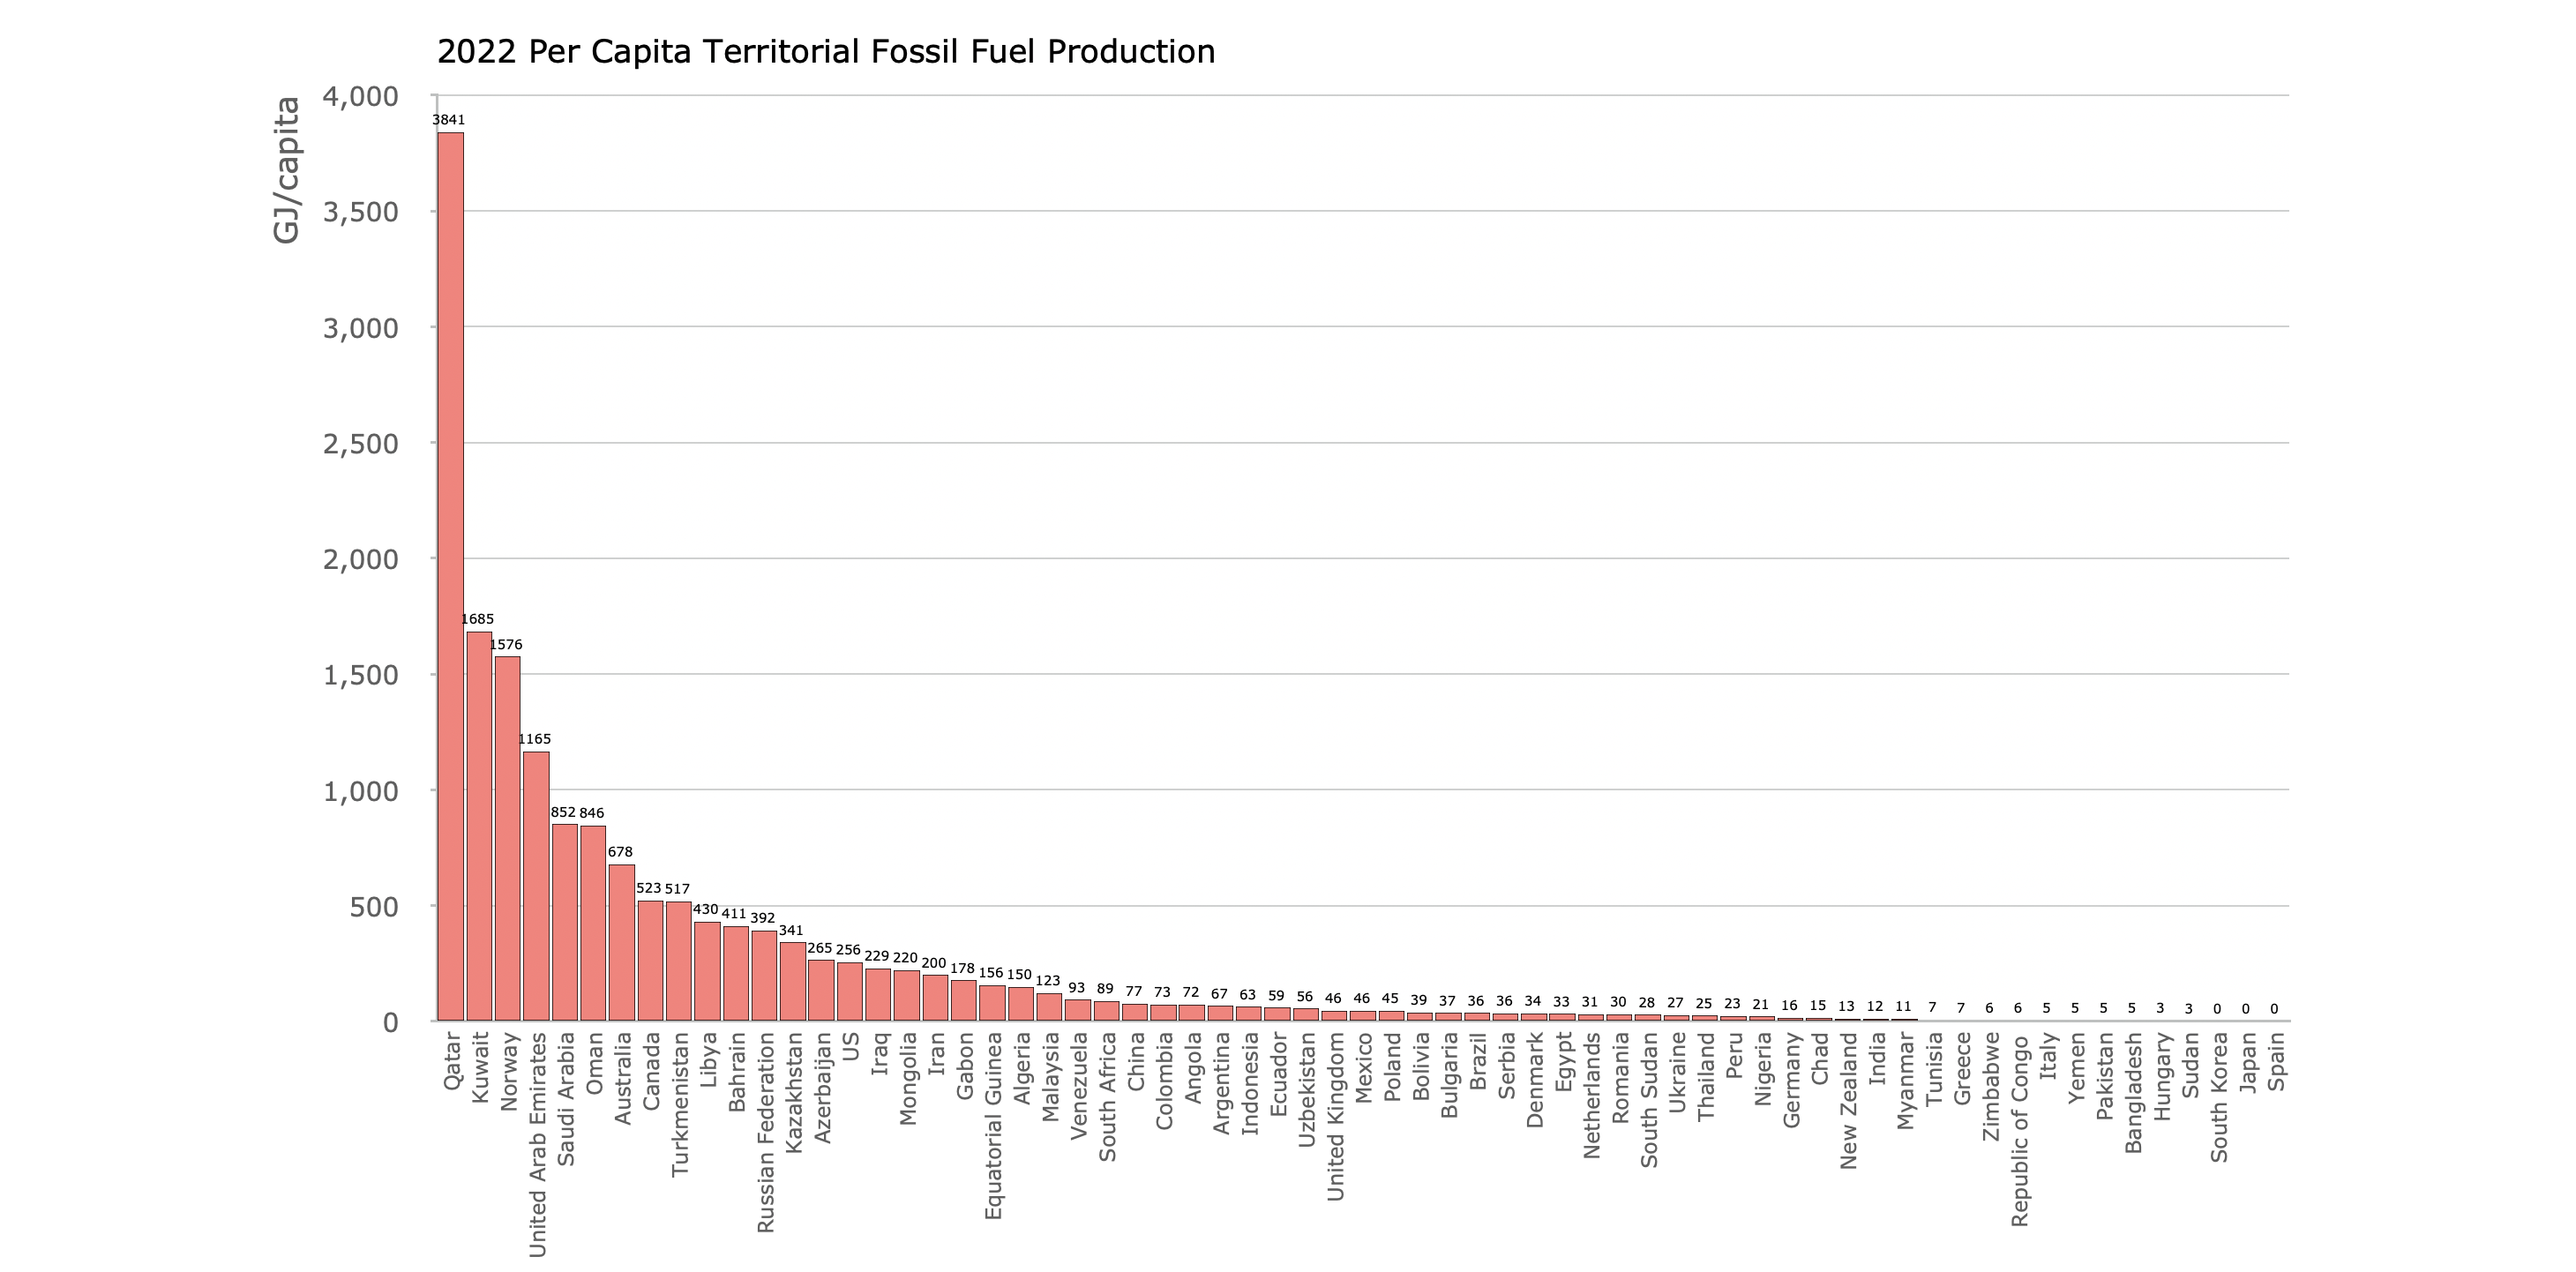
All producing countries are shown and all produce at least one fossil fuel (64 in total, of the 200 listed by the UN World Population Dashboard). Any country not shown is not a fossil fuel producer.
Not all produced oil and gas is combusted for energy; around 15% of oil and 5% of gas is not combusted, but these shares still produce about 20% of the CO₂ emissions that are produced by the combusted shares6.
Data: Energy Institute Statistical Review of World Energy 20231 and the United Nations Population Fund World Population Dashboard7.
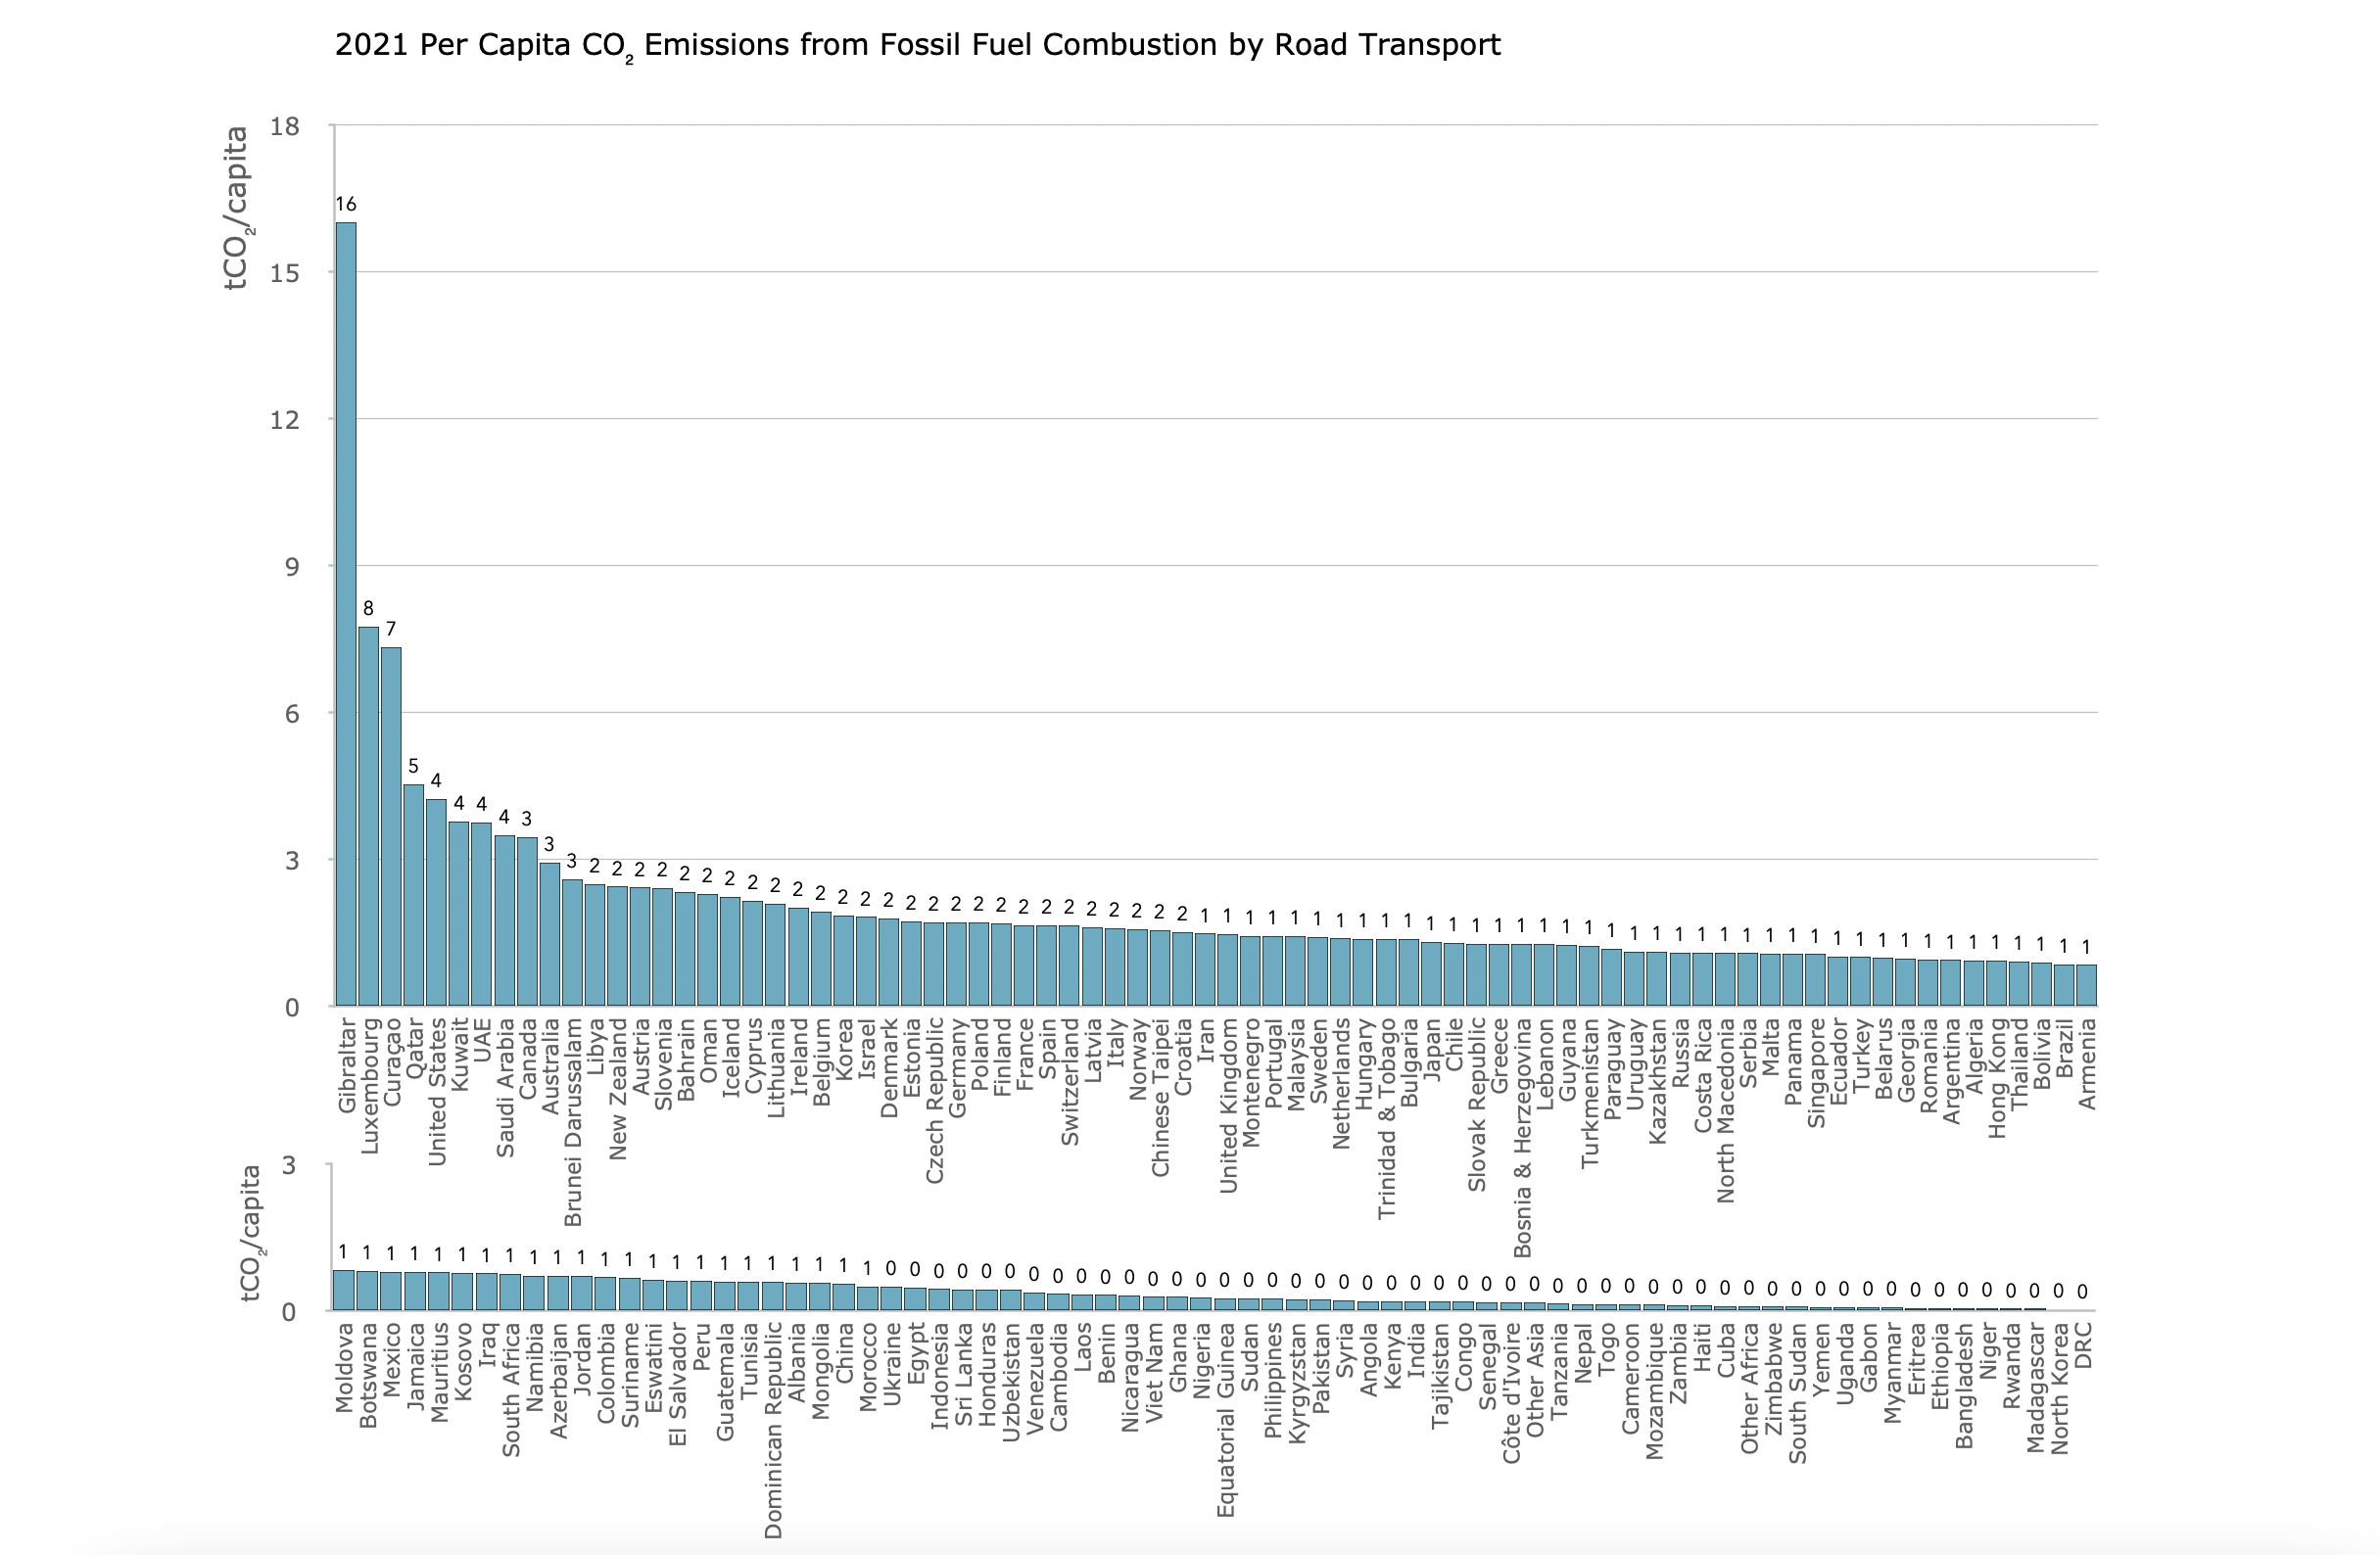
Per Capita CO2 Emissions from Road Transport
- https://www.energyinst.org/statistical-review/about[↩][↩]
- Sheets used were ‘Coal Production – Tonnes’, ‘Oil Production -Barrels’ and ‘Gas Production – Bcm’.[↩]
- Excludes fugitive emissions due to fossil fuel production.[↩][↩][↩]
- https://www.iea.org/data-and-statistics/data-product/greenhouse-gas-emissions-from-energy-highlights[↩][↩][↩][↩]
- 31.7+13.6 = 45.3%[↩]
- “Around 15% of oil and 5% of natural gas are used as petrochemical feedstocks and in other non-combustion processes”(p.99 https://iea.blob.core.windows.net/assets/4315f4ed-5cb2-4264-b0ee-2054fd34c118/The_Oil_and_Gas_Industry_in_Energy_Transitions.pdf). “There would still be scope 1 and 2 emissions from their extraction, processing and transport,…” (p.99 https://iea.blob.core.windows.net/assets/4315f4ed-5cb2-4264-b0ee-2054fd34c118/The_Oil_and_Gas_Industry_in_Energy_Transitions.pdf). This amounts to 19% of total CO₂ emissions per barrel-of-oil-consumed solely for combustion purposes (scope 1, 2 and 3 emissions combined) (Oil scope 1 + scope 2 CO₂ emissions: “95 kilogrammes of CO₂ equivalent (kgCO₂-eq) is emitted in bringing an average barrel of oil to end-use consumers.” Oil scope 3 CO₂ emissions: “The global average array of oil products produced from a barrel of crude oil equivalent in 2018 results in around 405 kgCO₂ when combusted.”, p.30 https://iea.blob.core.windows.net/assets/4315f4ed-5cb2-4264-b0ee-2054fd34c118/The_Oil_and_Gas_Industry_in_Energy_Transitions.pdf, 95/(95+405) = 19%) and 24% per barrel-of-oil-equivalent for gas (Gas scope 1 + scope 2 CO₂ emissions: “For natural gas, global average scope 1 and 2 emissions are around 100 kg CO2-eq/boe.”. Gas scope 3 CO₂ emissions: There is a much smaller degree of variation in CO₂ emissions from the combustion of natural gas, but on average, emissions are 320 kgCO₂/boe” p.30 https://iea.blob.core.windows.net/assets/4315f4ed-5cb2-4264-b0ee-2054fd34c118/The_Oil_and_Gas_Industry_in_Energy_Transitions.pdf, 100/(100+320) = 24%.[↩]
- https://www.unfpa.org/data/world-population-dashboard[↩]