Updated January 2024.

Global Carbon Ranking
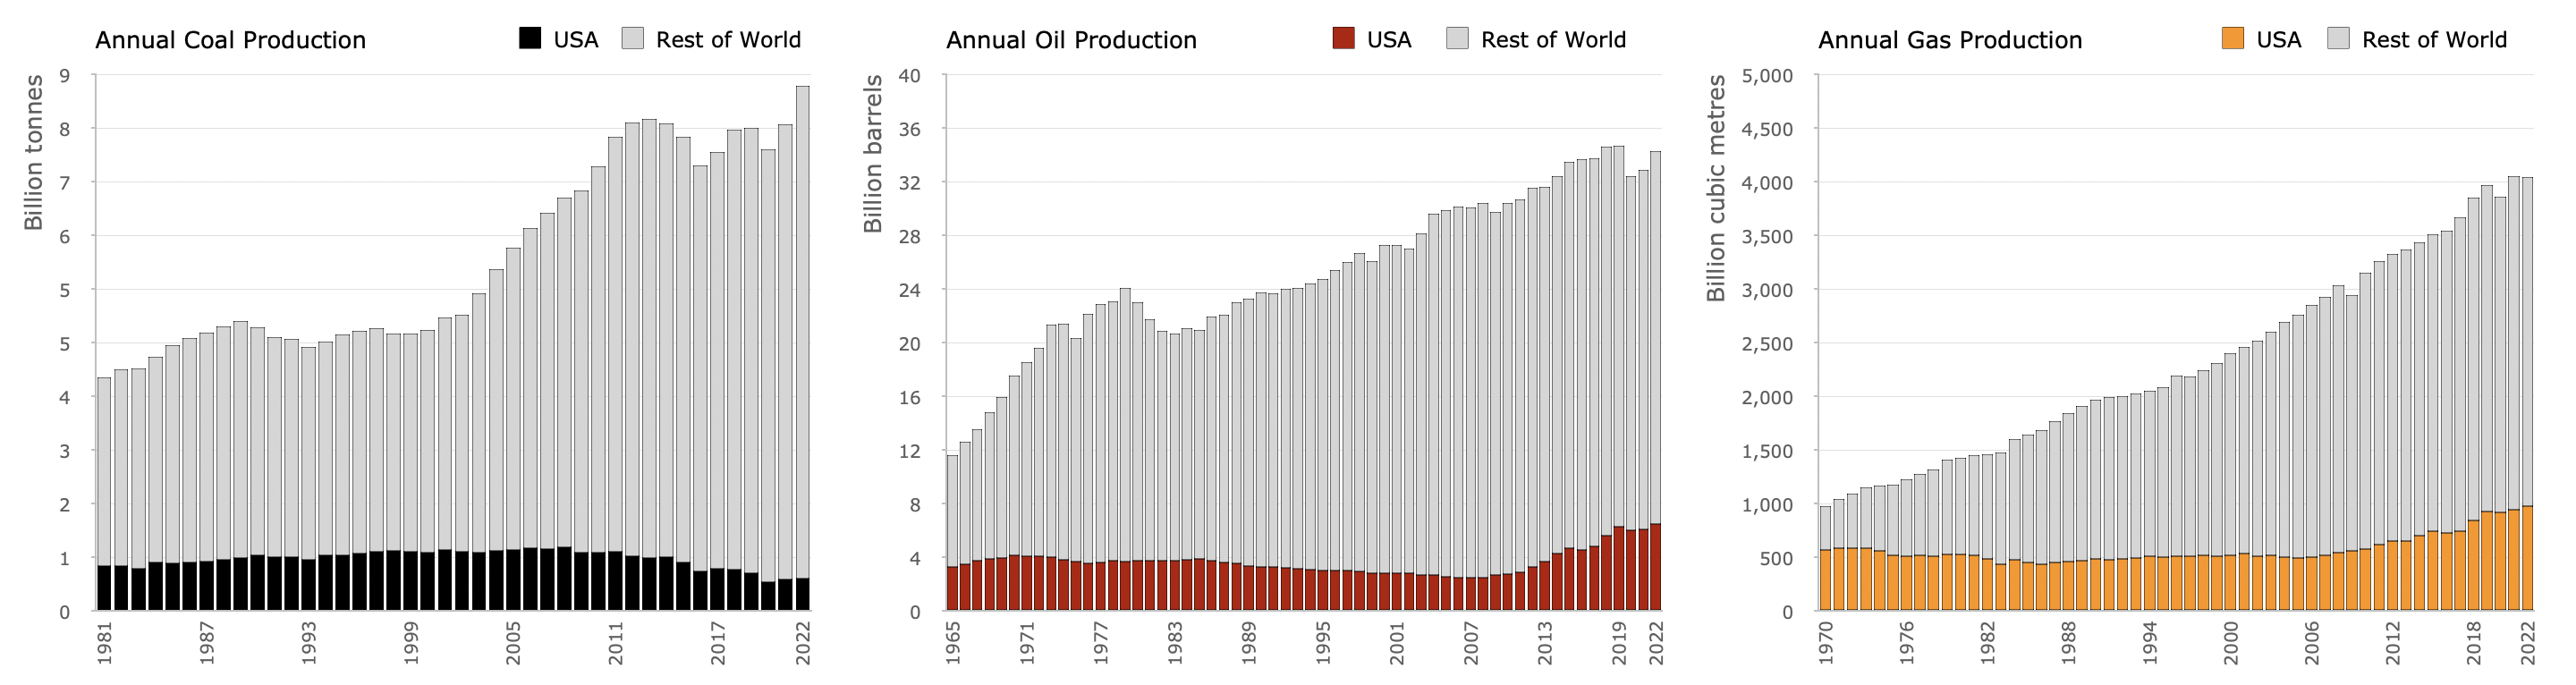
► World’s Largest oil producer2
► world’s Largest gas producer2
► 4th largest coal producer2
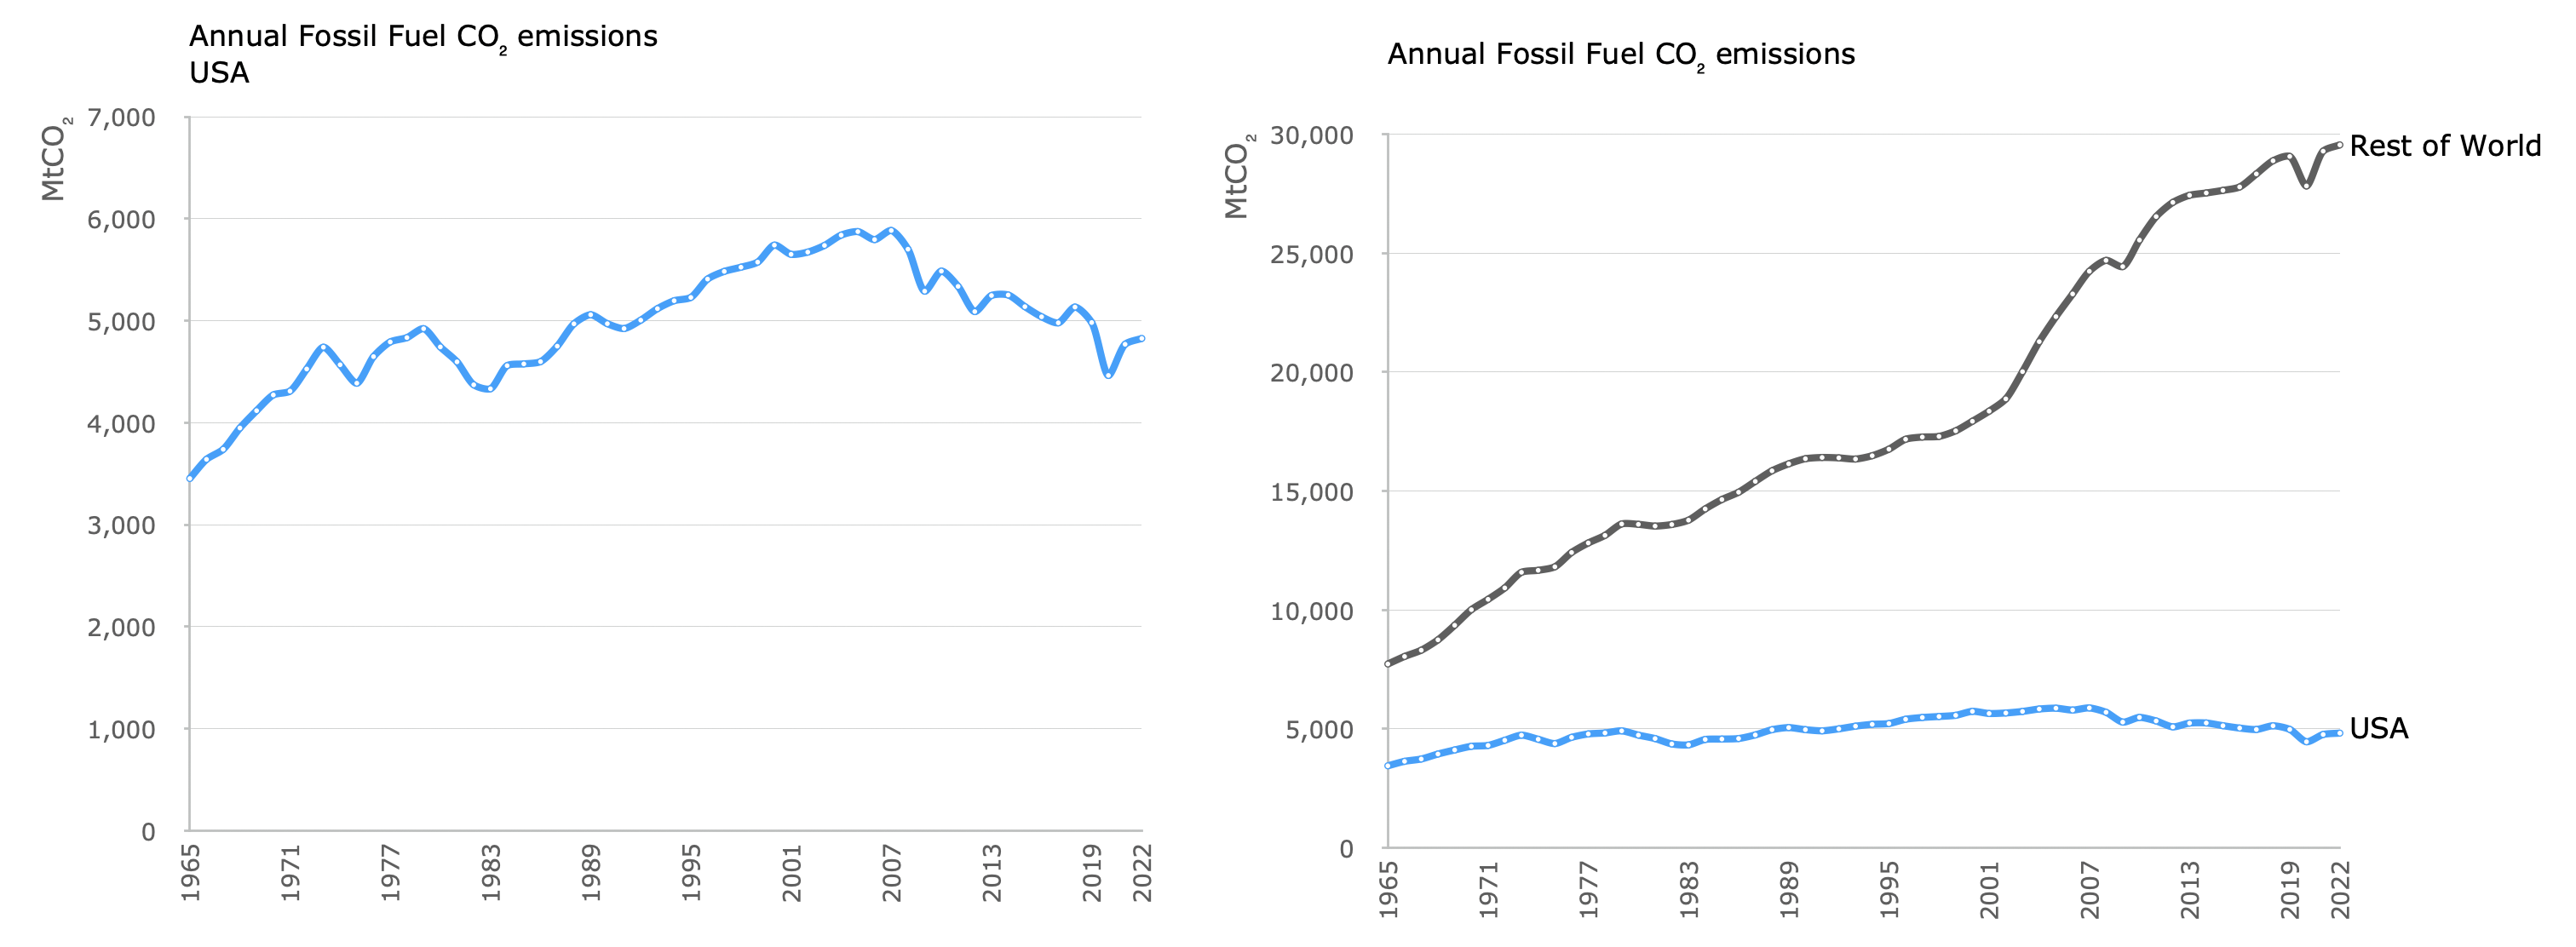
► 2nd largest CO2 emitter3
► 12th largest CO2 emitter per capita4
U.S. oil production — already the highest in the world — is on track to set a new record this year [2023], and will probably rise even more in 2024.
The U.S. is pumping oil faster than ever. Republicans don’t care.
Fossil Fuel Production
Carbon Dioxide (CO₂) Emissions
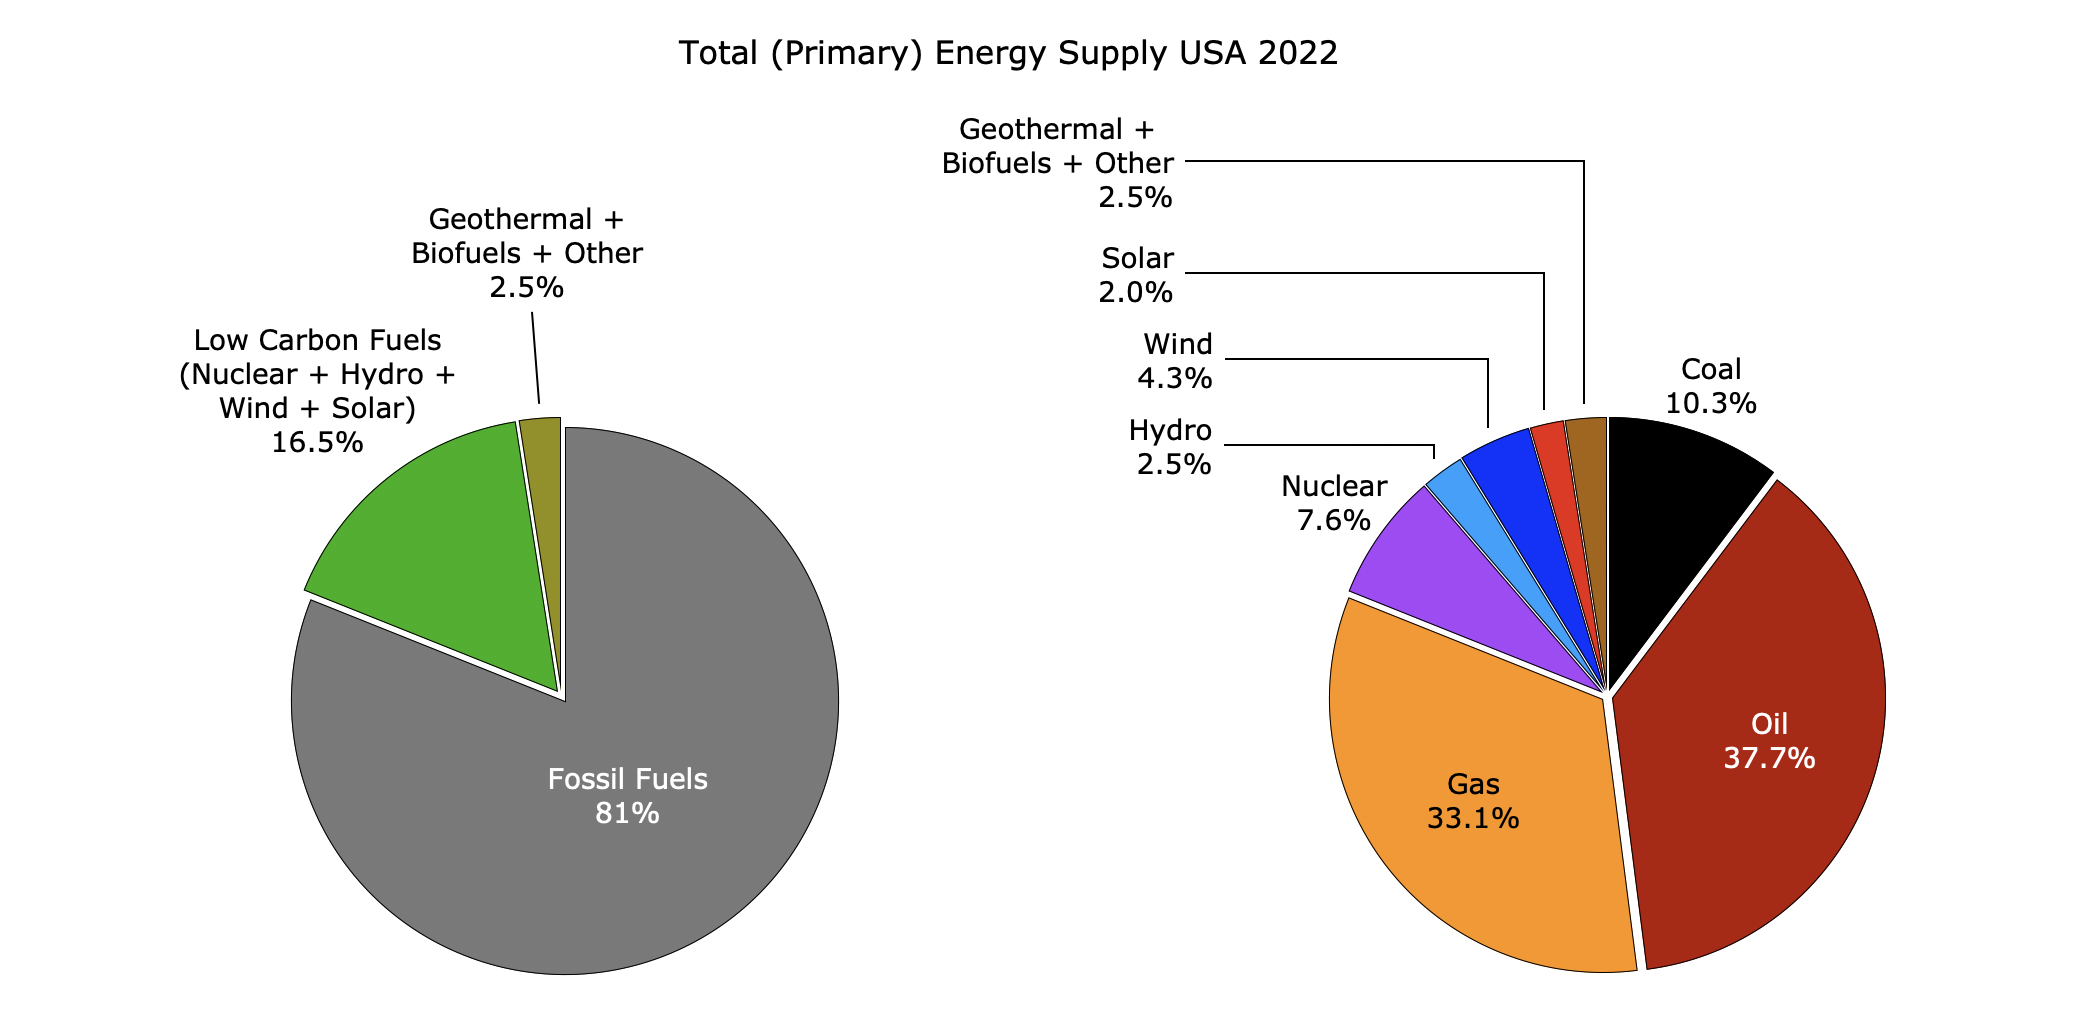
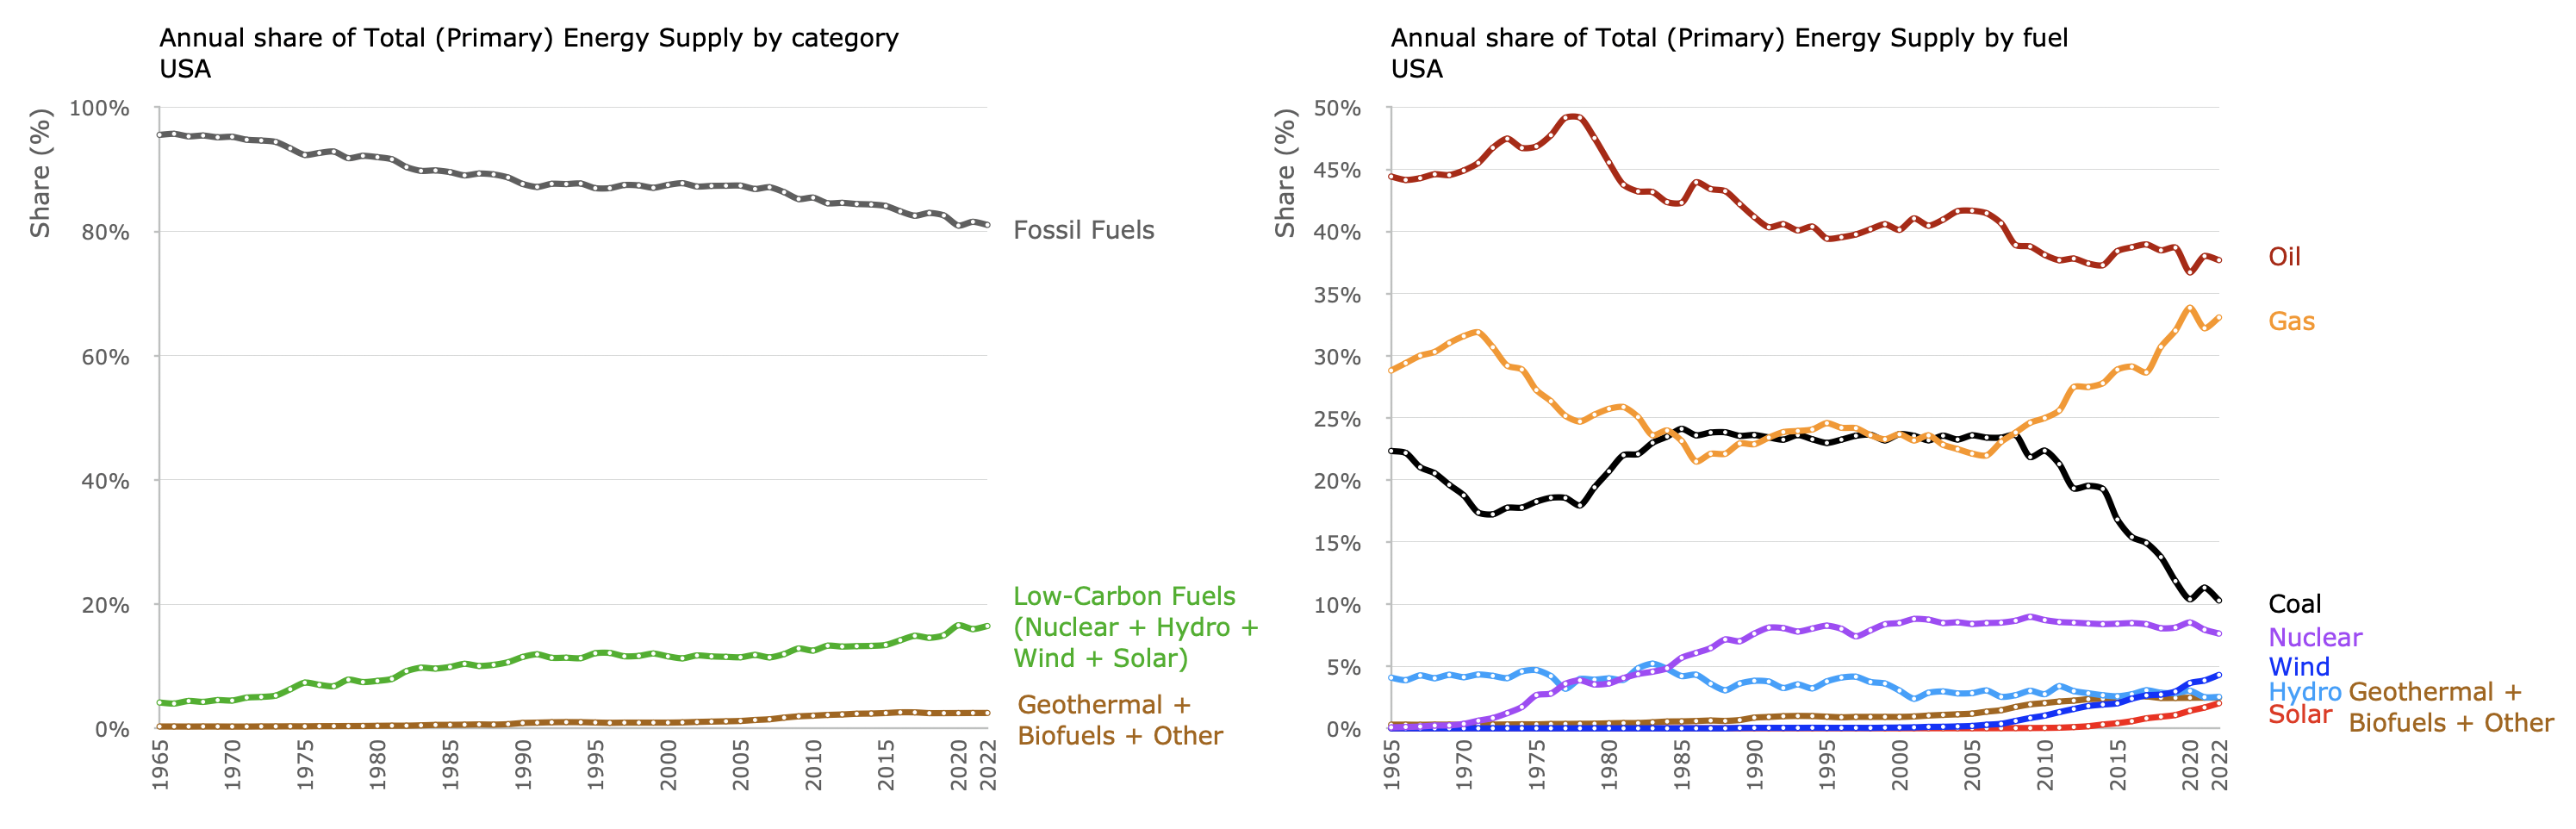
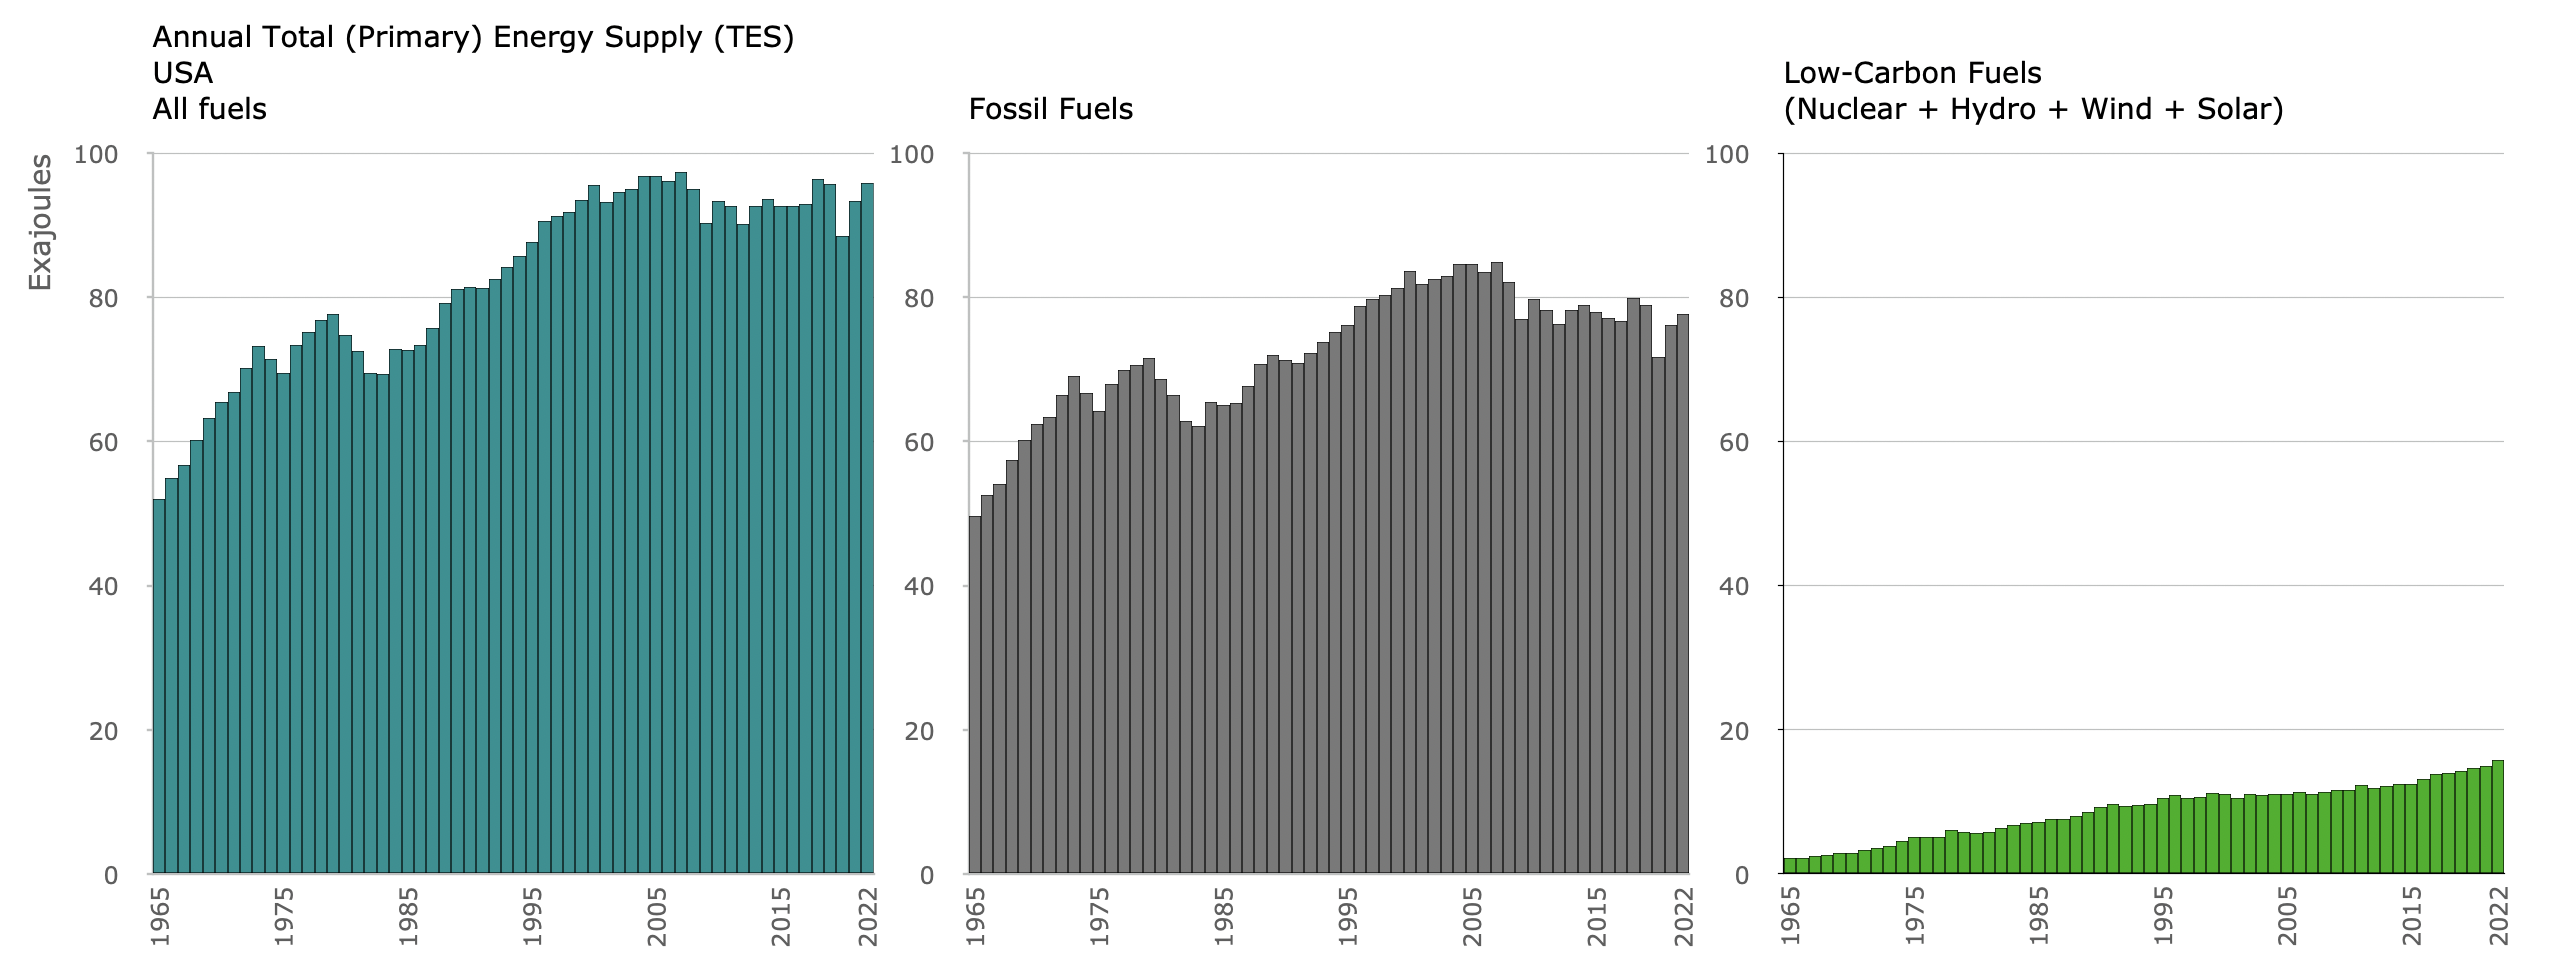
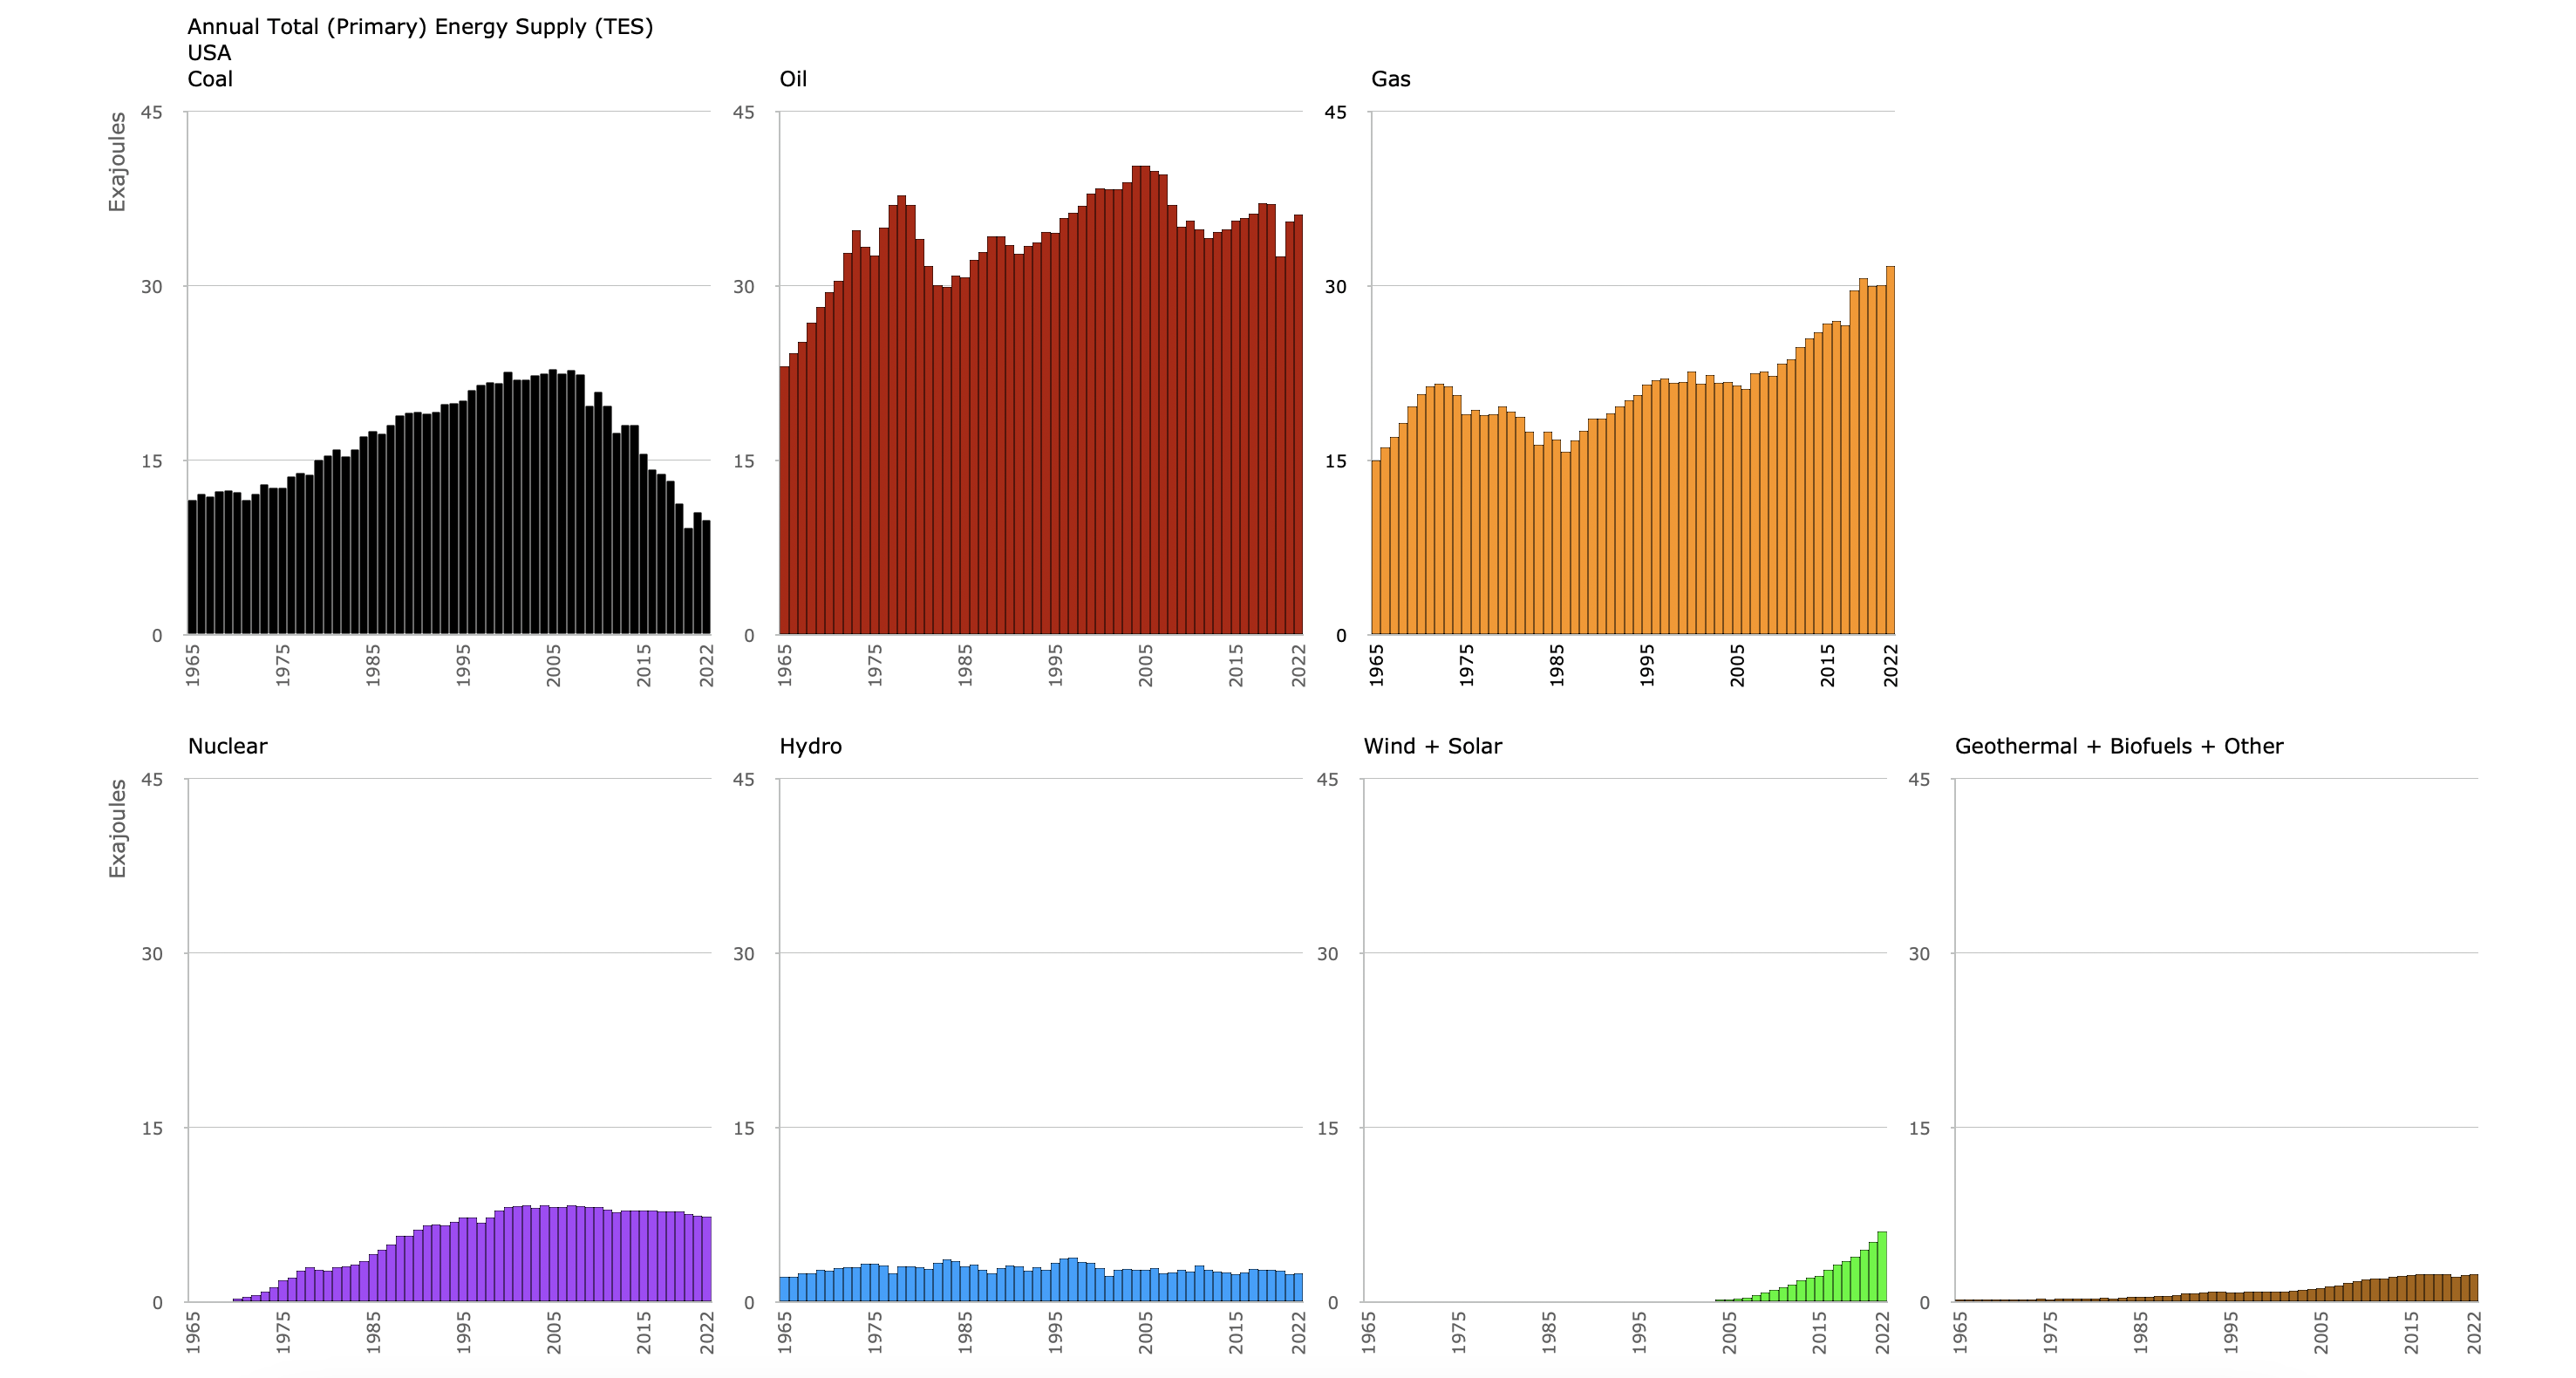
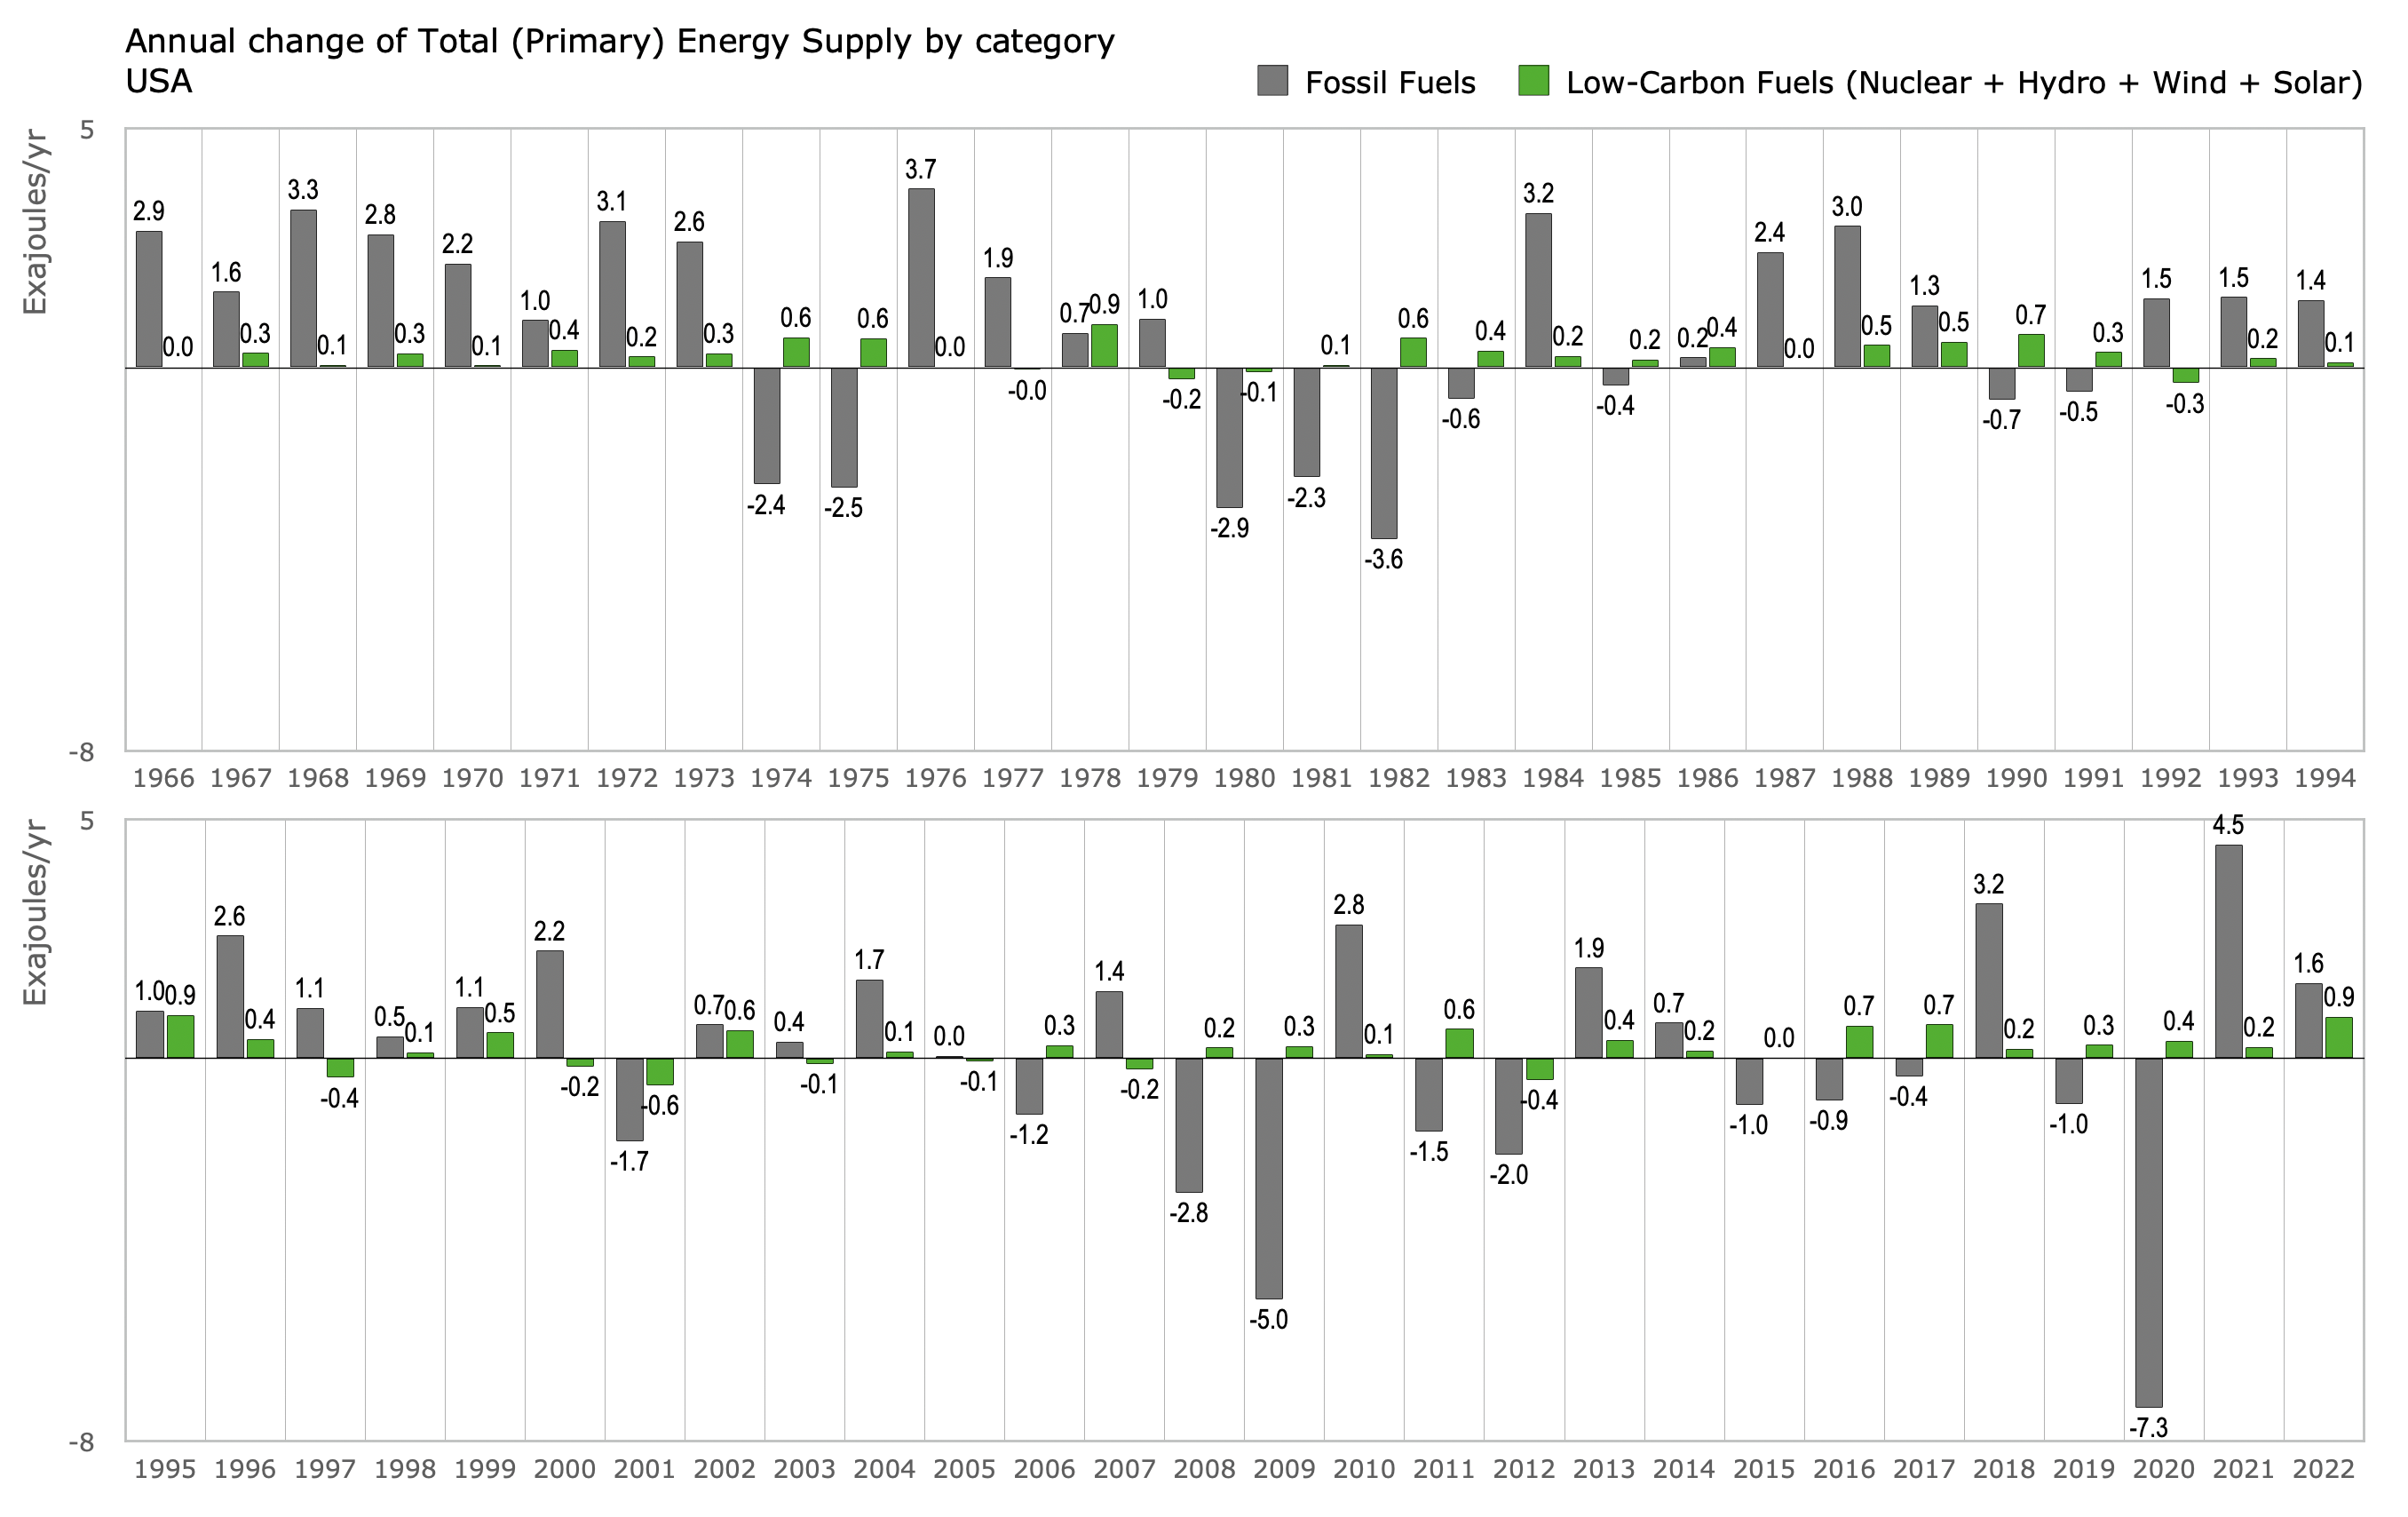
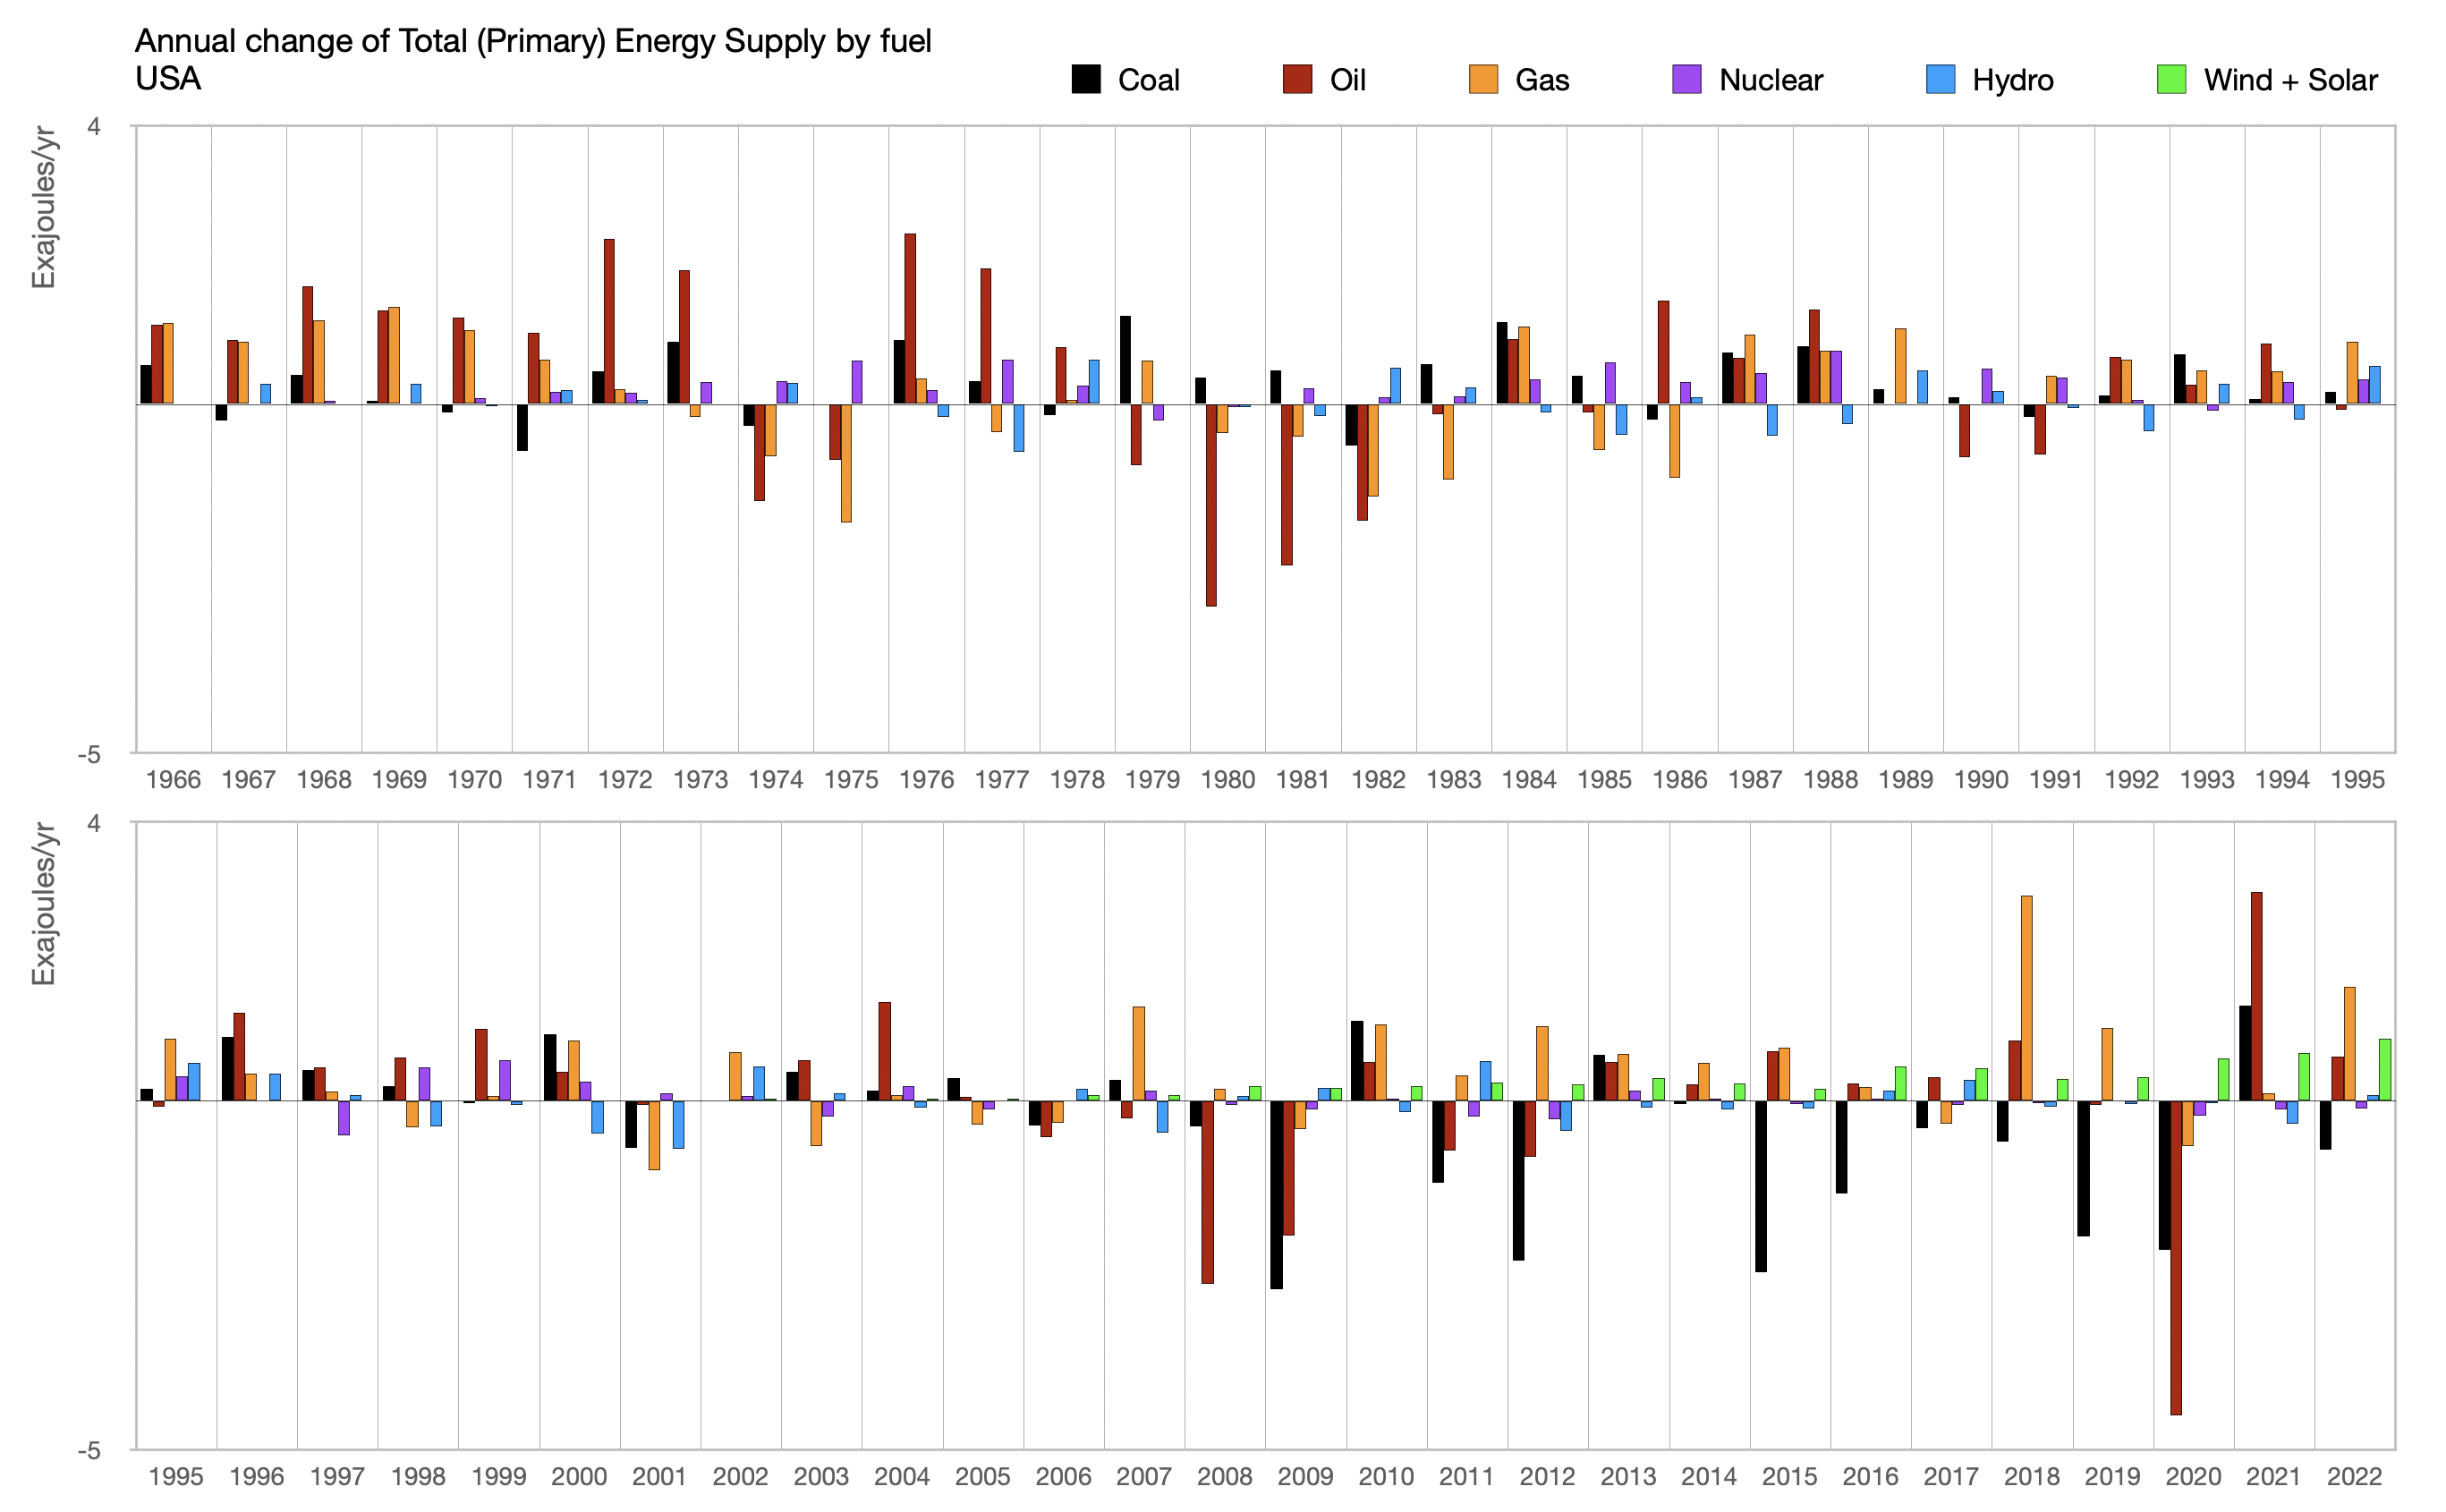
Total (Primary) Energy Supply
Total Energy Supply (also known as ‘Primary energy’) accounts for energy supplied prior to conversions to electricity or hydrogen (see the introduction for explanation).
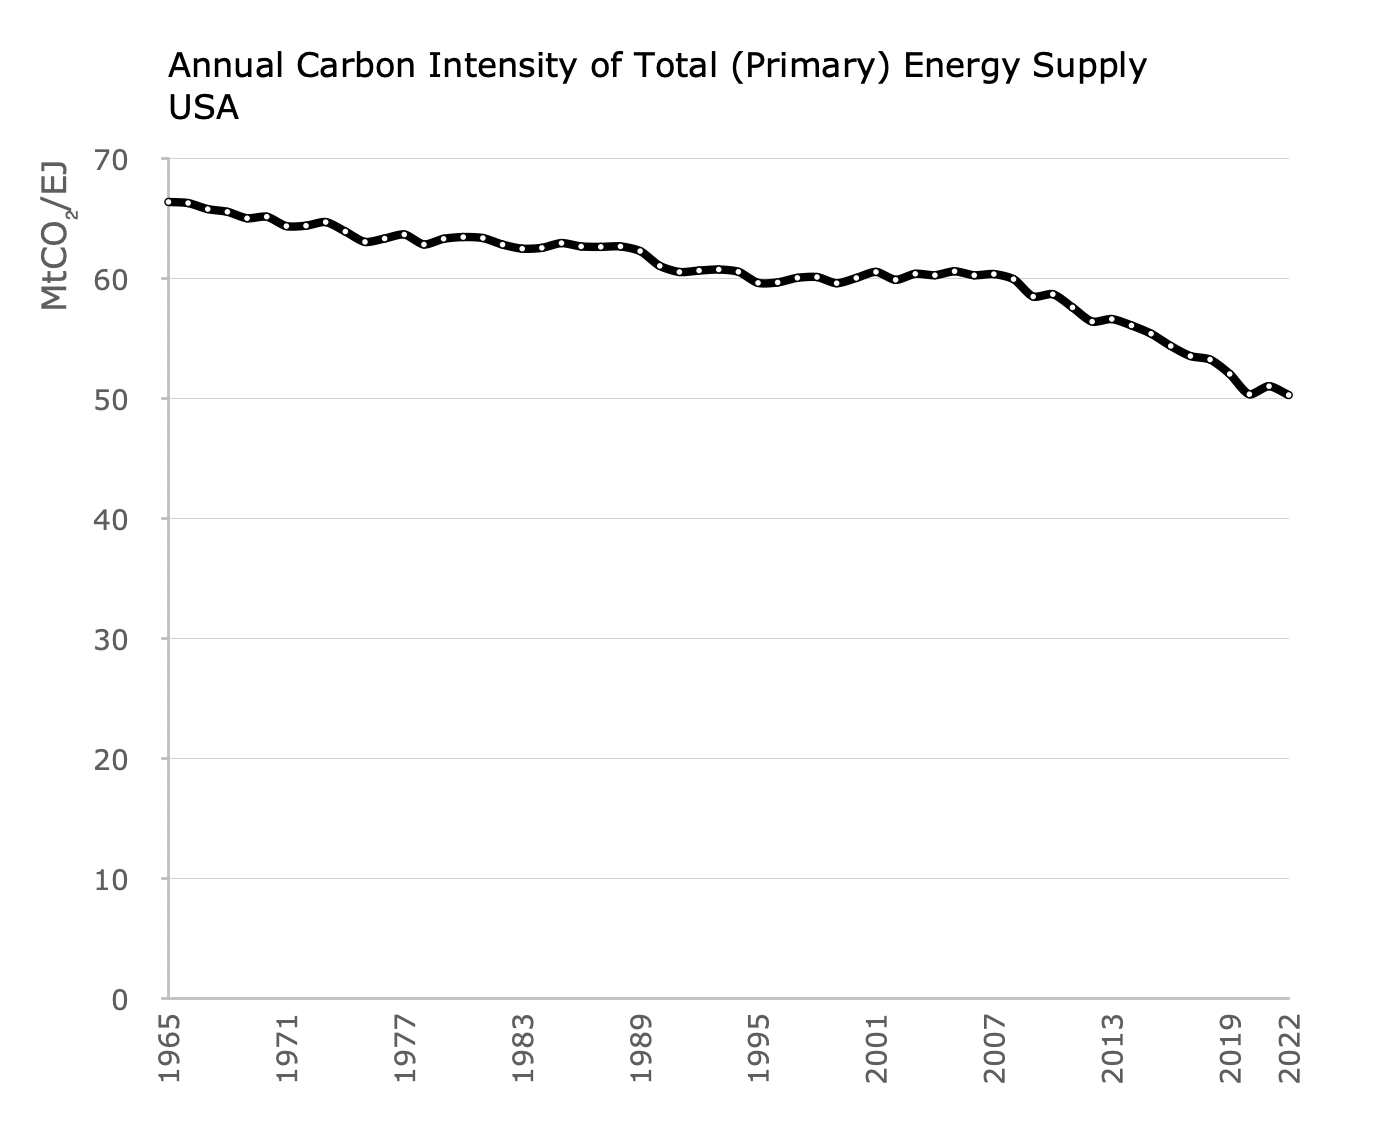
Carbon Intensity
Energy Consumption (i.e. Final Energy)
Final energy accounts the consumption of energy in final forms, and therefore can account for electricity separately from heat (e.g energy consumed for steel manufacture, or by transport). Unlike primary energy, final energy does not rely on calculating equivalences for non-combustible fuels such as solar and wind (see the introduction for explanation).
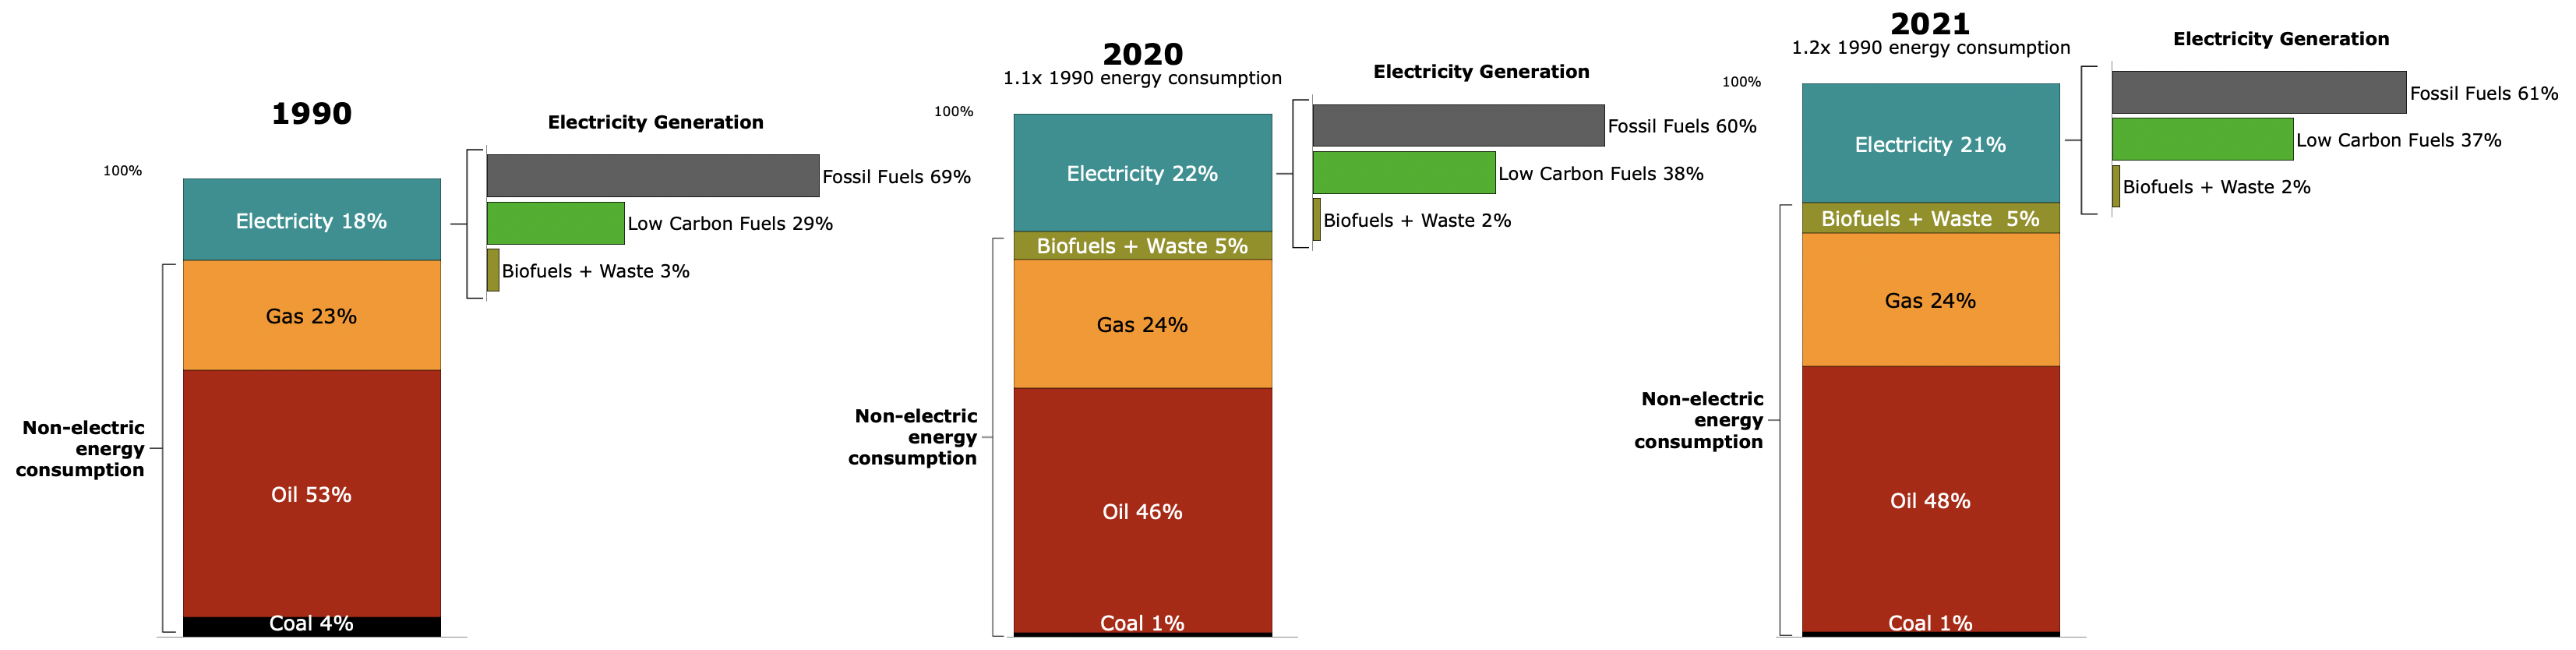
Total of displayed shares will not equal 100% because, for clarity, values are rounded and segments <1% share are not shown.
The height of each column is the total annual energy consumption relative to 1990.
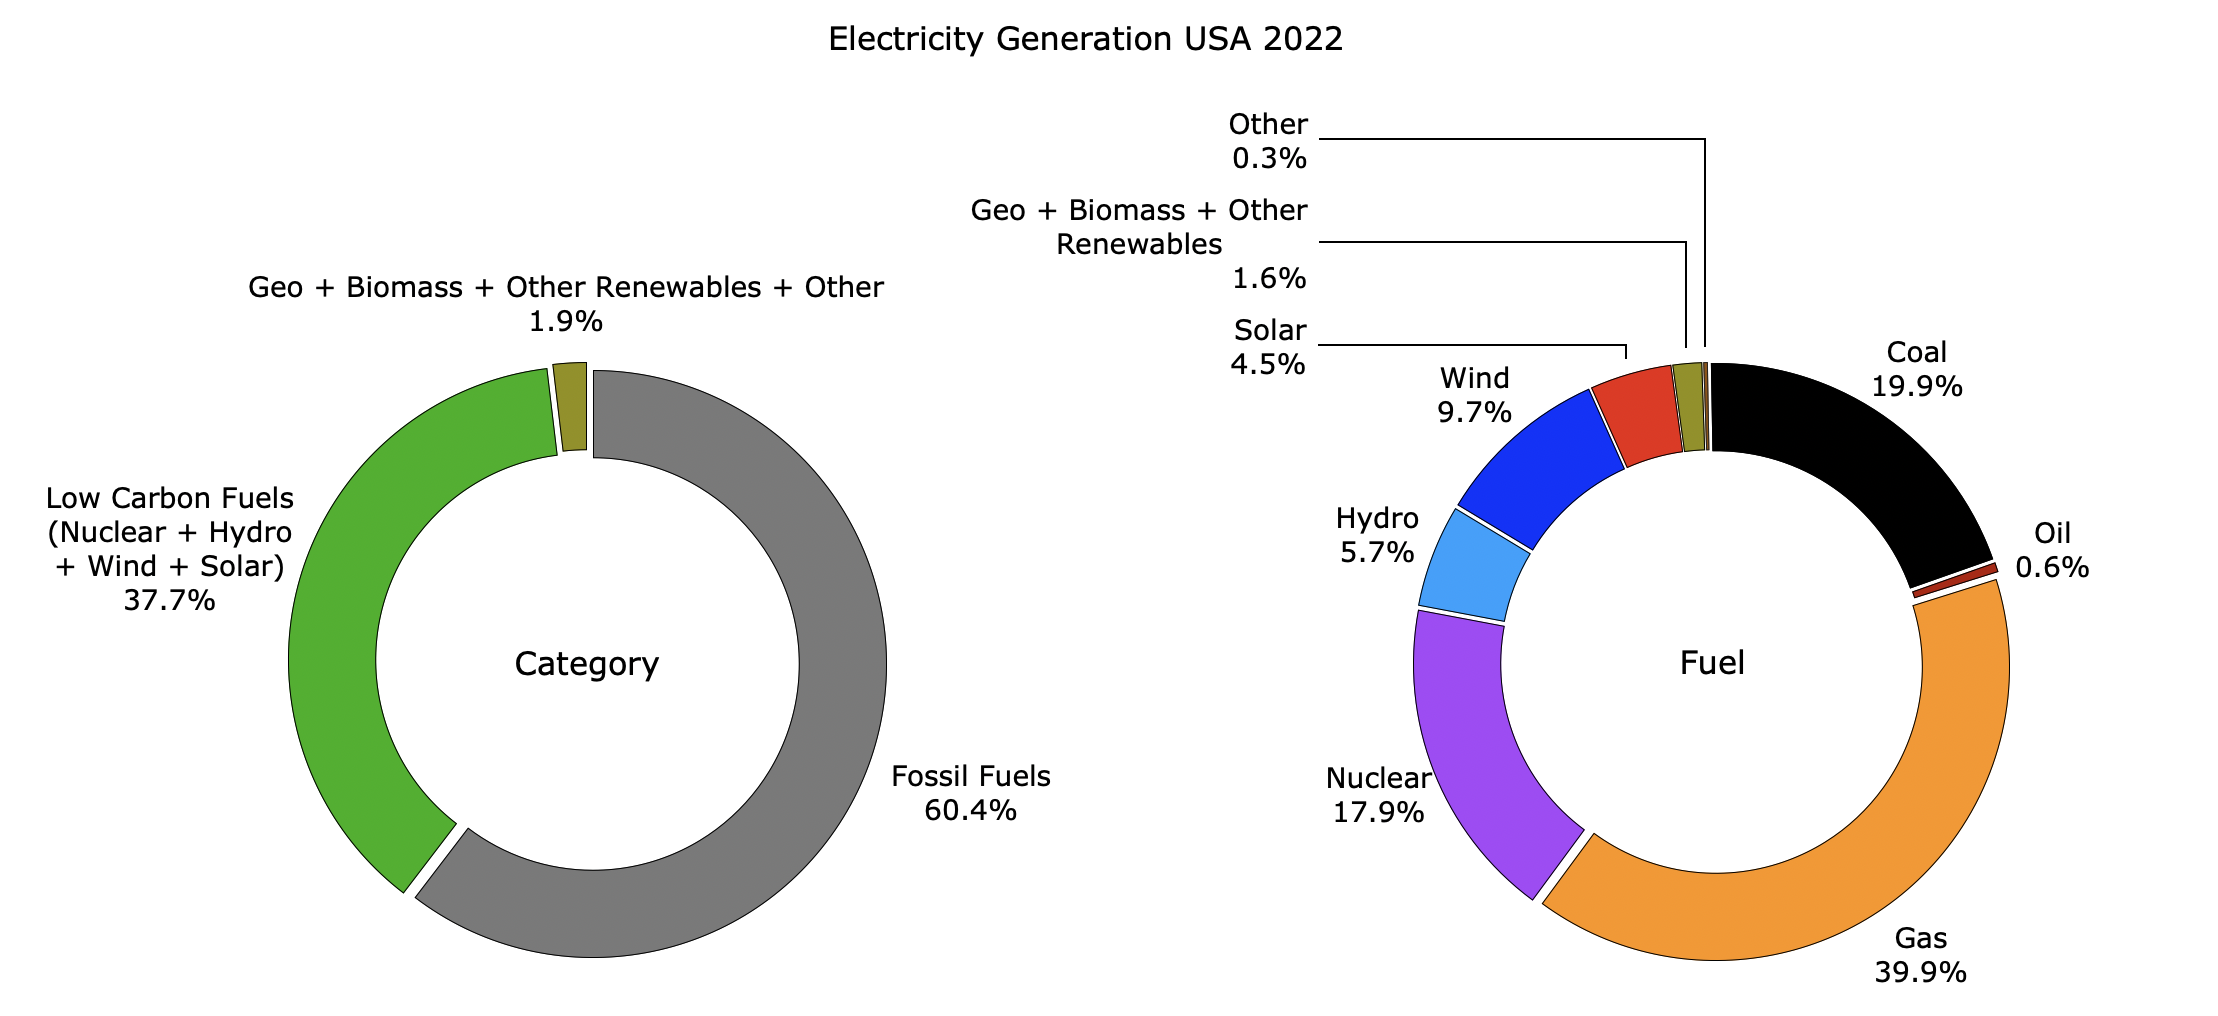
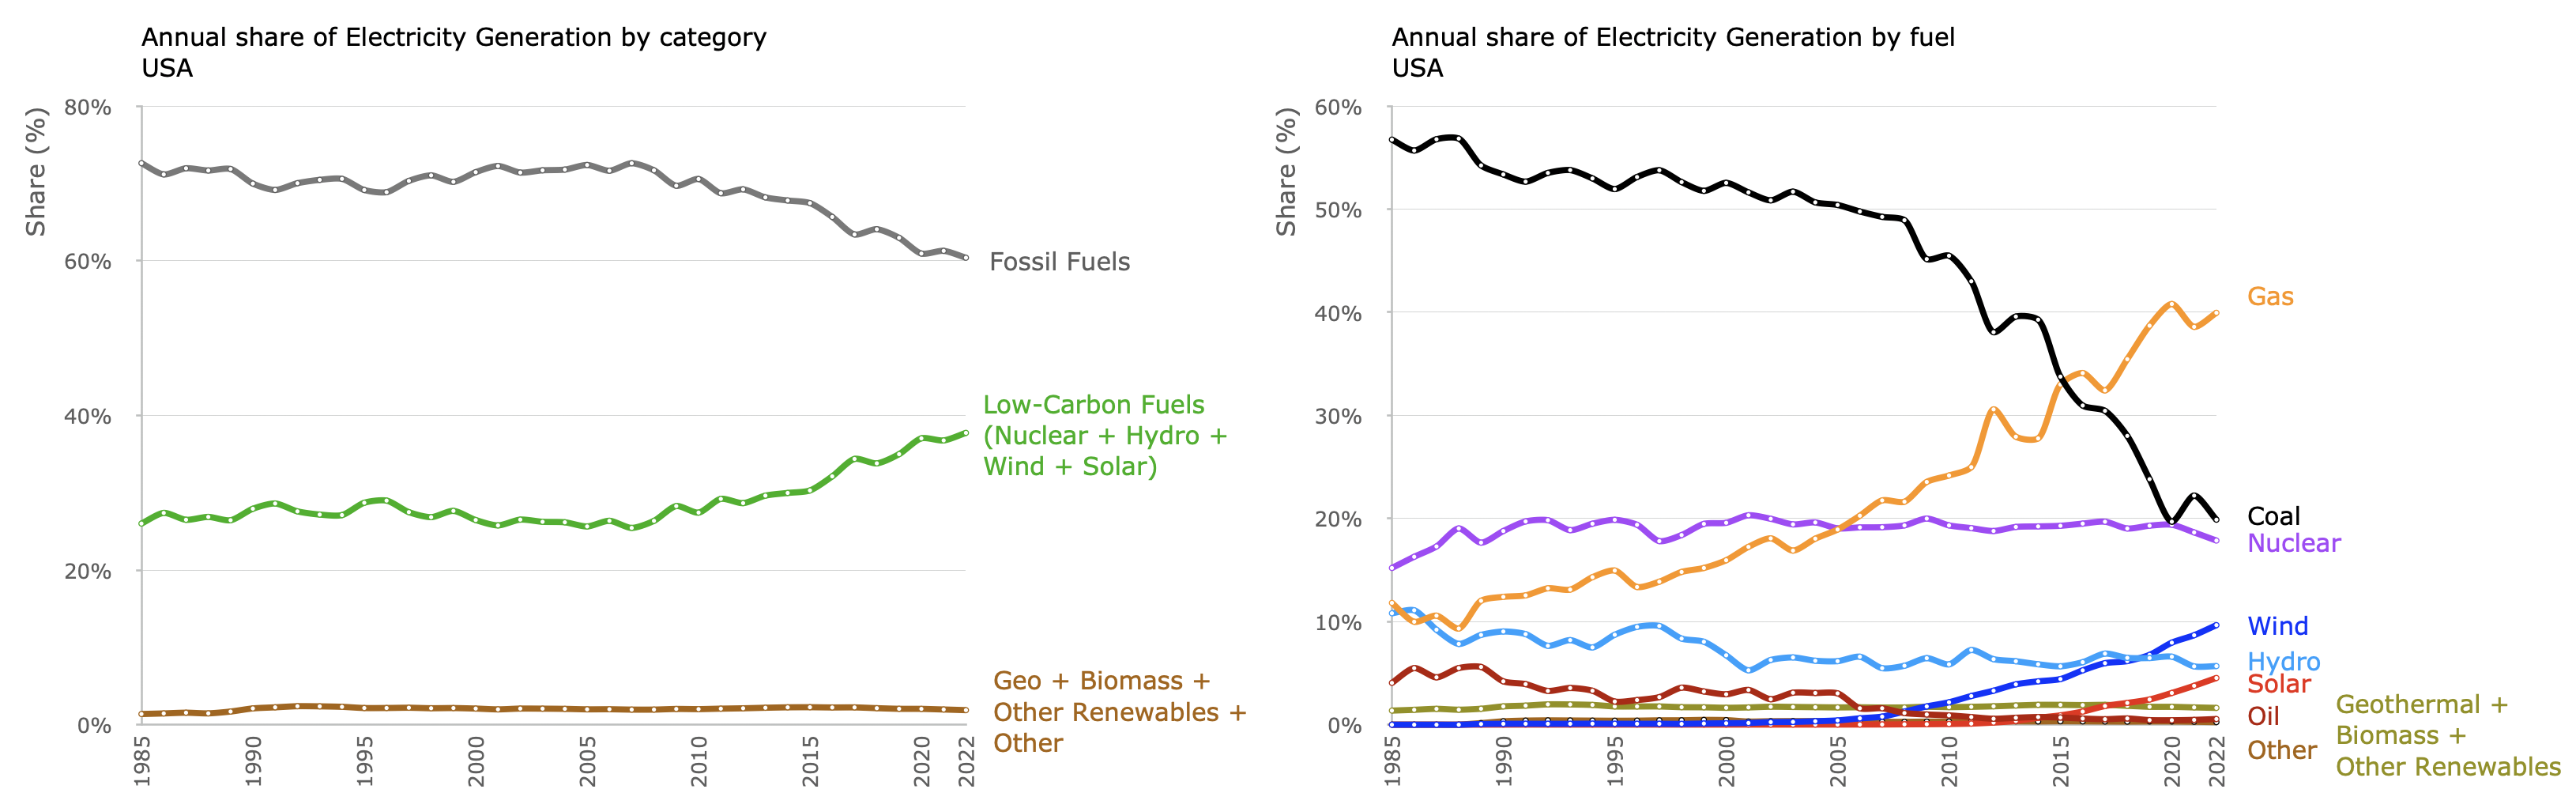
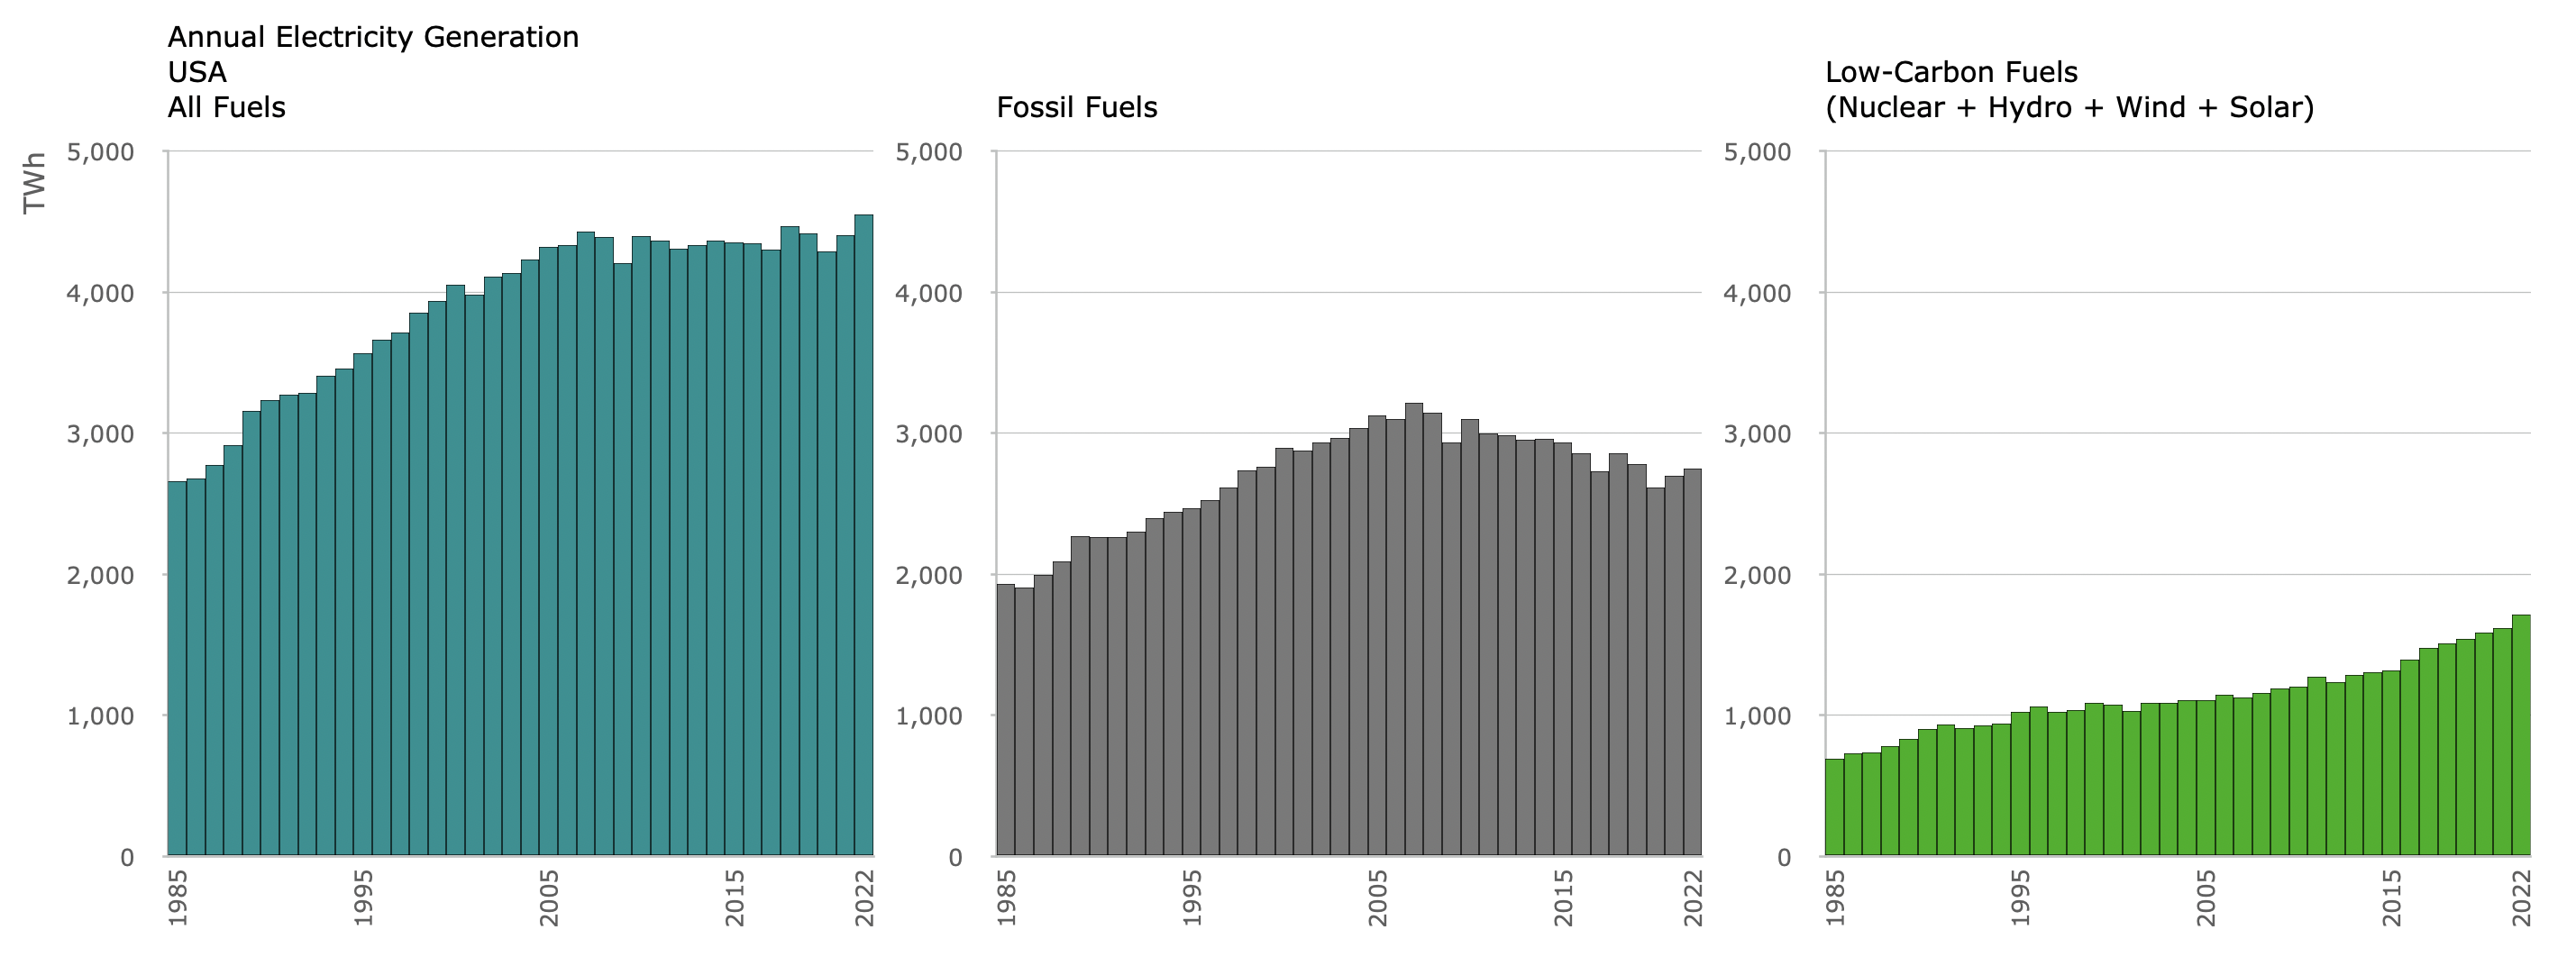
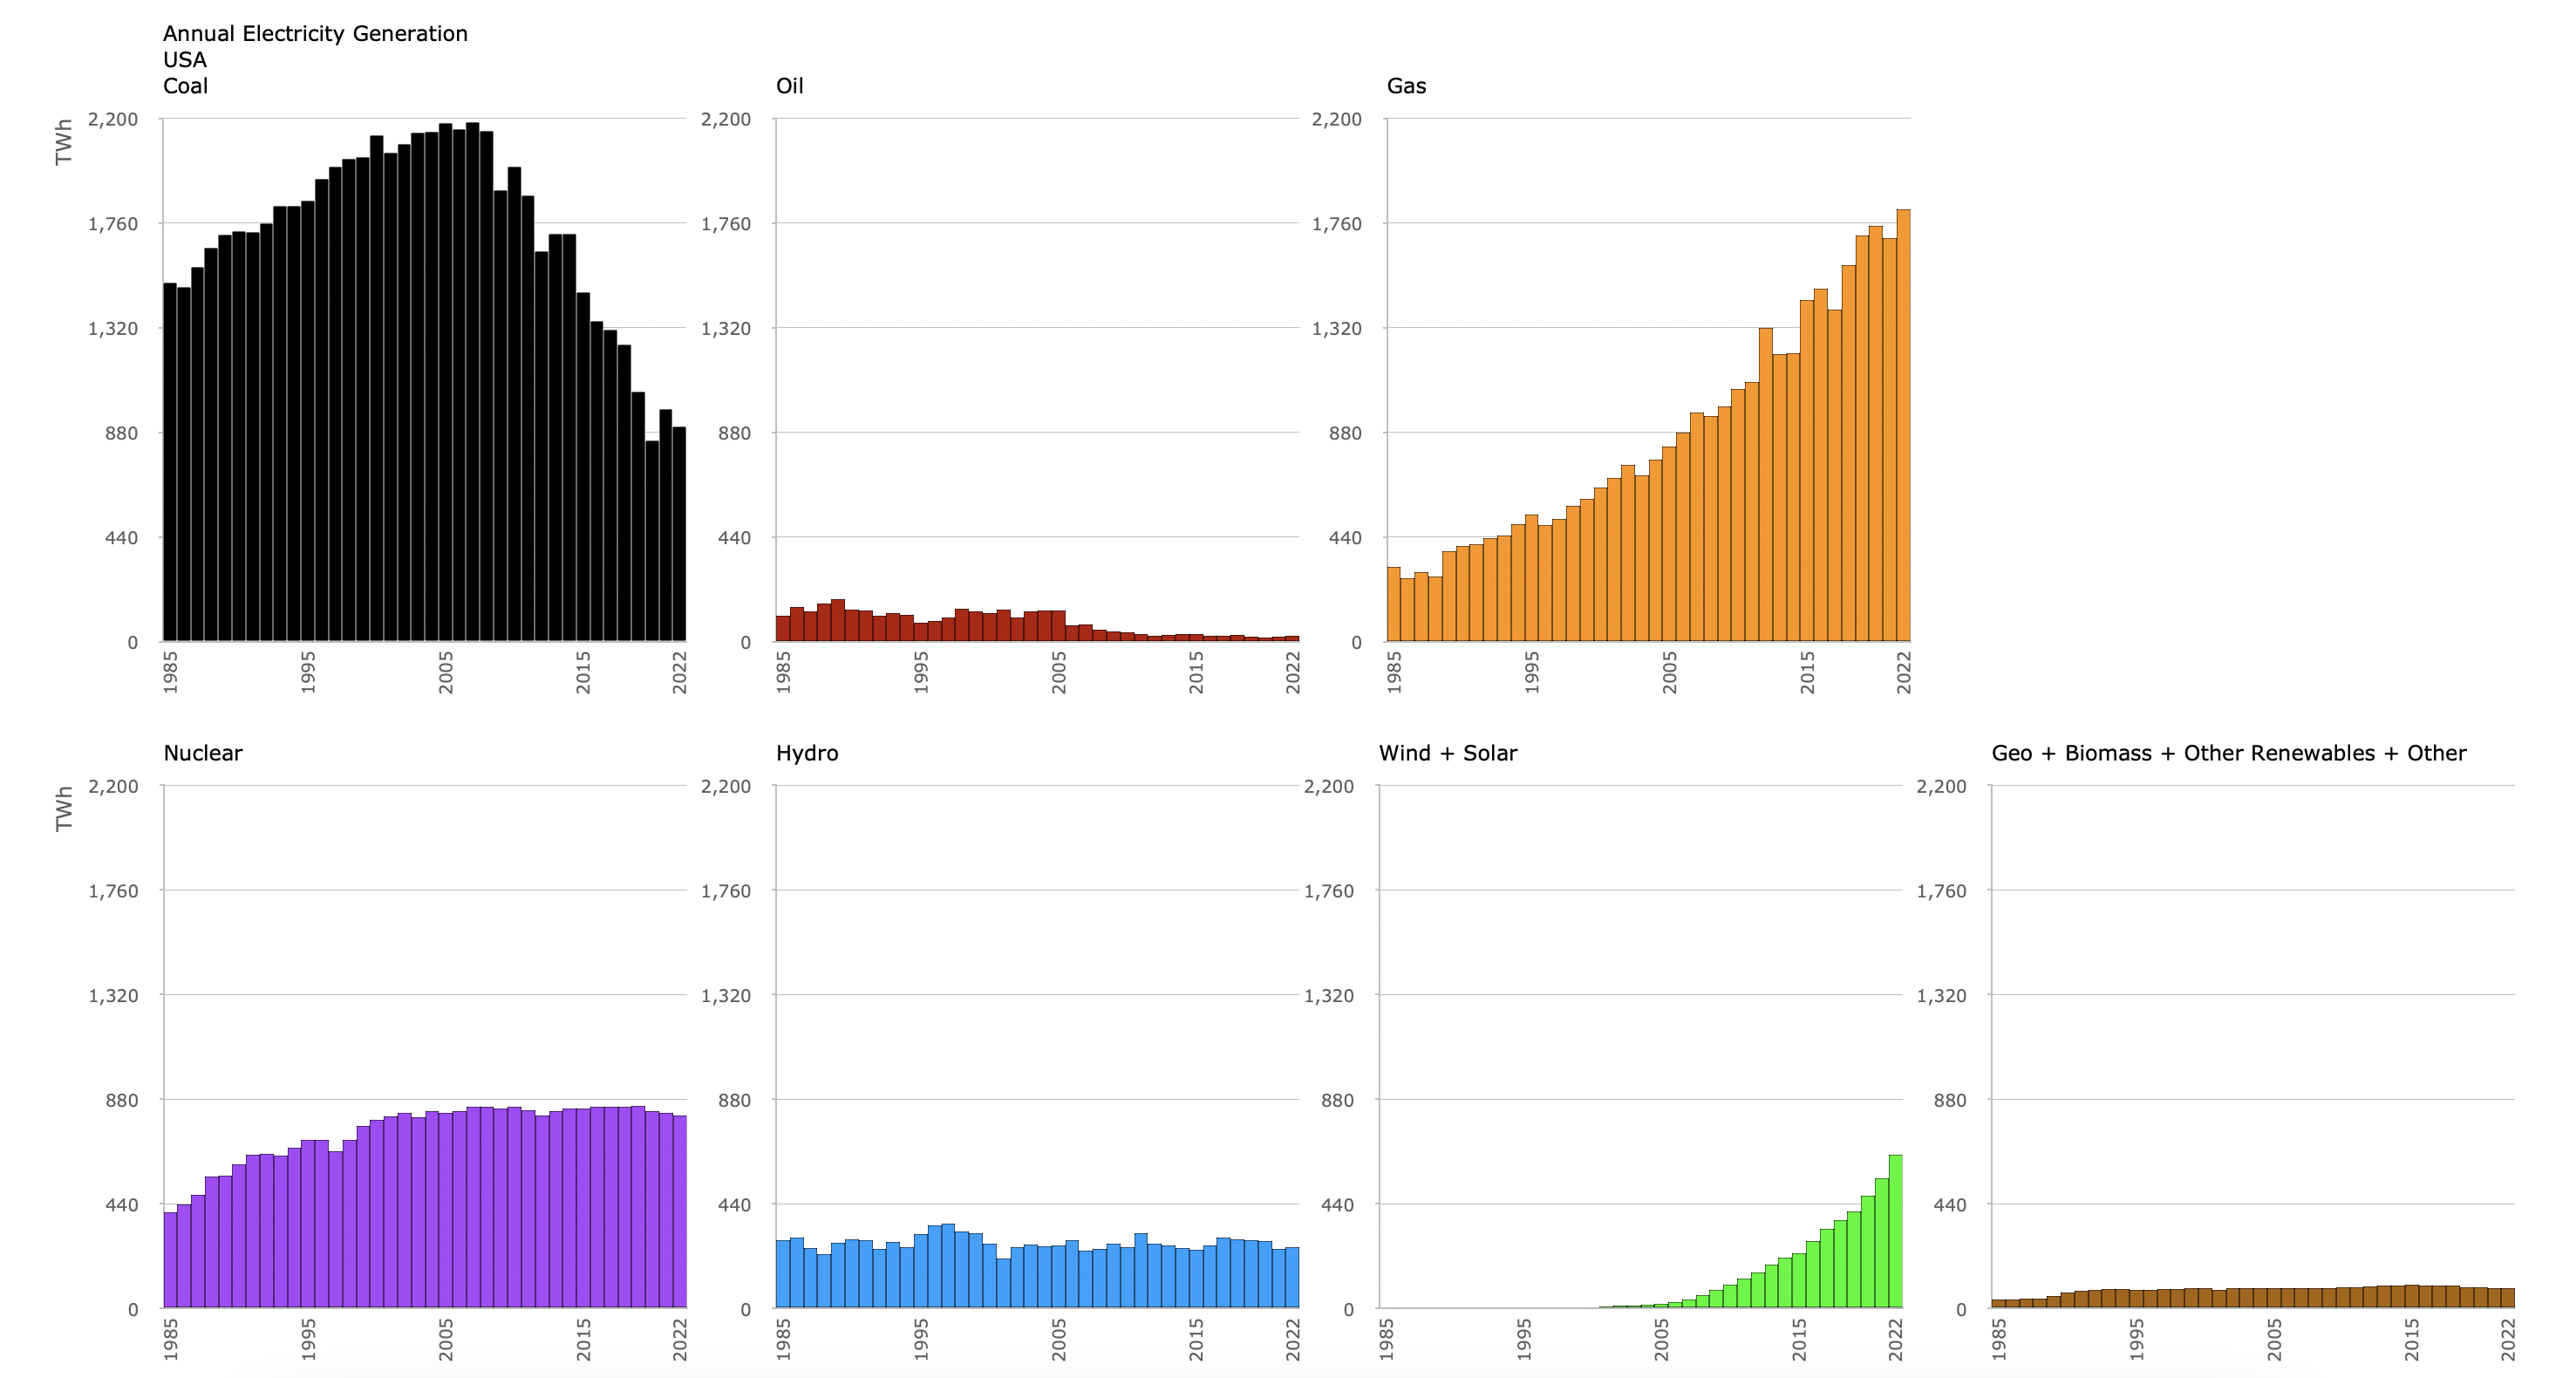
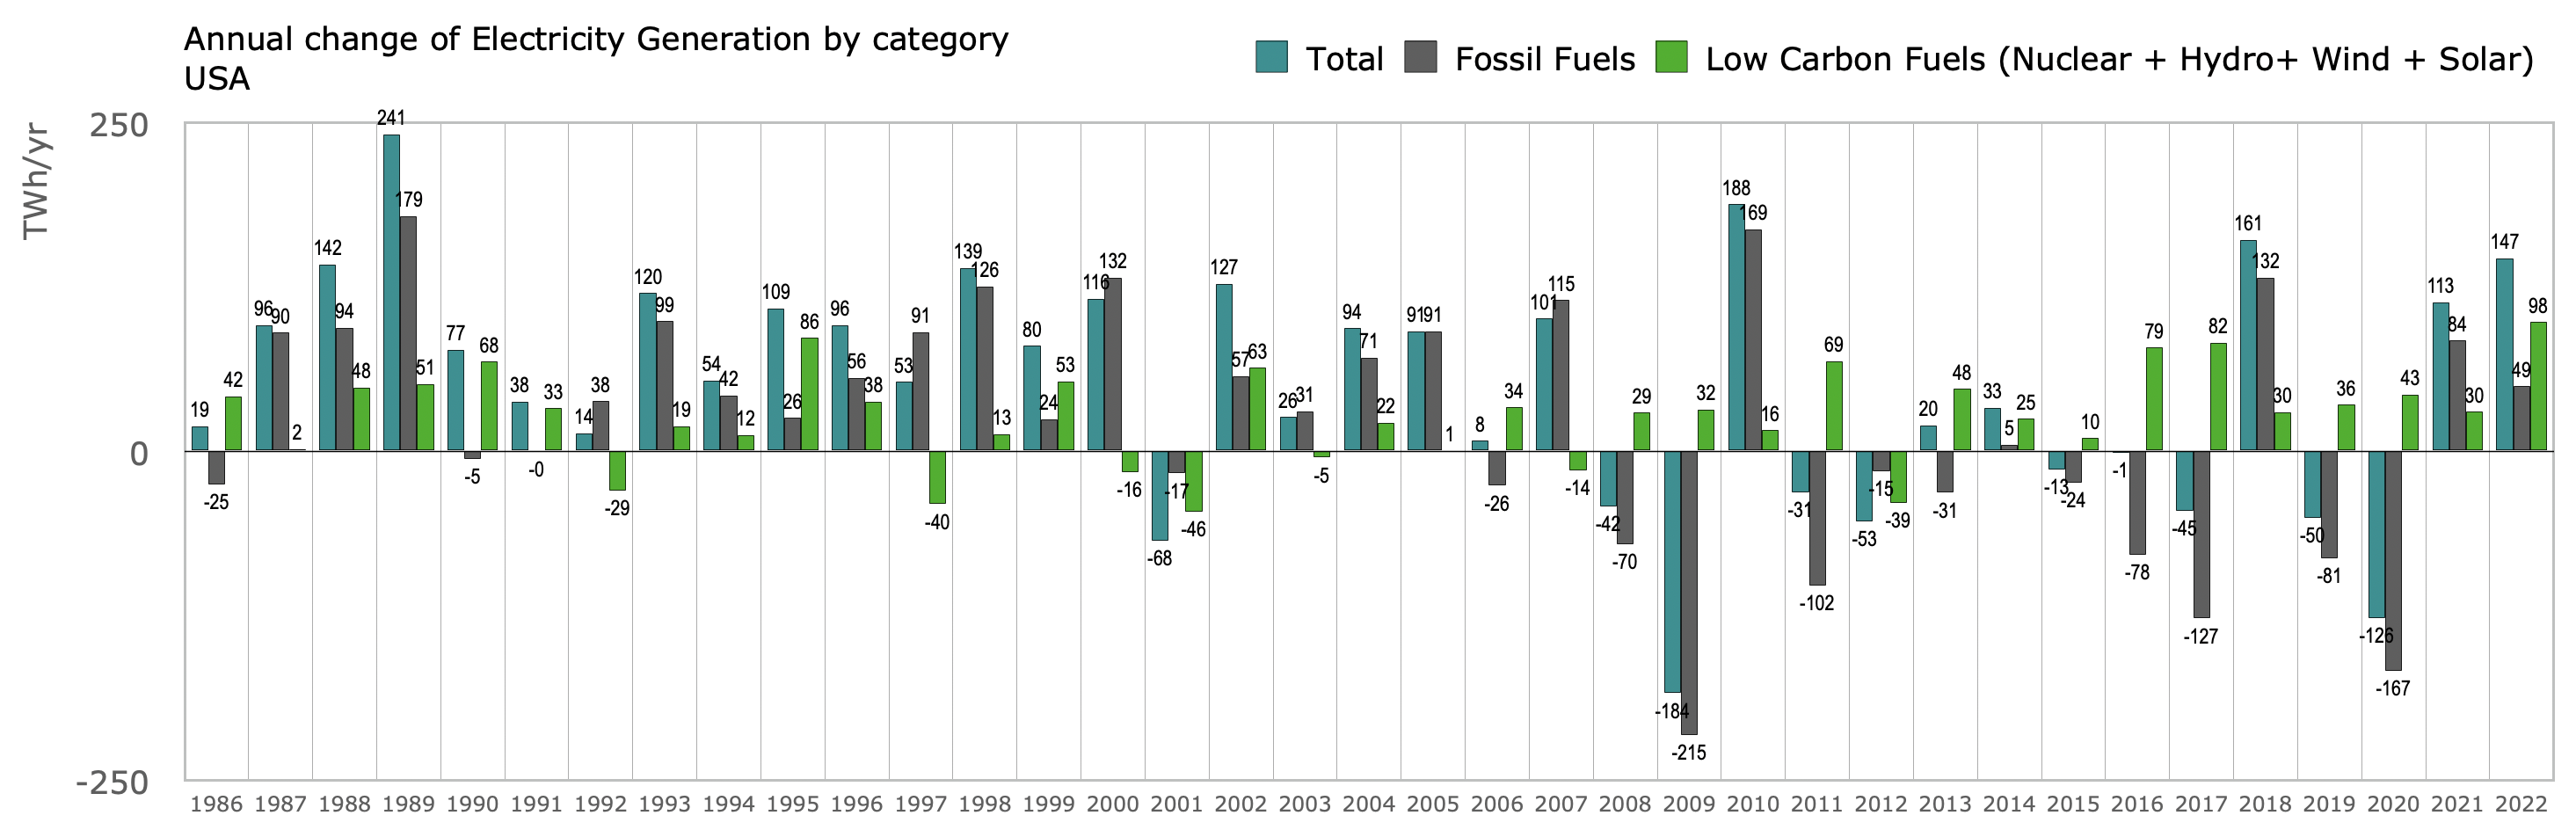
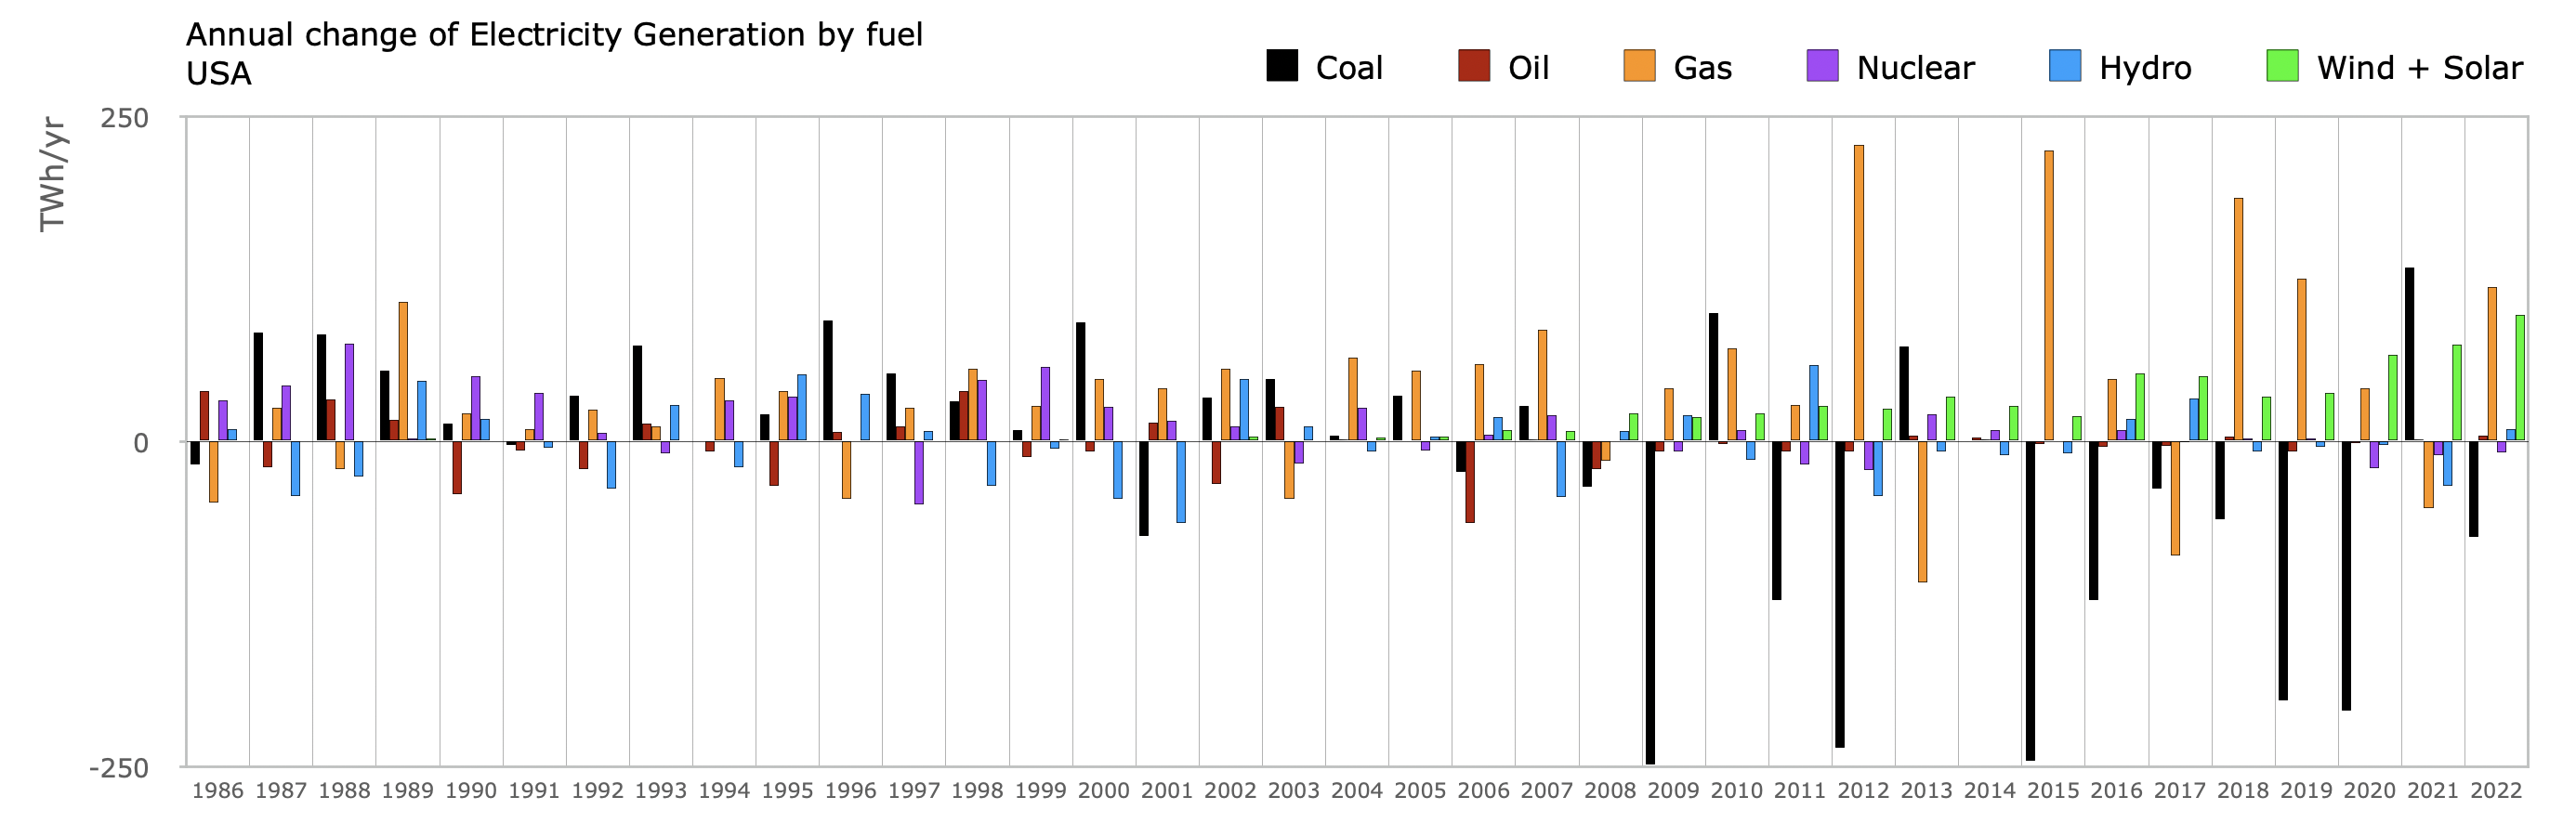
Electricity
- https://en.wikipedia.org/wiki/File:Map_of_USA_with_state_names_2.svg[↩]
- https://www.worldenergydata.org/world-fossil-fuel-production-and-primary-energy/, year 2022.[↩][↩][↩]
- https://www.energyinst.org/statistical-review/about, from energy, 14% share in year 2022. Largest was China with a 31% share.[↩]
- https://globalcarbonatlas.org/emissions/carbon-emissions/, 15 tonnes CO2 per person in year 2021. Ranking is: Qatar(36tCO2/capita/yr), Bahrain(27), Kuwait(25), Trinidad and Tobago(24), Brunei Darussalam(22), UAE(22), New Caledonia(19), Saudi Arabia(19), Oman(18), Australia(15), Mongolia(15), USA(15). Values in brackets rounded.[↩]
- https://www.energyinst.org/statistical-review/about[↩][↩][↩][↩][↩][↩][↩][↩][↩][↩][↩][↩][↩][↩][↩]
- Sheets used from the data were: 1. ‘Coal Production – Tonnes’. 2. ‘Oil Production – Barrels’. Annual figure calculated. 3. ‘Gas Production – Bcm’.[↩]
- https://www.iea.org/data-and-statistics/data-tools/energy-statistics-data-browser?country=USA&energy=Balances&year=2021[↩]