The Energy System of Australia

Updated January 2024.

Map of Australia1.

Global Carbon Ranking

► 5th largest coal producer2
► 7th largest gas producer2
► 7th highest fossil fuel producer per capita3
► 9th highest CO2 emitter per capita3

Overall, even as we are moving to a decarbonised energy system, coal and gas will continue to heat our homes and keep manufacturing going for many years to come. In short, if projects involving these traditional energy sources stack up environmentally, economically, and socially, we will support them.

Australian Federal Government to back new fossil fuel projects that ‘stack up’ economically and environmentally

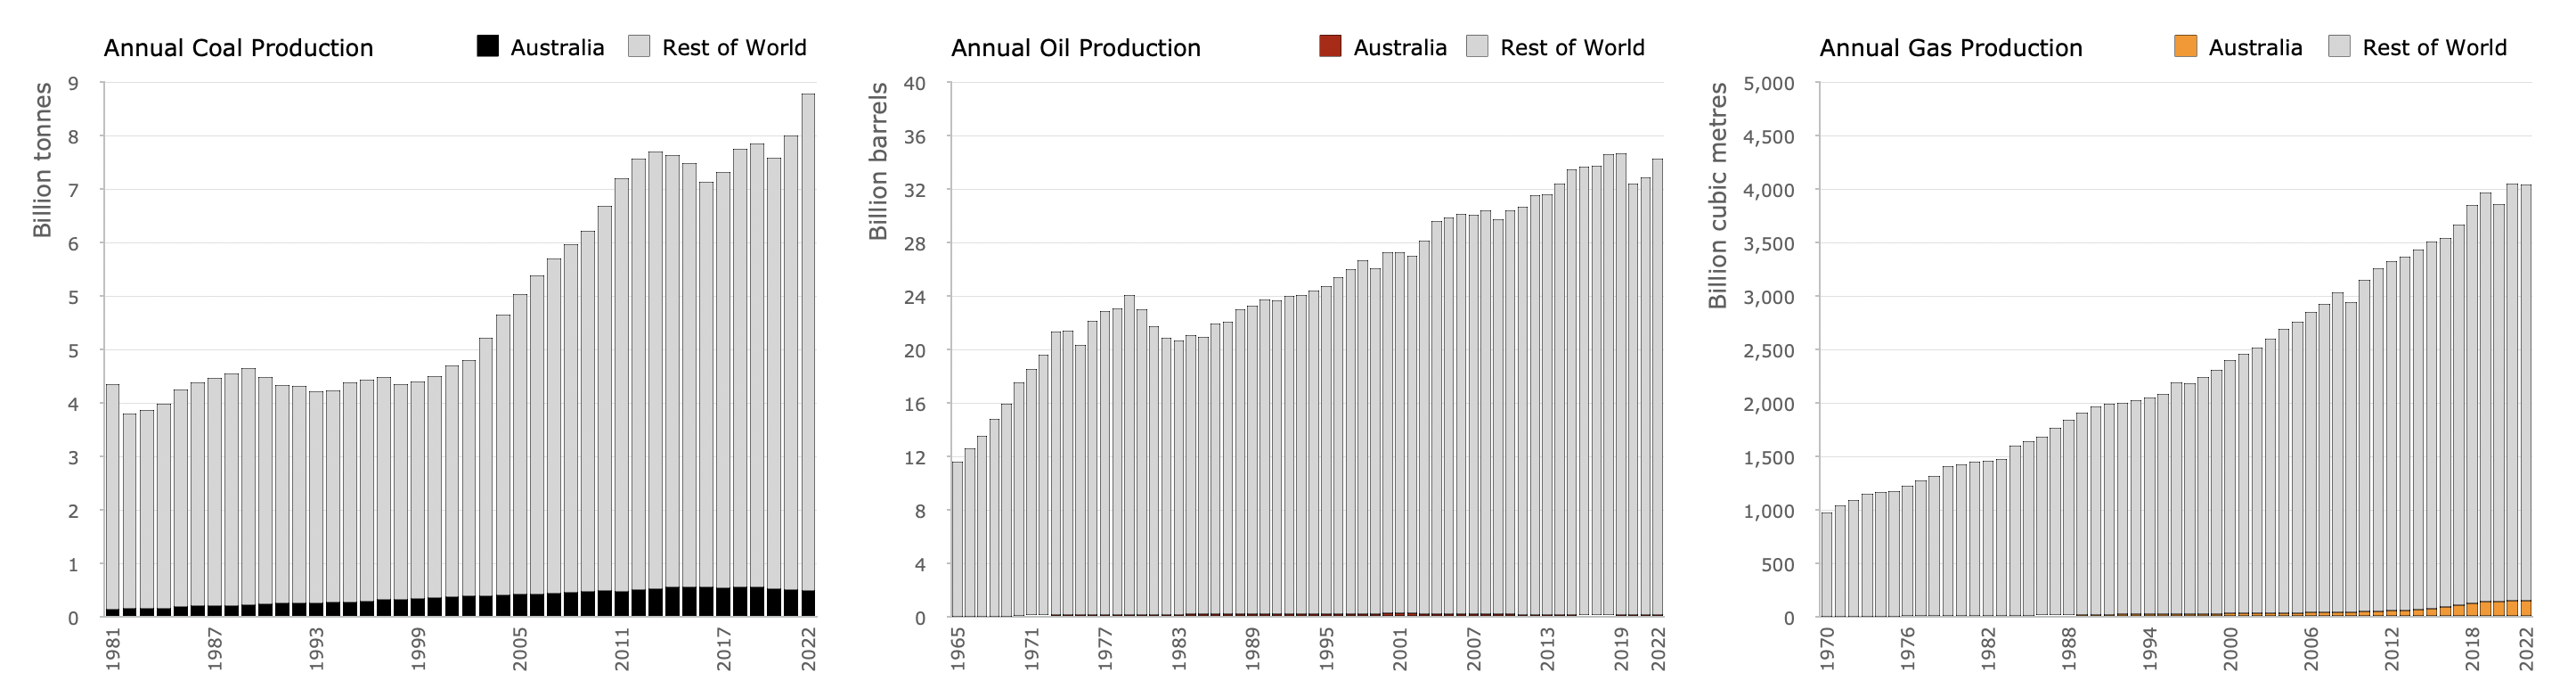
Fossil Fuel Production

Chart 1. Annual fossil fuel production. The time period of the charts differ due to different time periods of the available data. Data: Energy Institute Statistical Review of World Energy 20234 5.

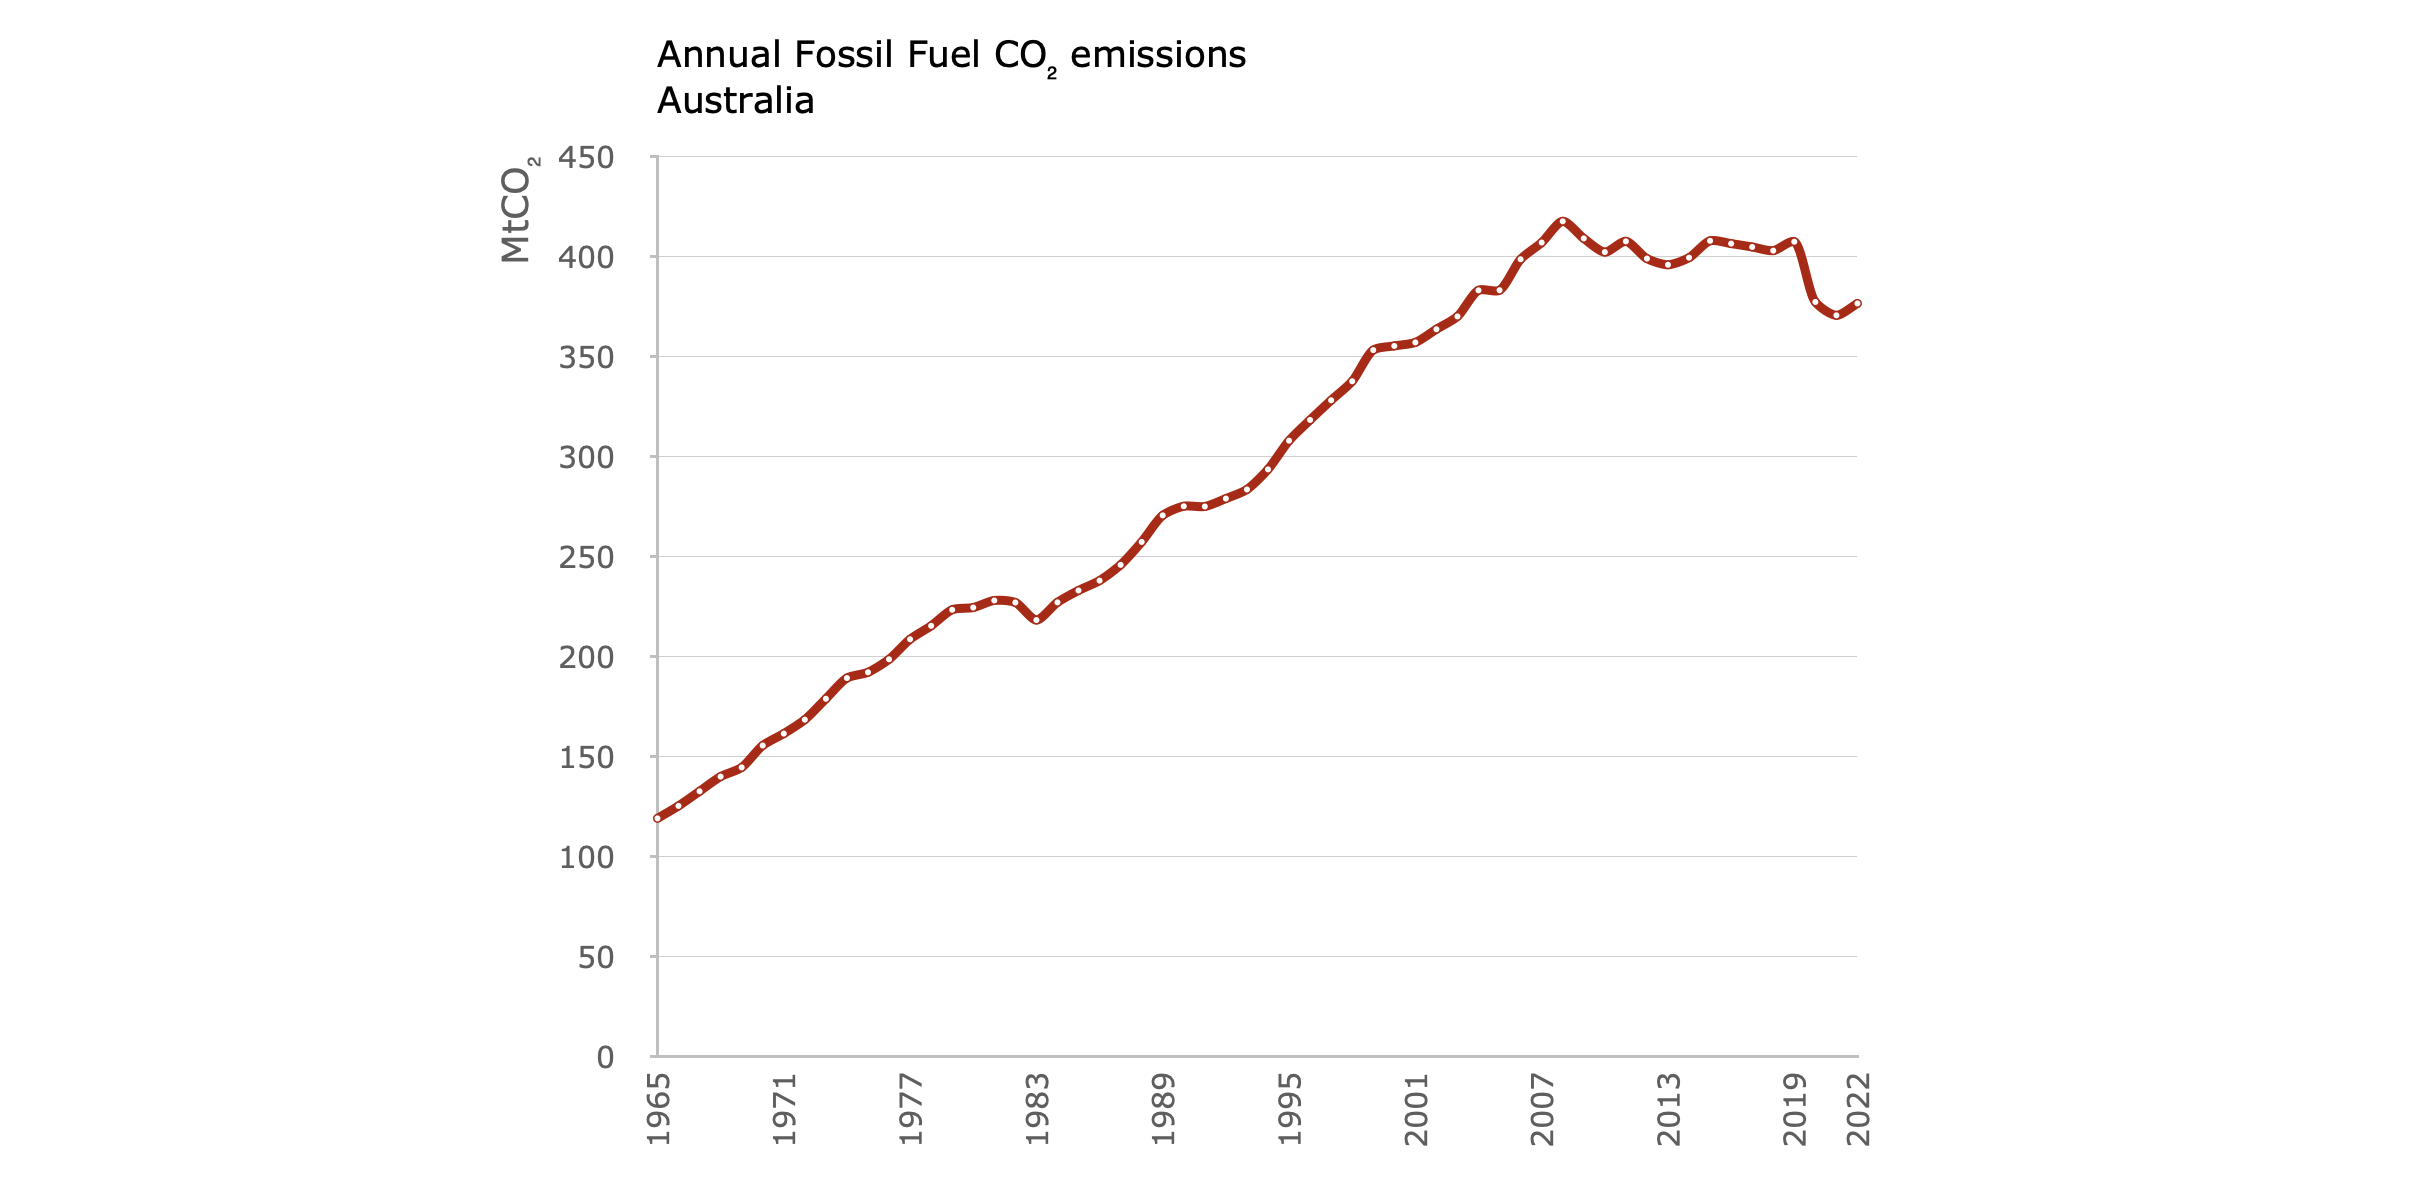
Carbon Dioxide (CO₂) Emissions

Chart 2. Annual fossil fuel CO₂ emissions. Data: Energy Institute Statistical Review of World Energy 20234.

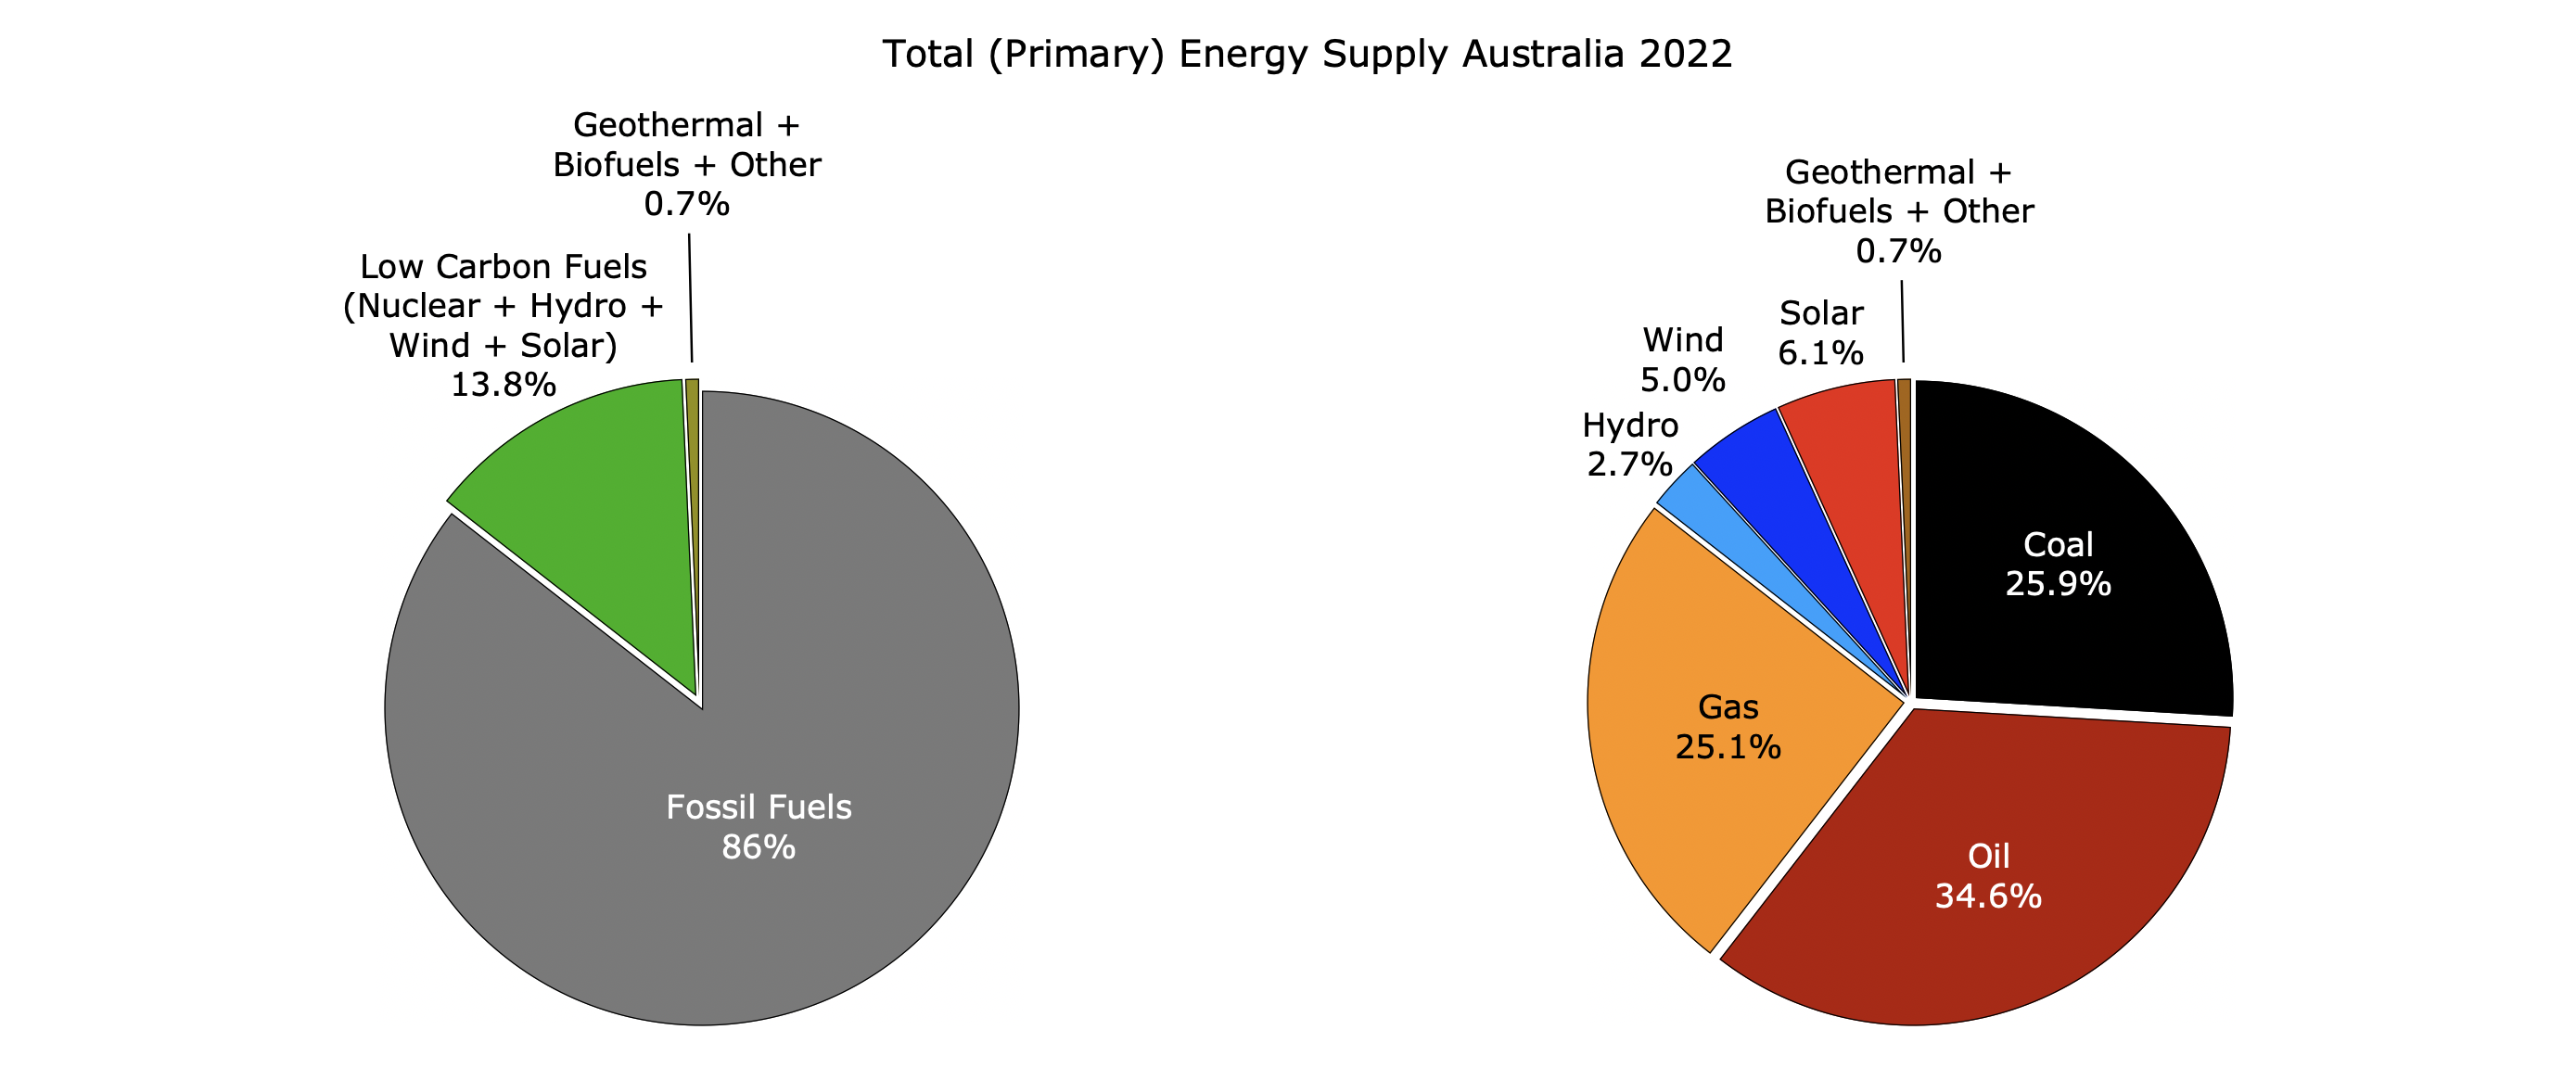
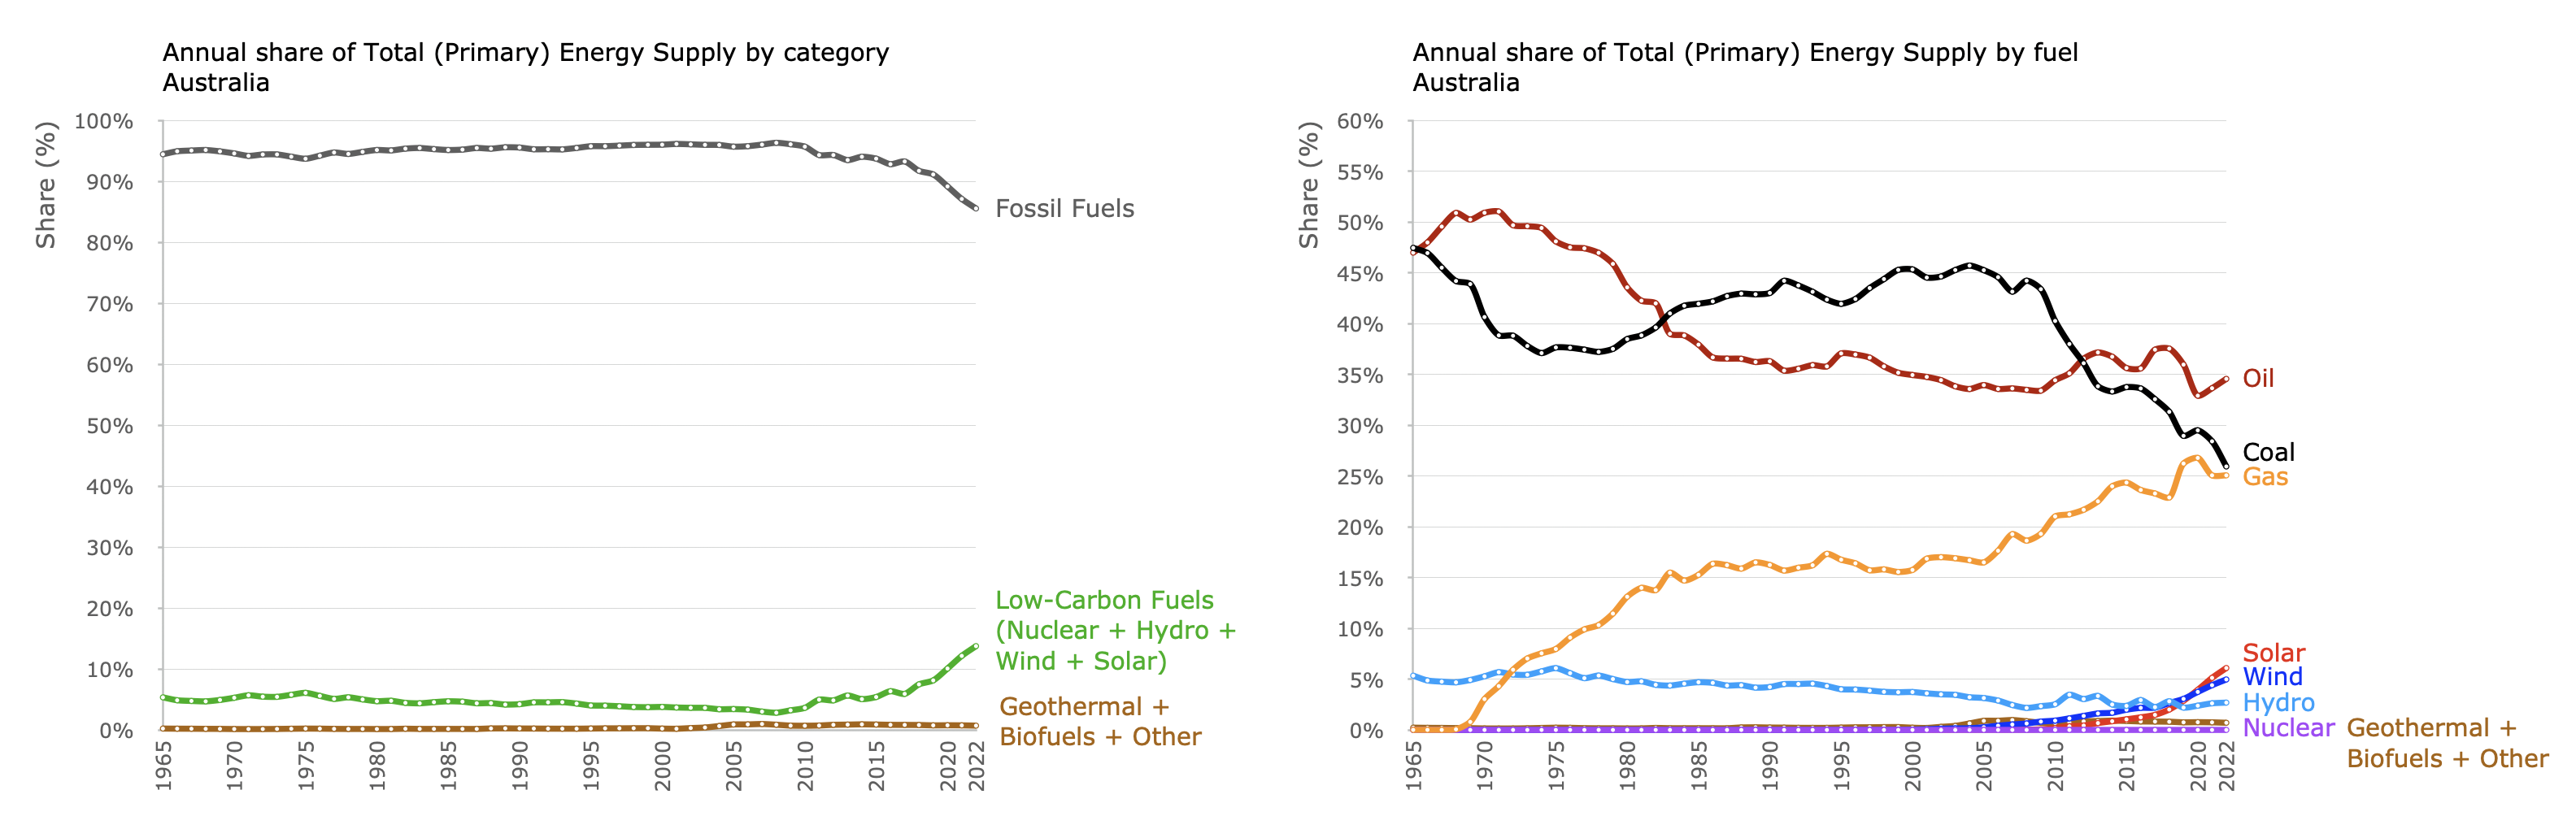
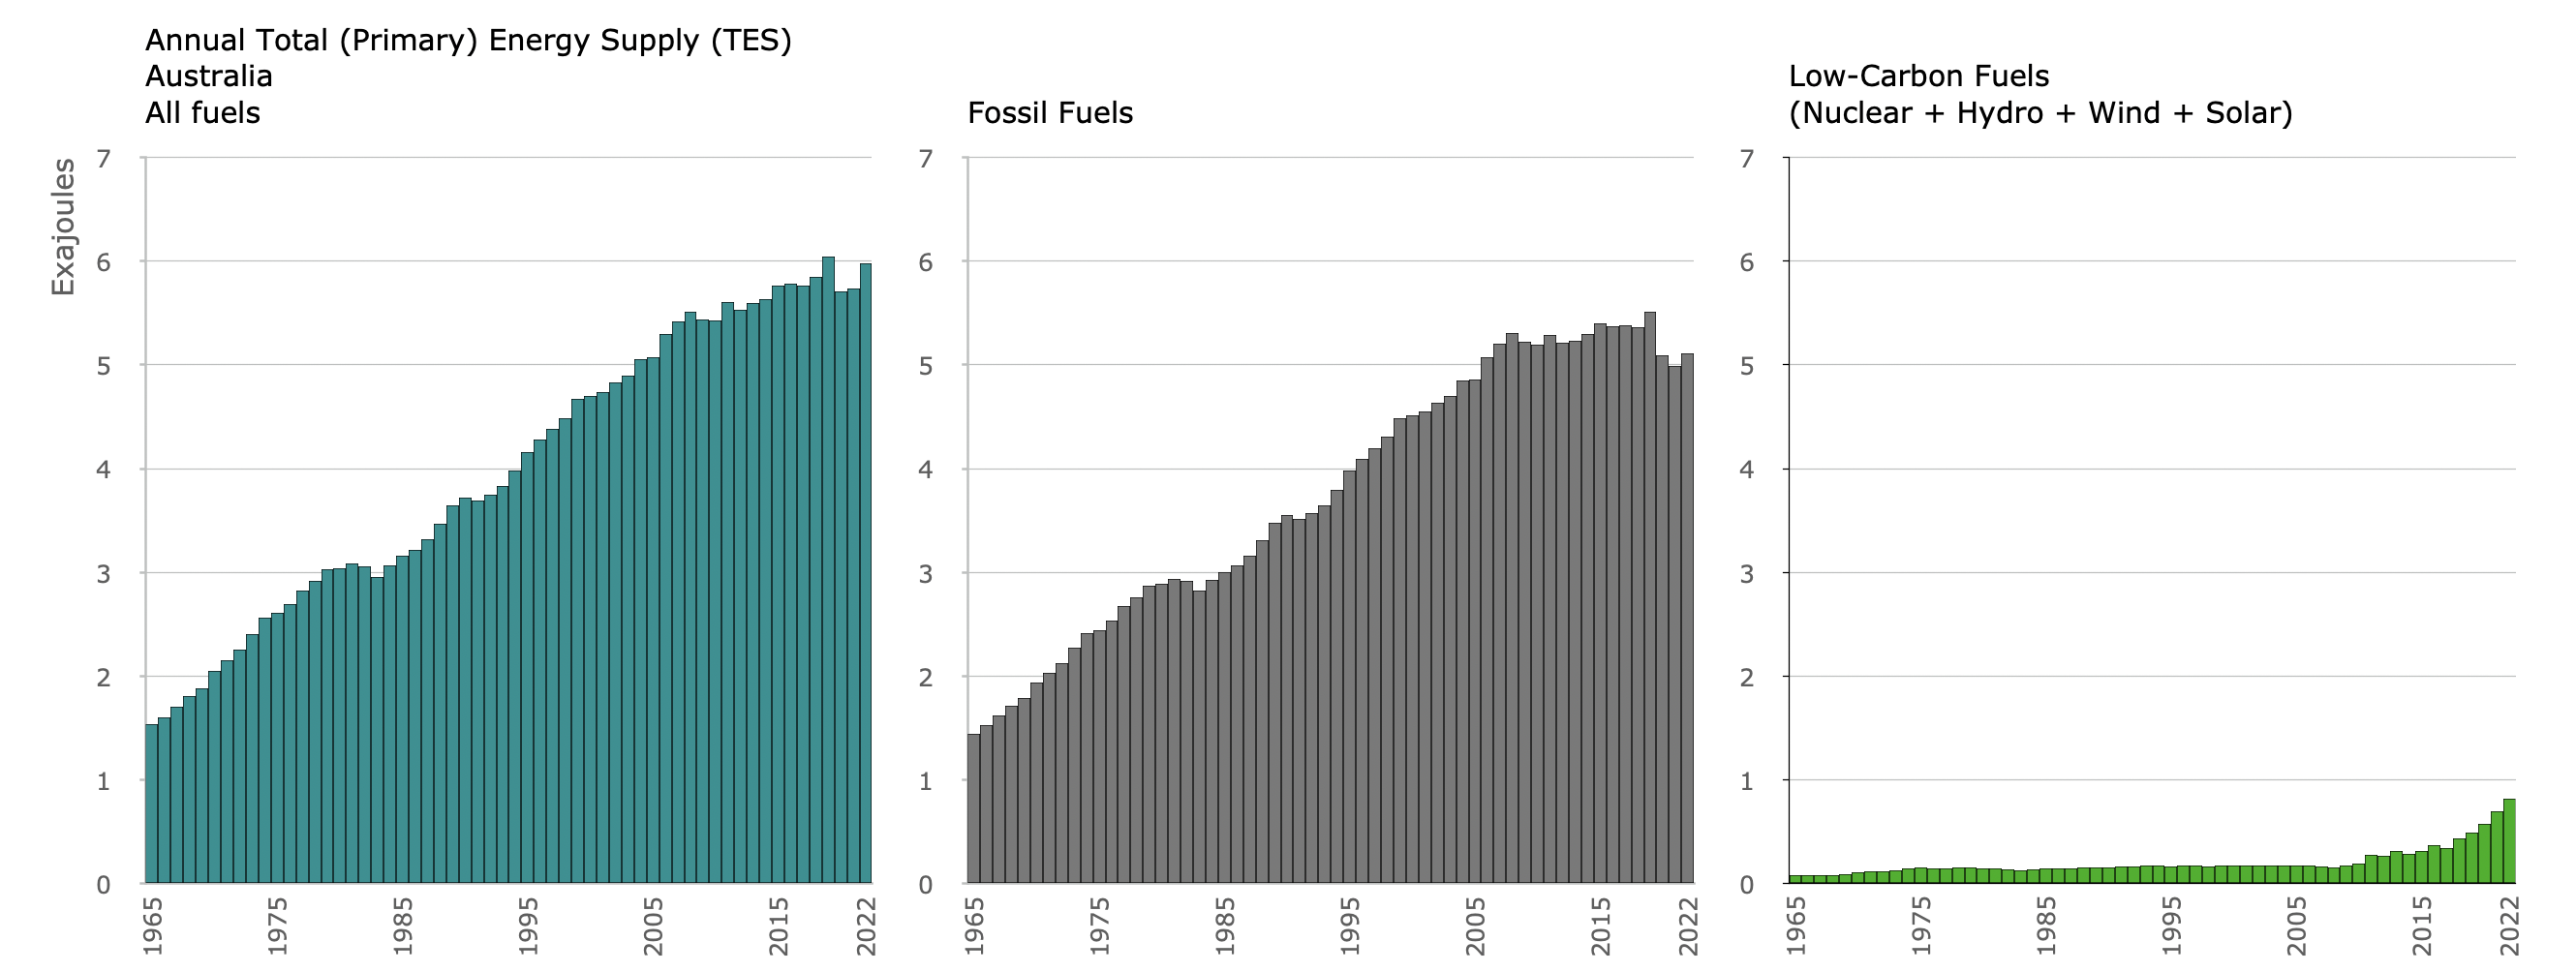
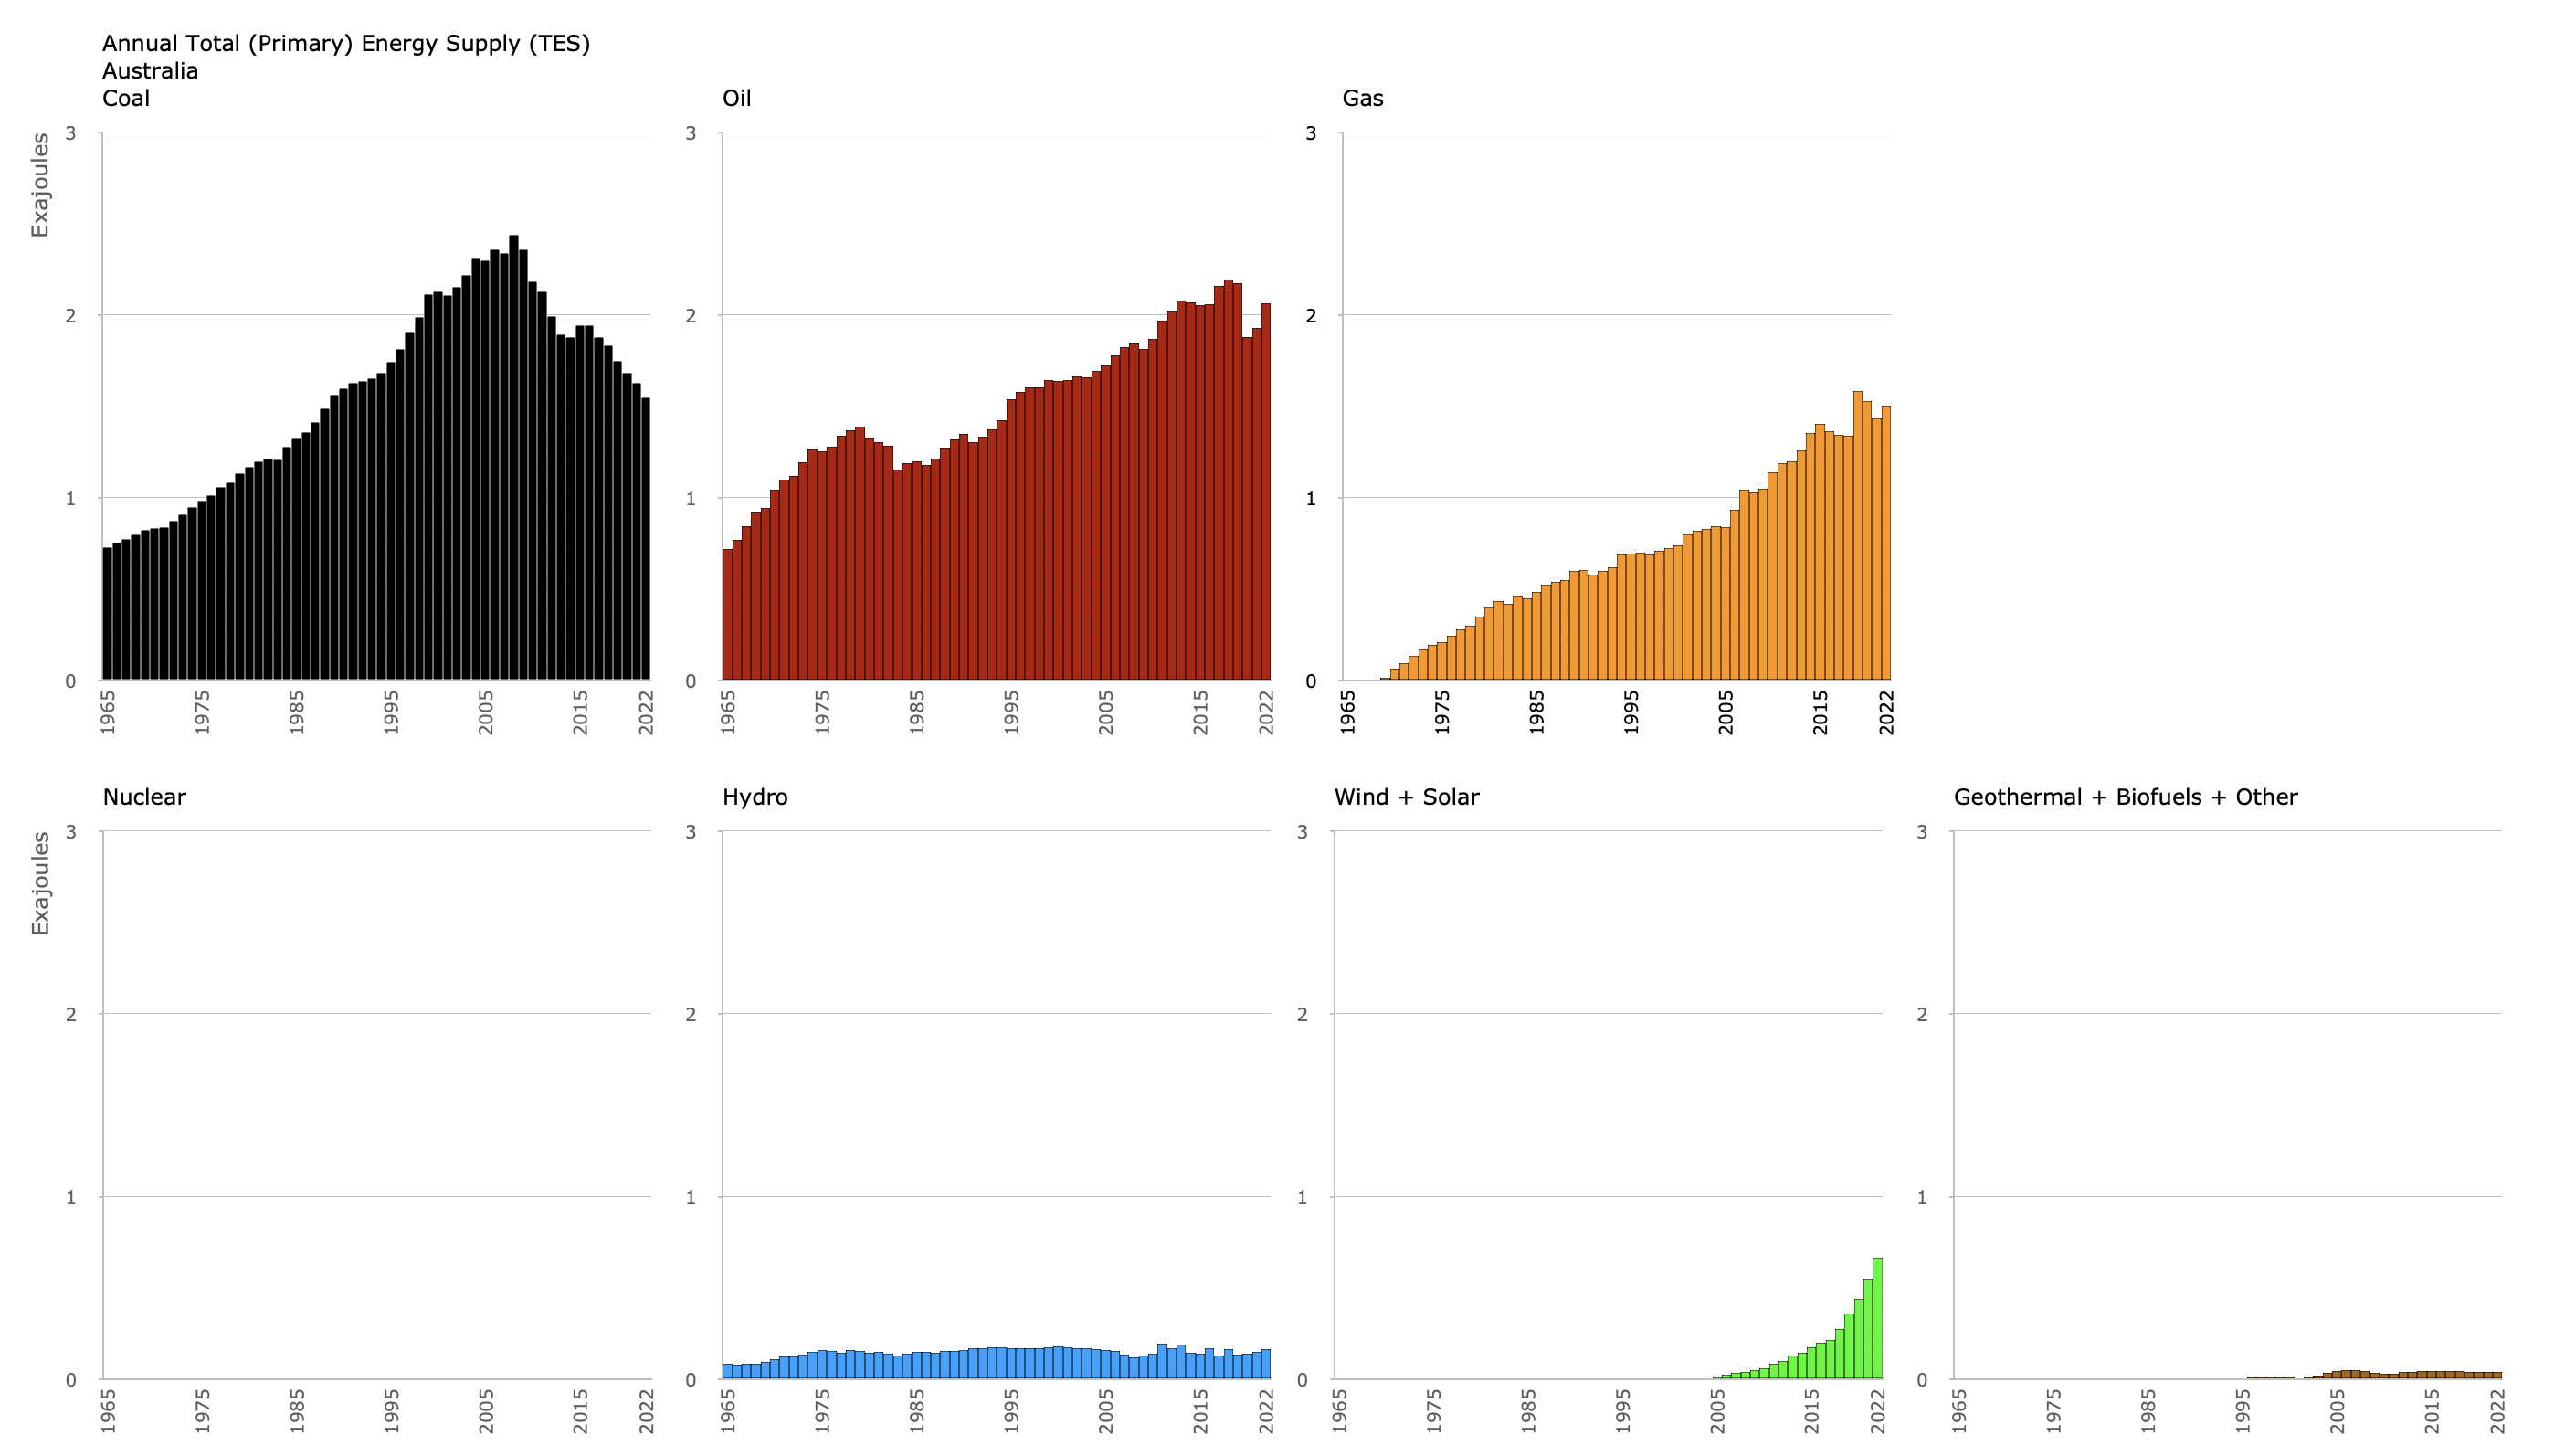
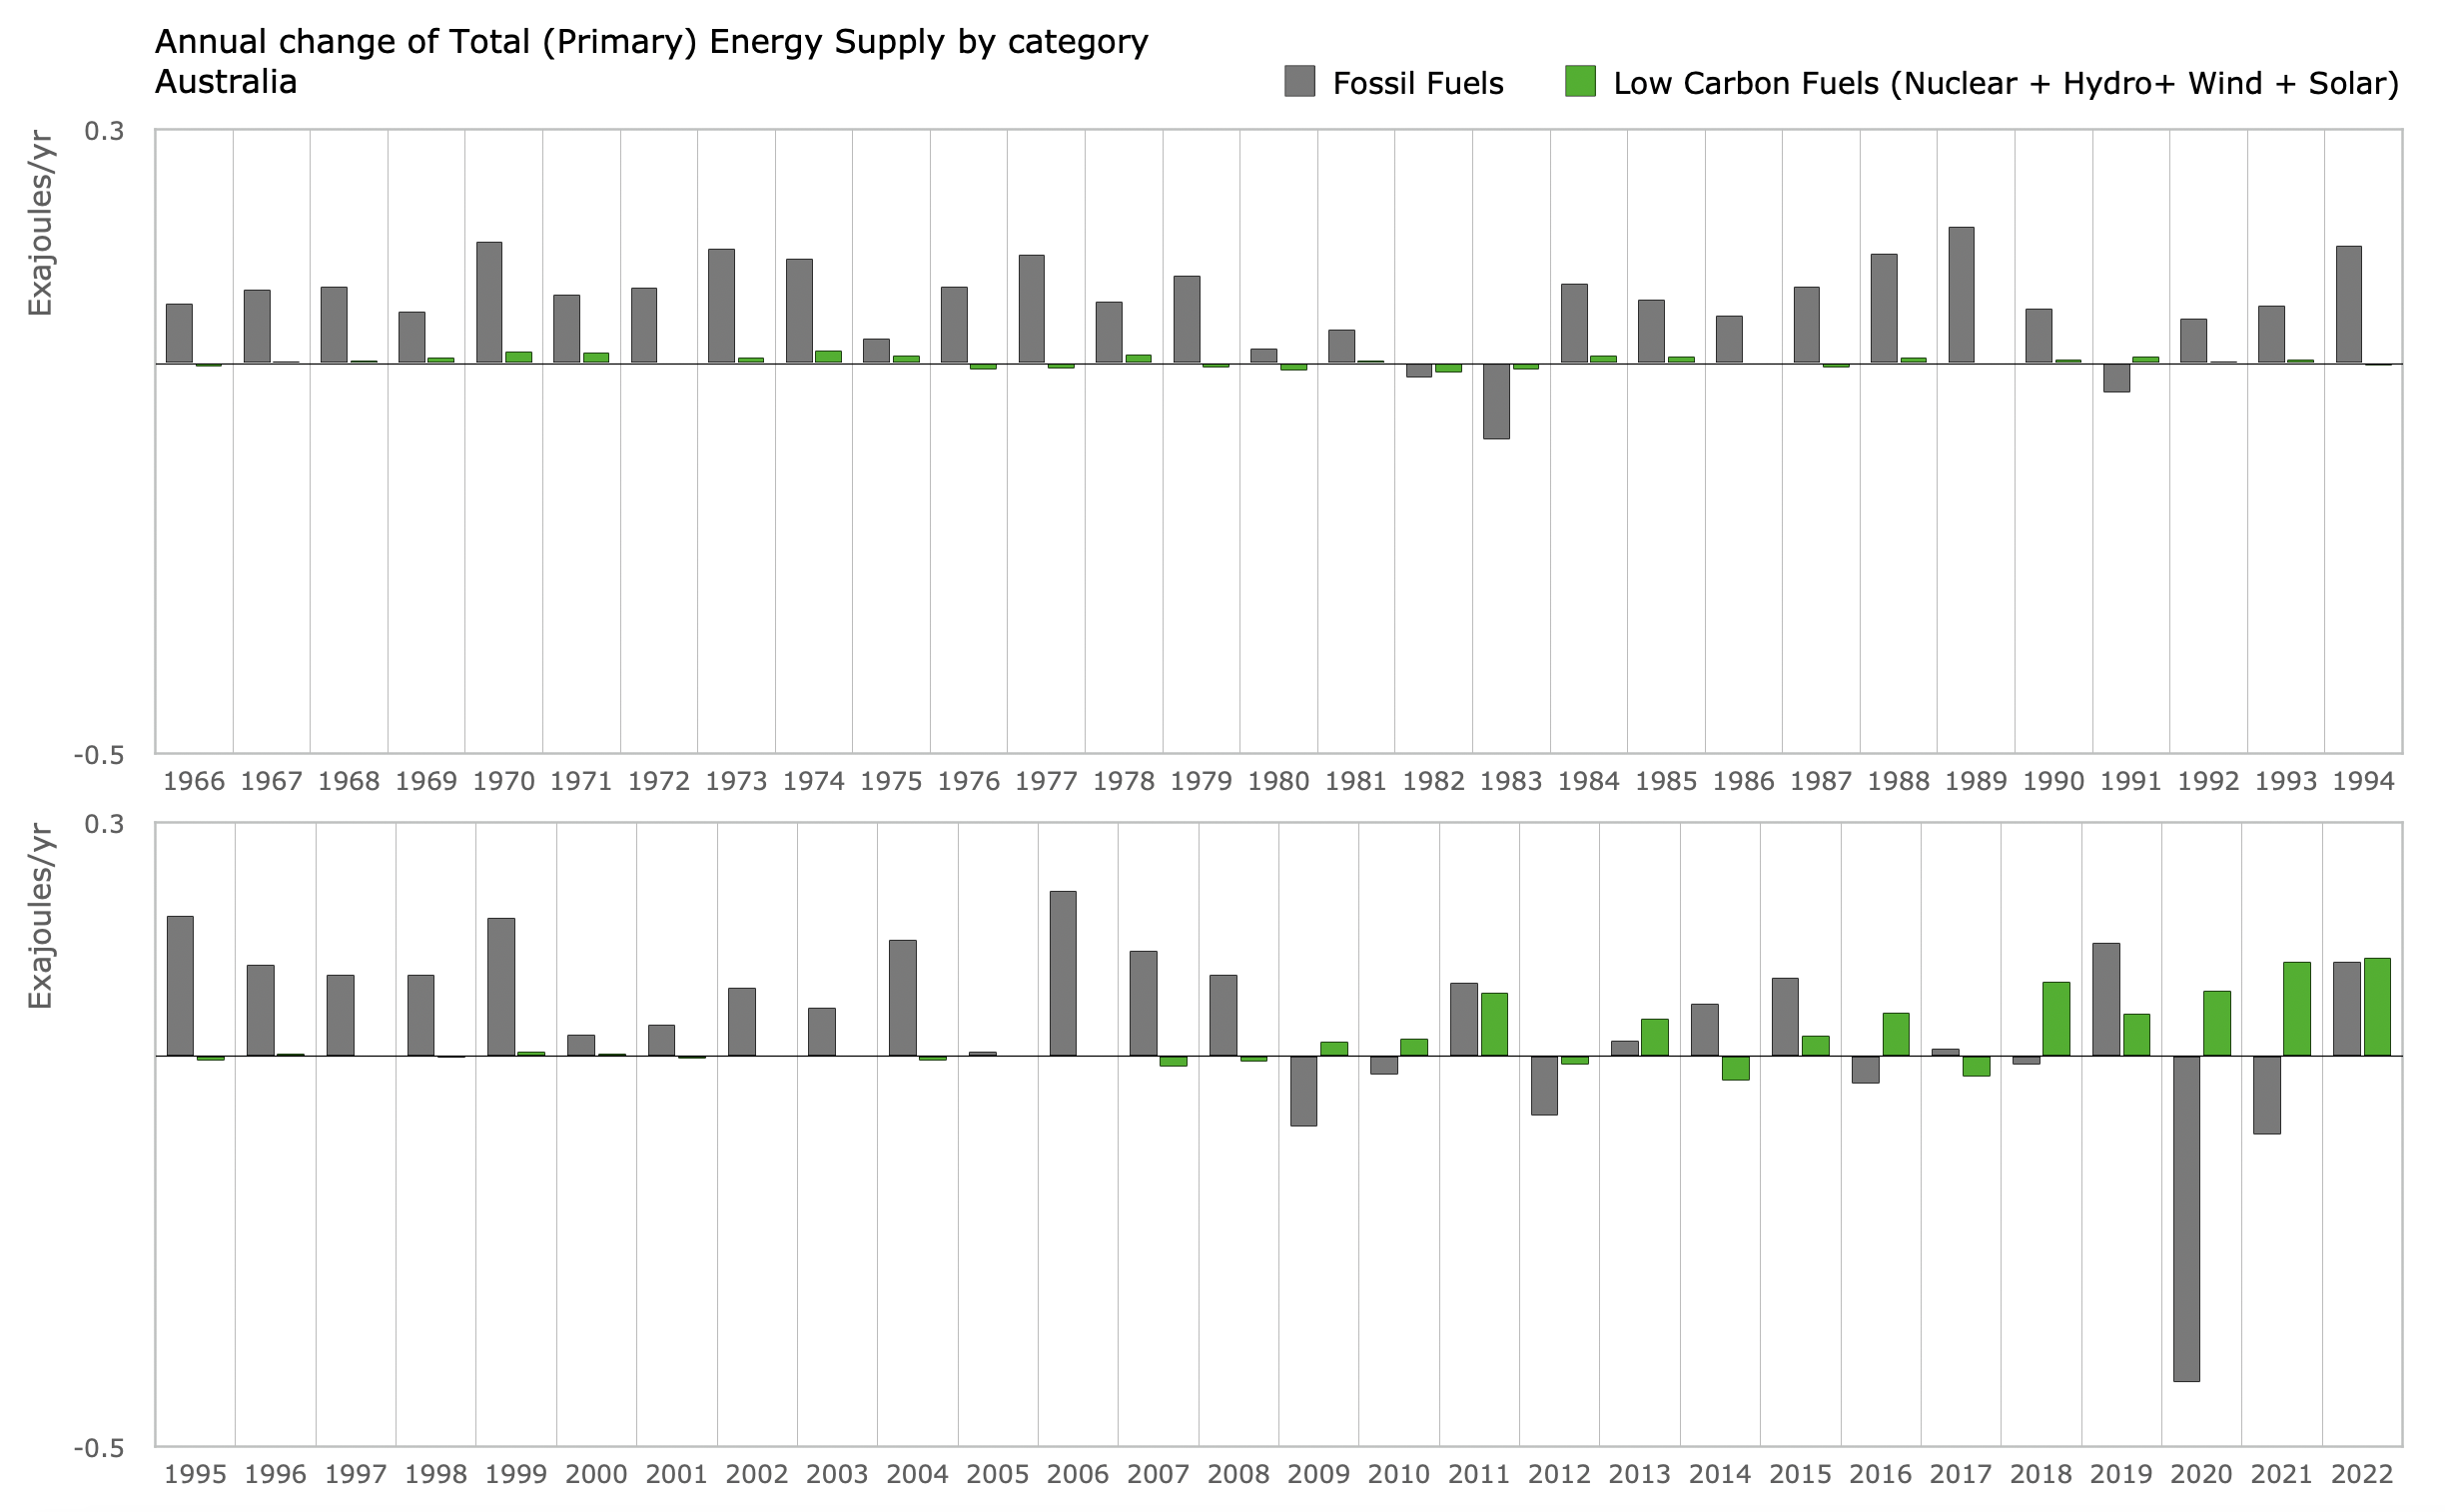
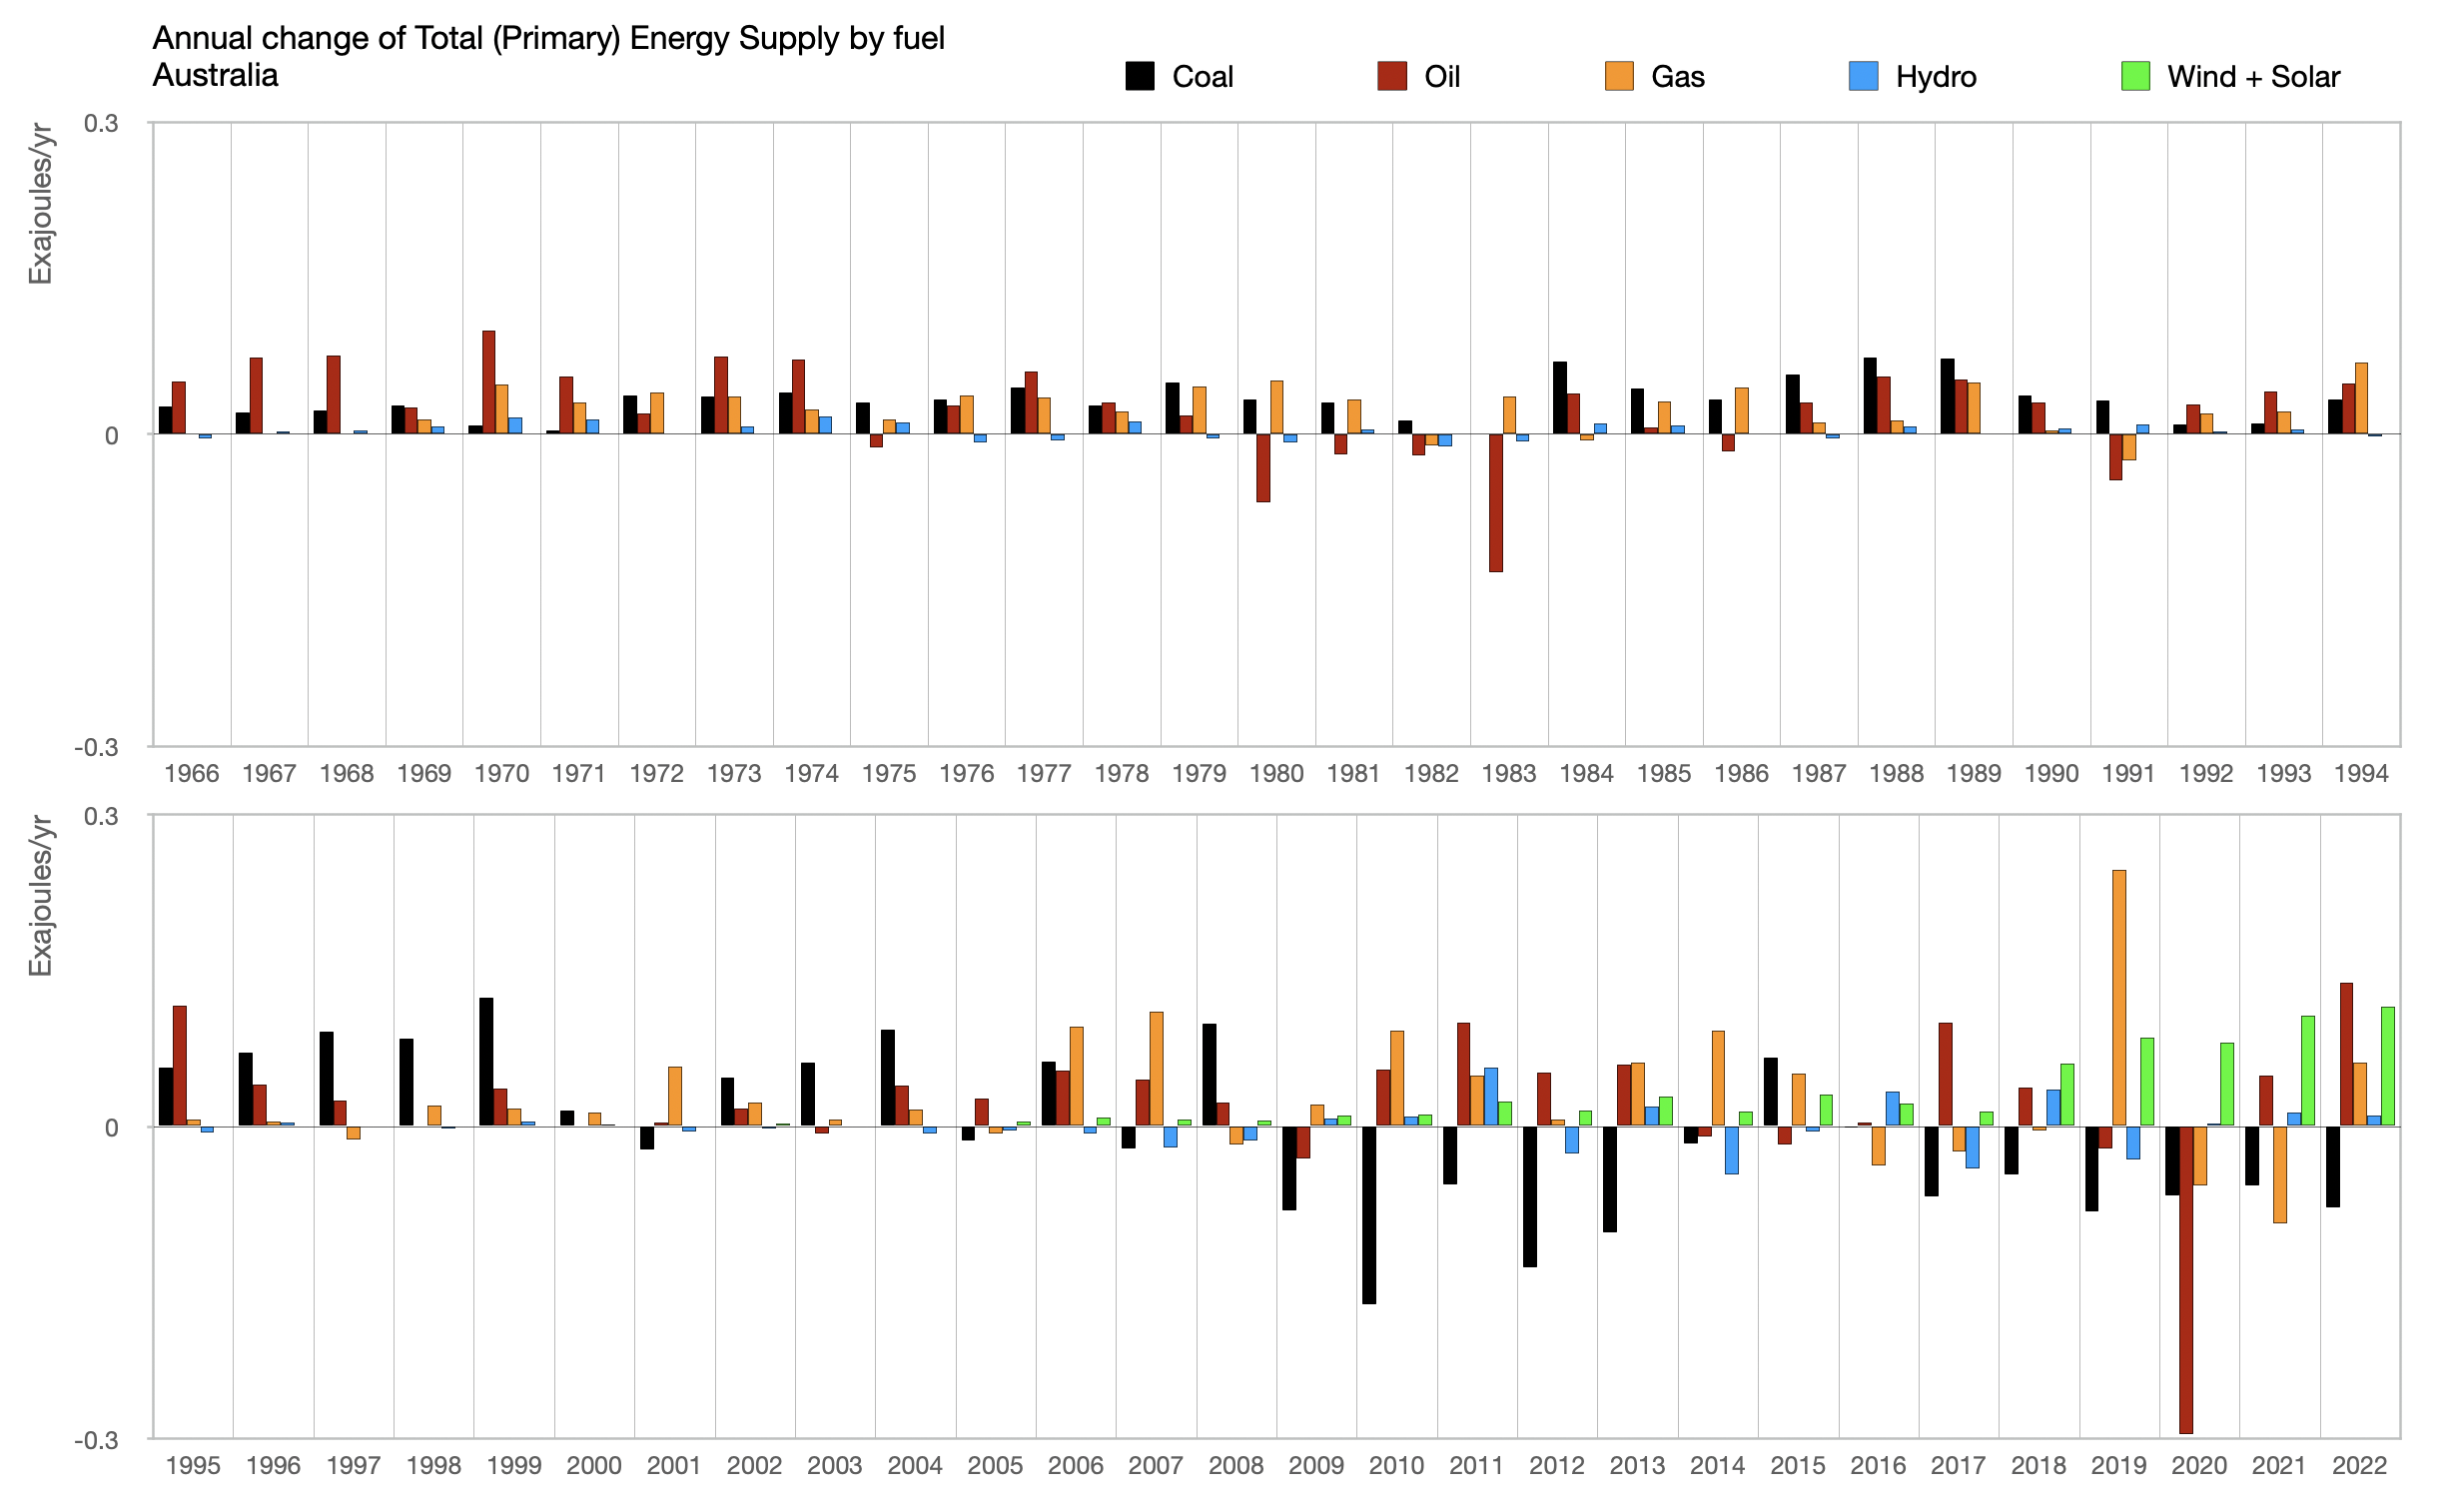
Total (Primary) Energy Supply

Total Energy Supply (also known as ‘Primary energy’) accounts for energy supplied prior to conversions to electricity or hydrogen (see the introduction for explanation).

Chart 3. Total (primary) energy by share in 2022. Data: Energy Institute Statistical Review of World Energy 20234.
Chart 4. Primary energy by annual share of category (left) and fuel (right). Data: Energy Institute Statistical Review of World Energy 20234.
Chart 5. Absolute values of annual primary energy by category. Data: Energy Institute Statistical Review of World Energy 20234.
Chart 6. Absolute values of annual primary energy by fuel. Data: Energy Institute Statistical Review of World Energy 20234.
Chart 7. Annual change of primary energy by category. Data: Energy Institute Statistical Review of World Energy 20234.
Chart 8. Annual change of primary energy by fuel. Data: Energy Institute Statistical Review of World Energy 20234.

Carbon Intensity

Chart 9. Annual carbon intensity of primary energy. Data: Calculated using Energy Institute Statistical Review of World Energy 20234.

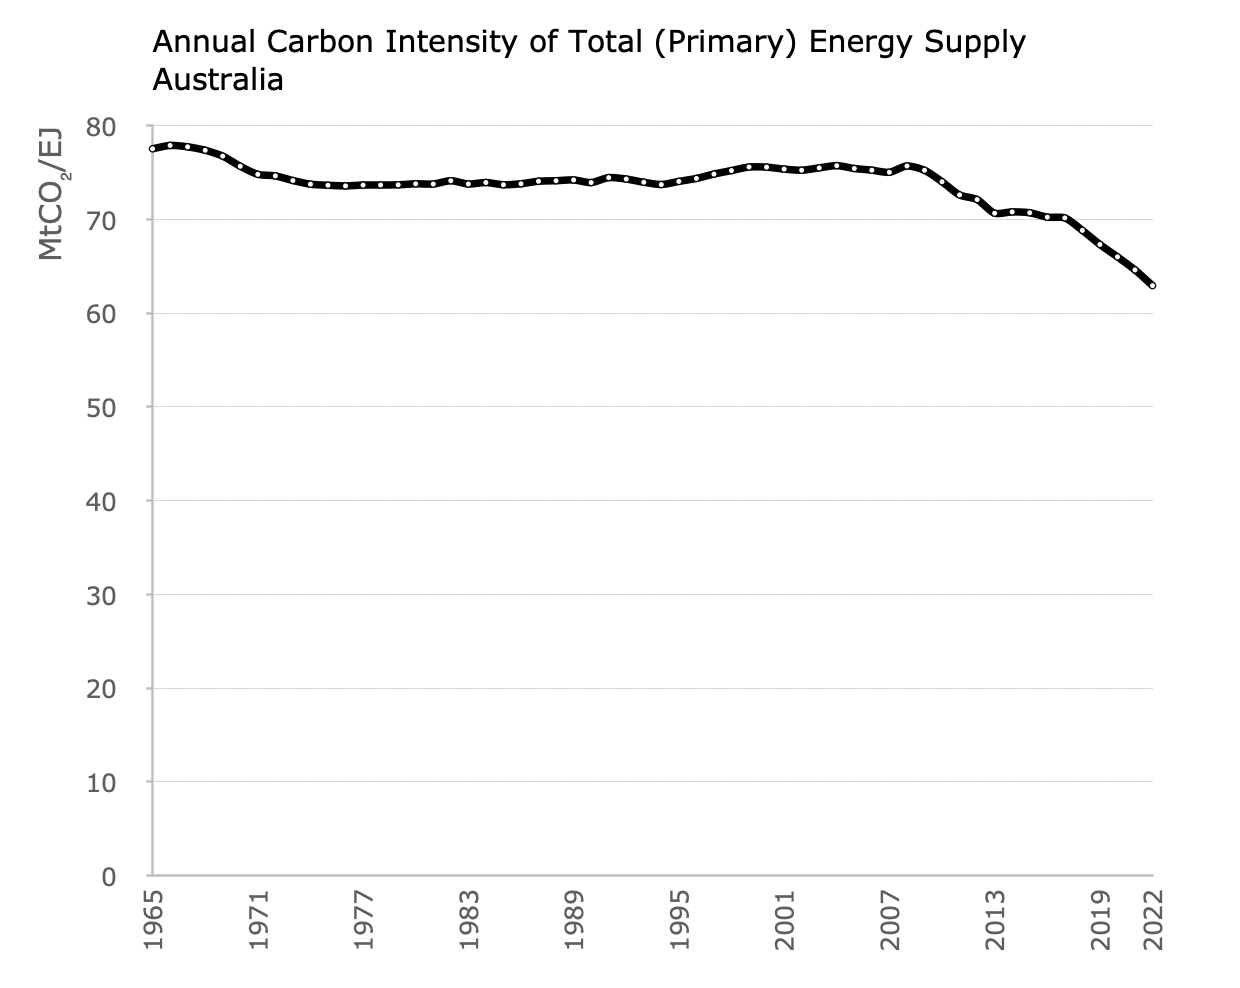
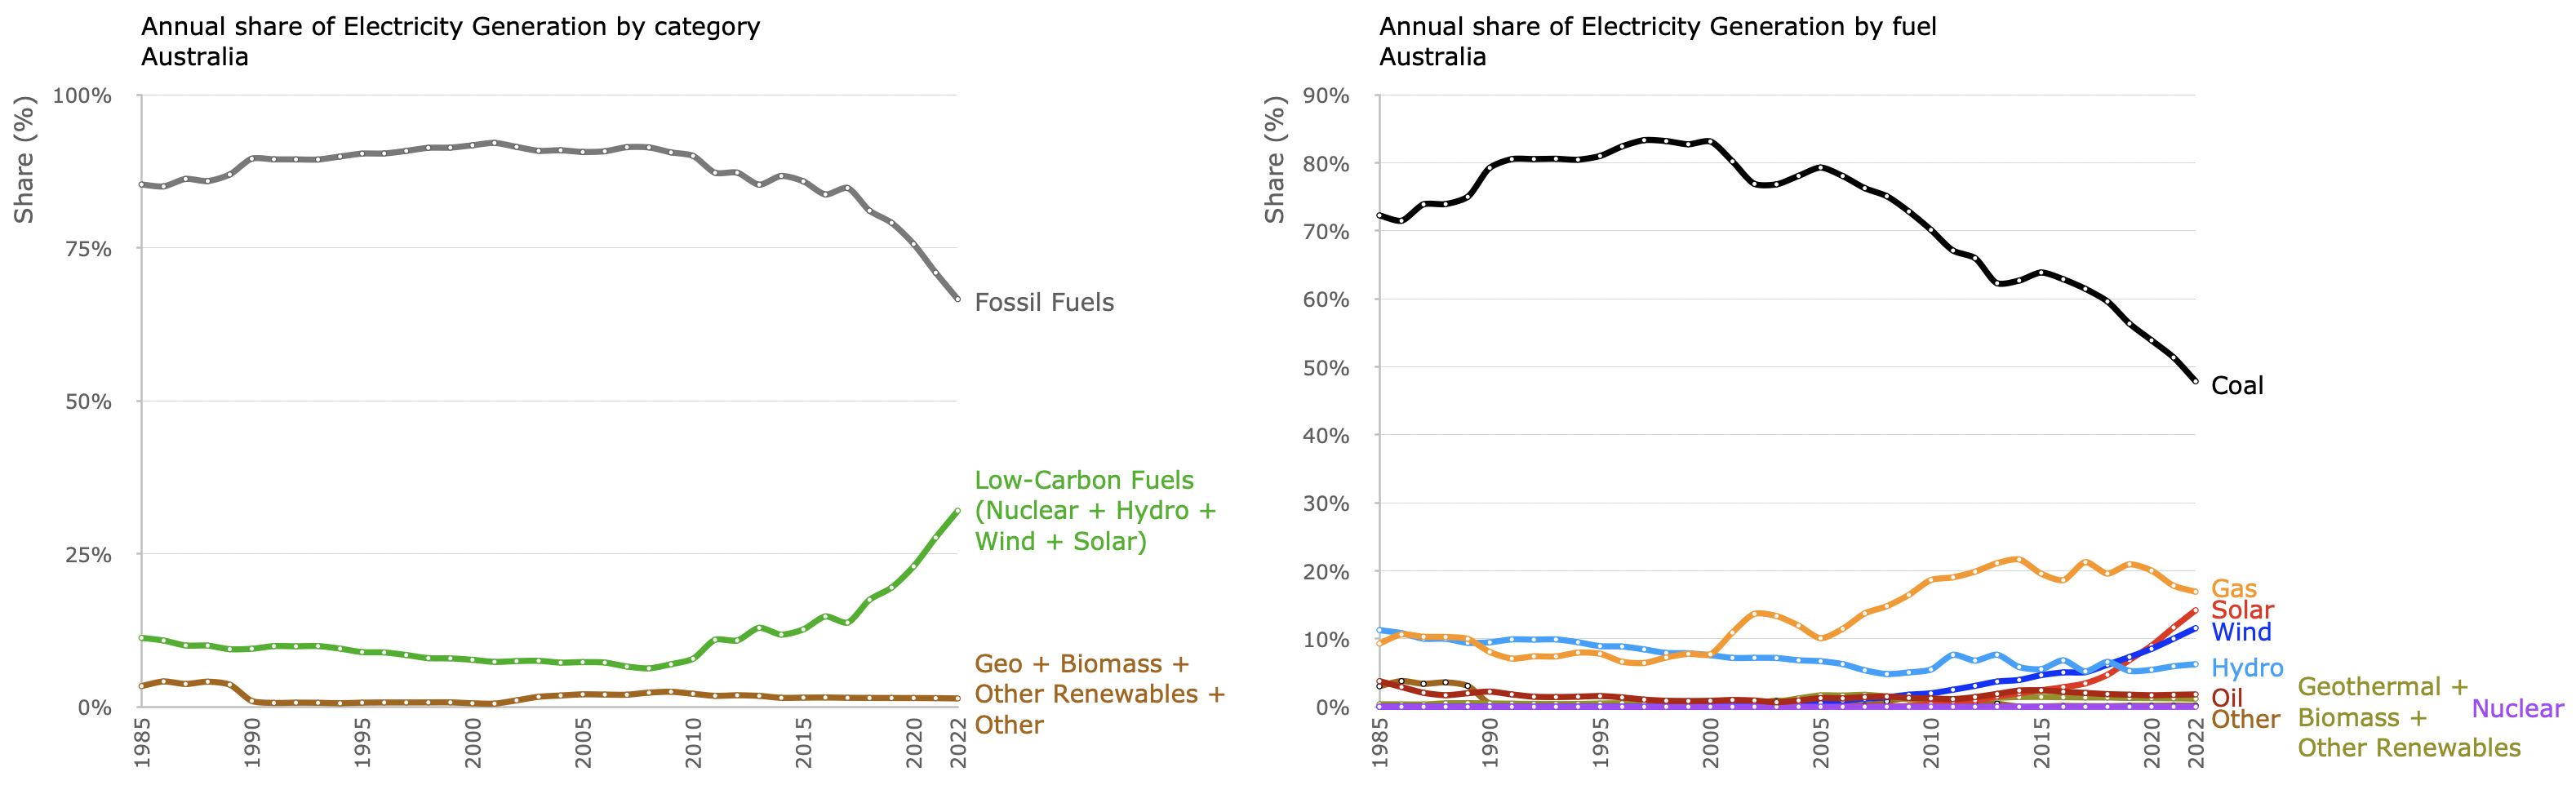
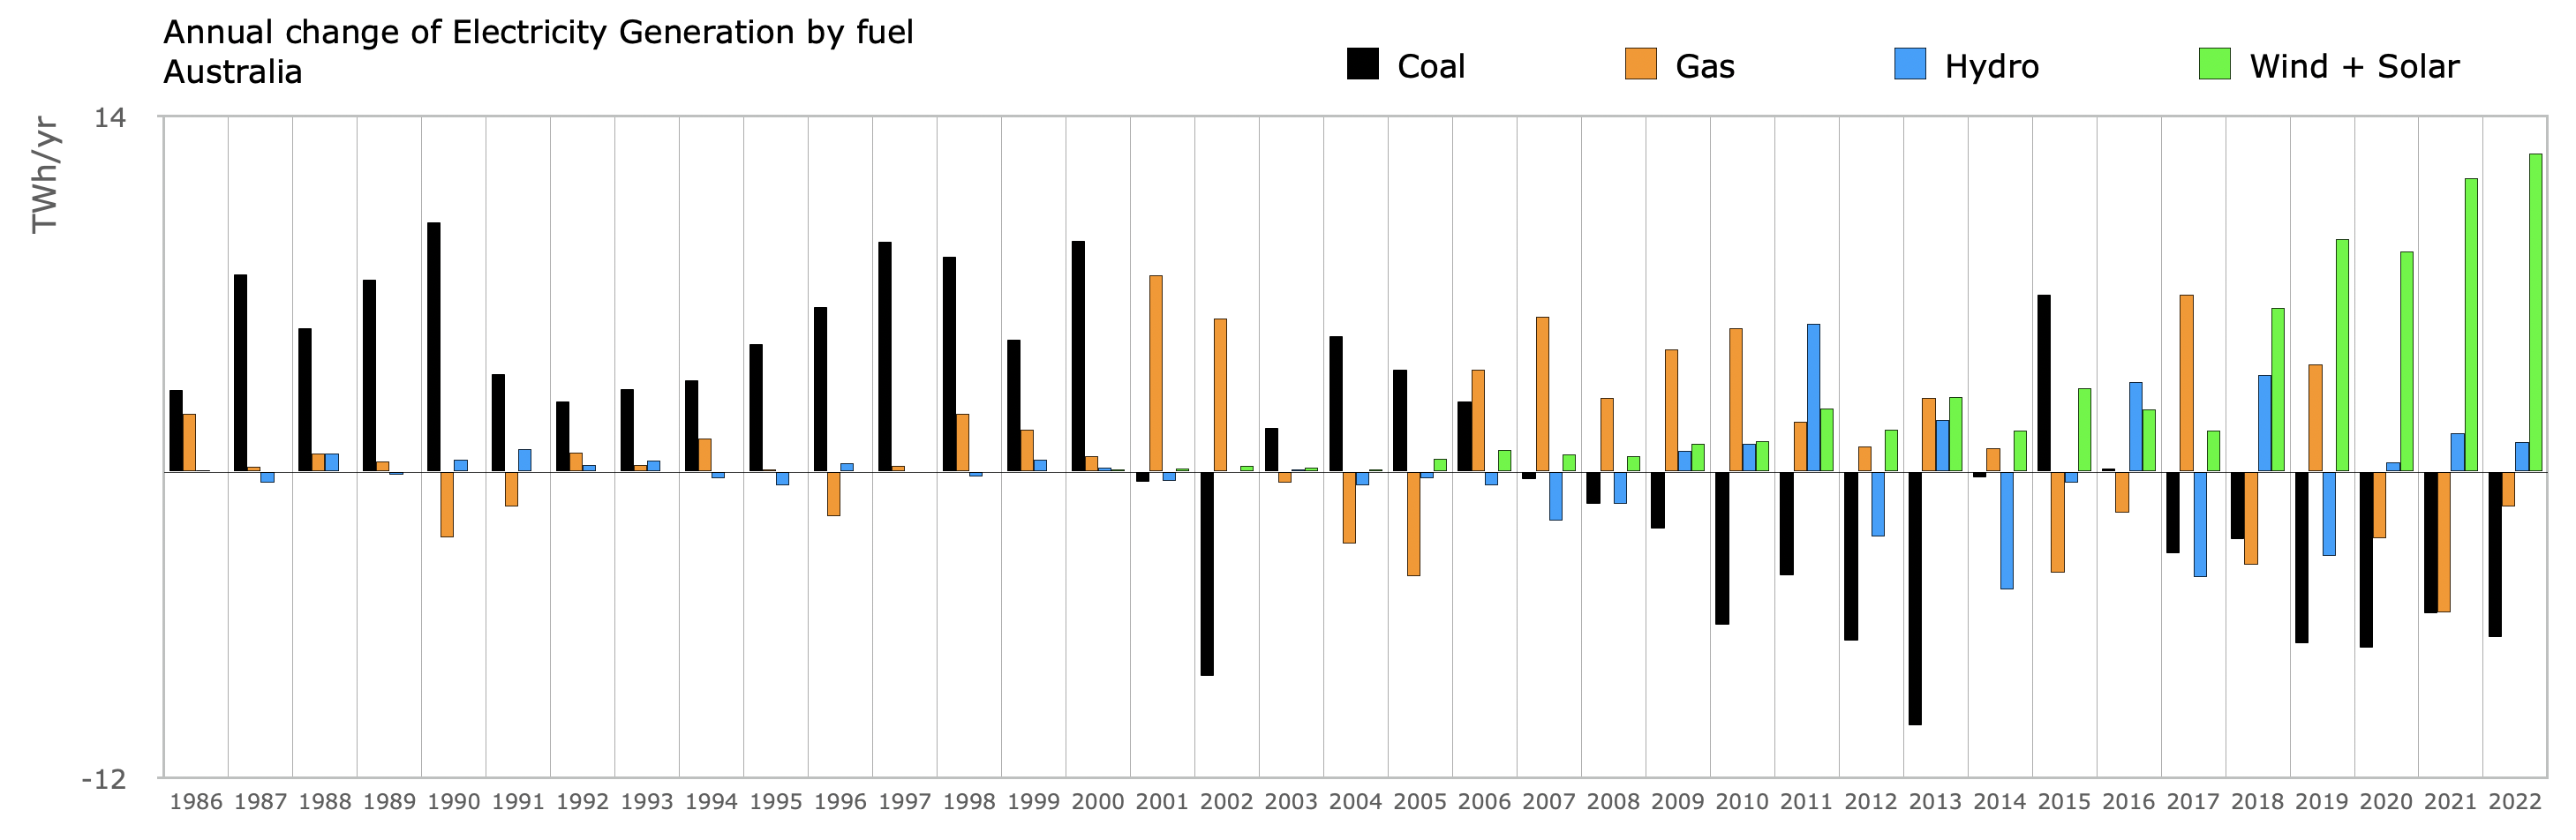
The recent decline of carbon intensity is mainly due to additions of wind and solar electricity, and subtractions of coal fired electricity. Despite this, the value in 2022 still exceeded that of most countries6.

Energy Consumption (i.e. Final Energy)

Final energy accounts the consumption of energy in final forms, and therefore can account for electricity separately from heat (e.g energy consumed for steel manufacture, or by transport). Unlike primary energy, final energy does not rely on calculating equivalences for non-combustible fuels such as solar and wind (see the introduction for explanation).

Chart 10. Energy consumption (i.e final energy) by share, Australia. Data: IEA(2023)7.
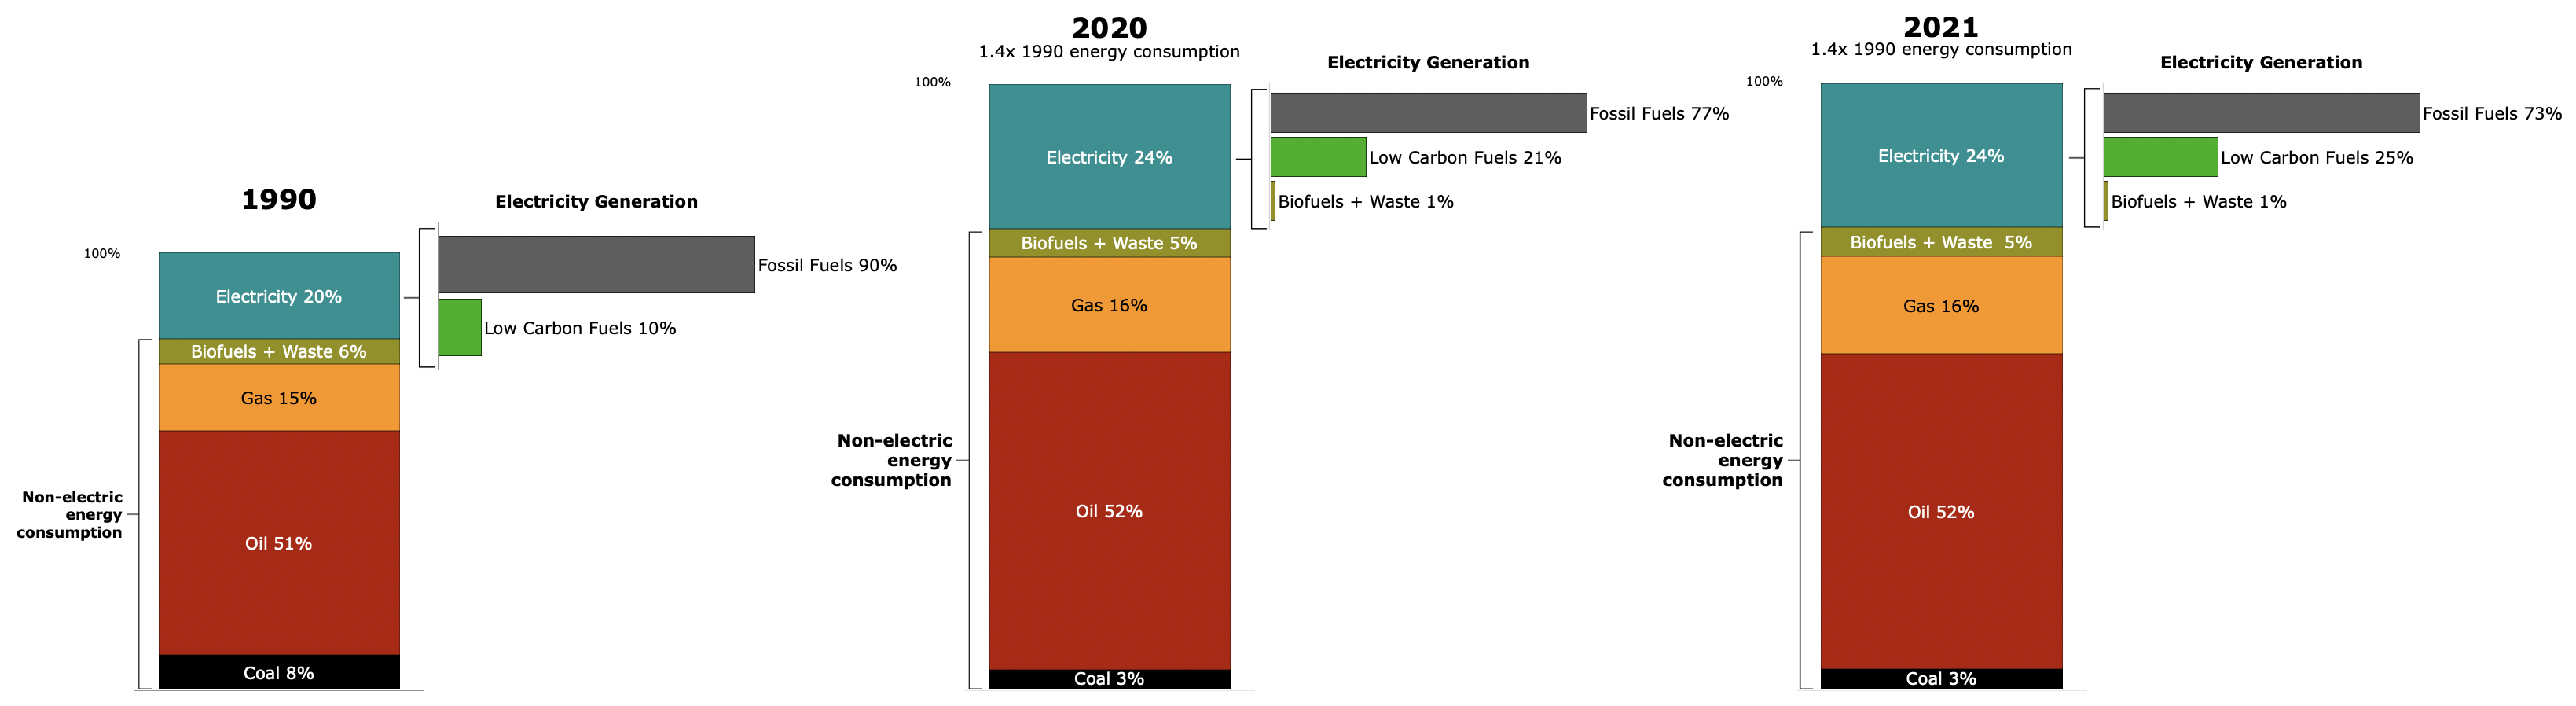
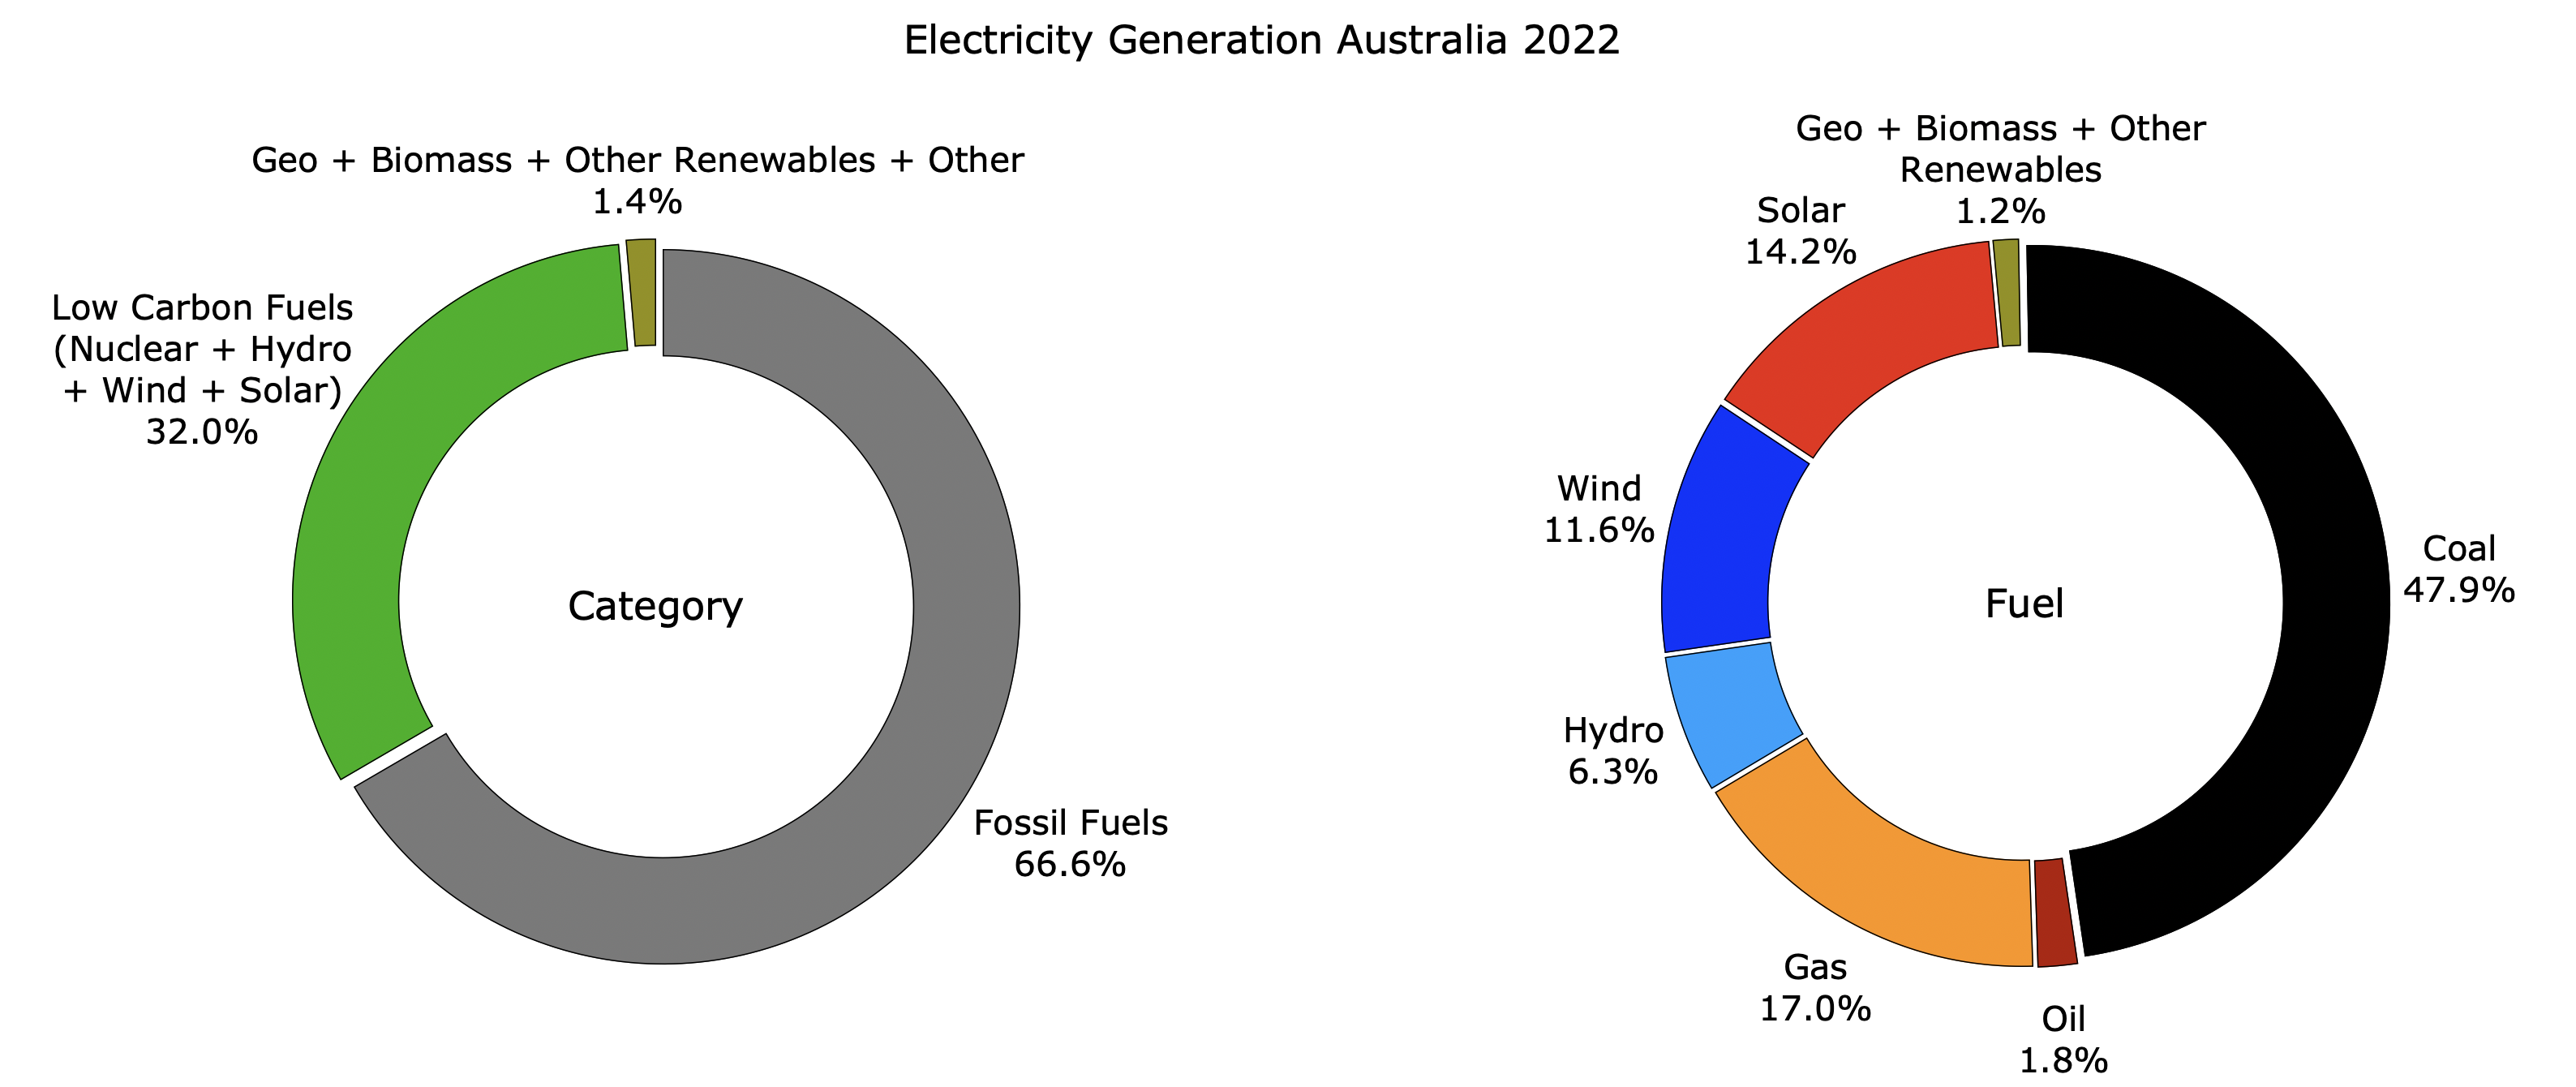
Total of displayed shares will not equal 100% because, for clarity, values are rounded and segments <1% share are not shown.
The height of each column is the total annual energy consumption relative to 1990.
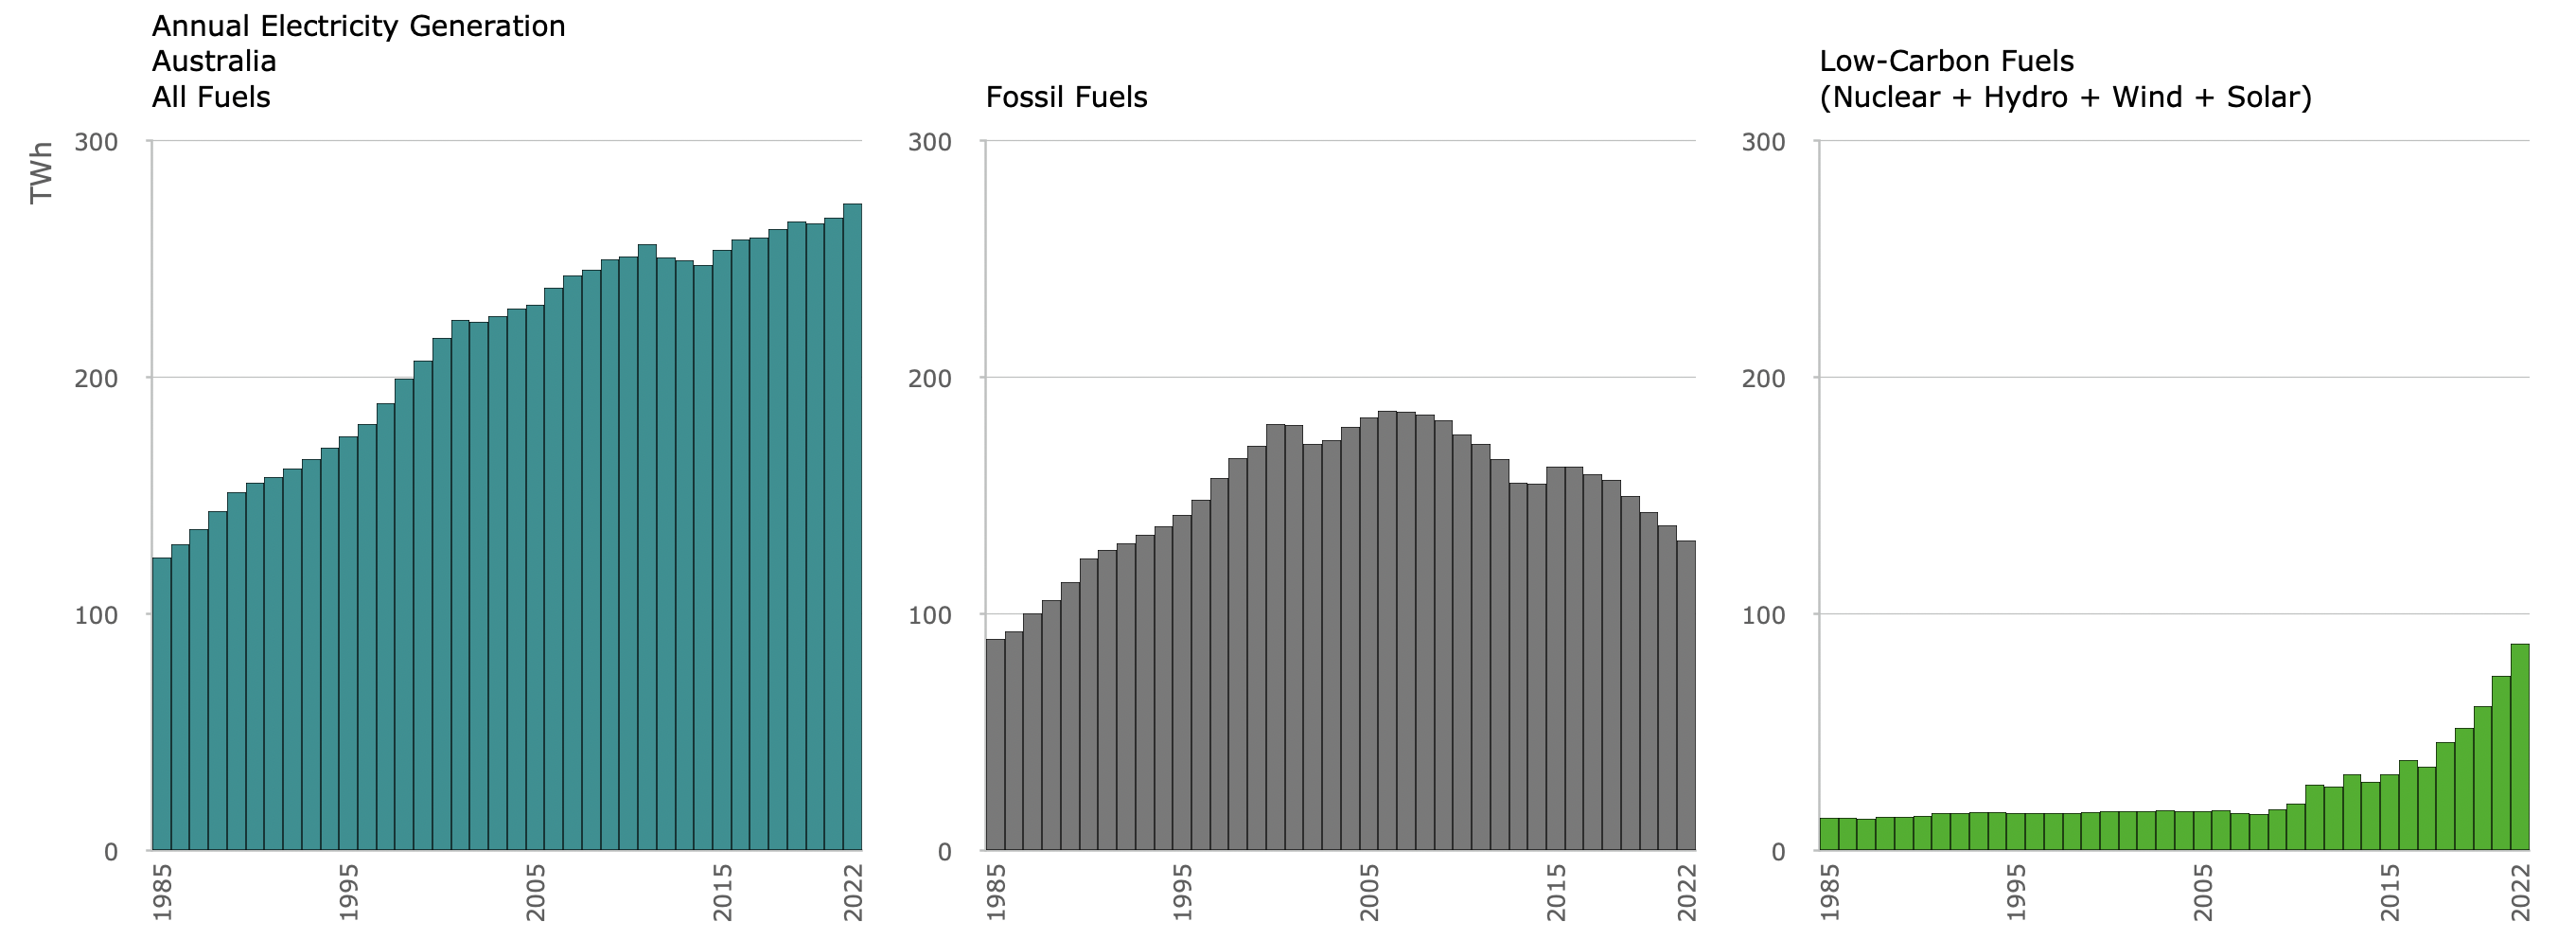
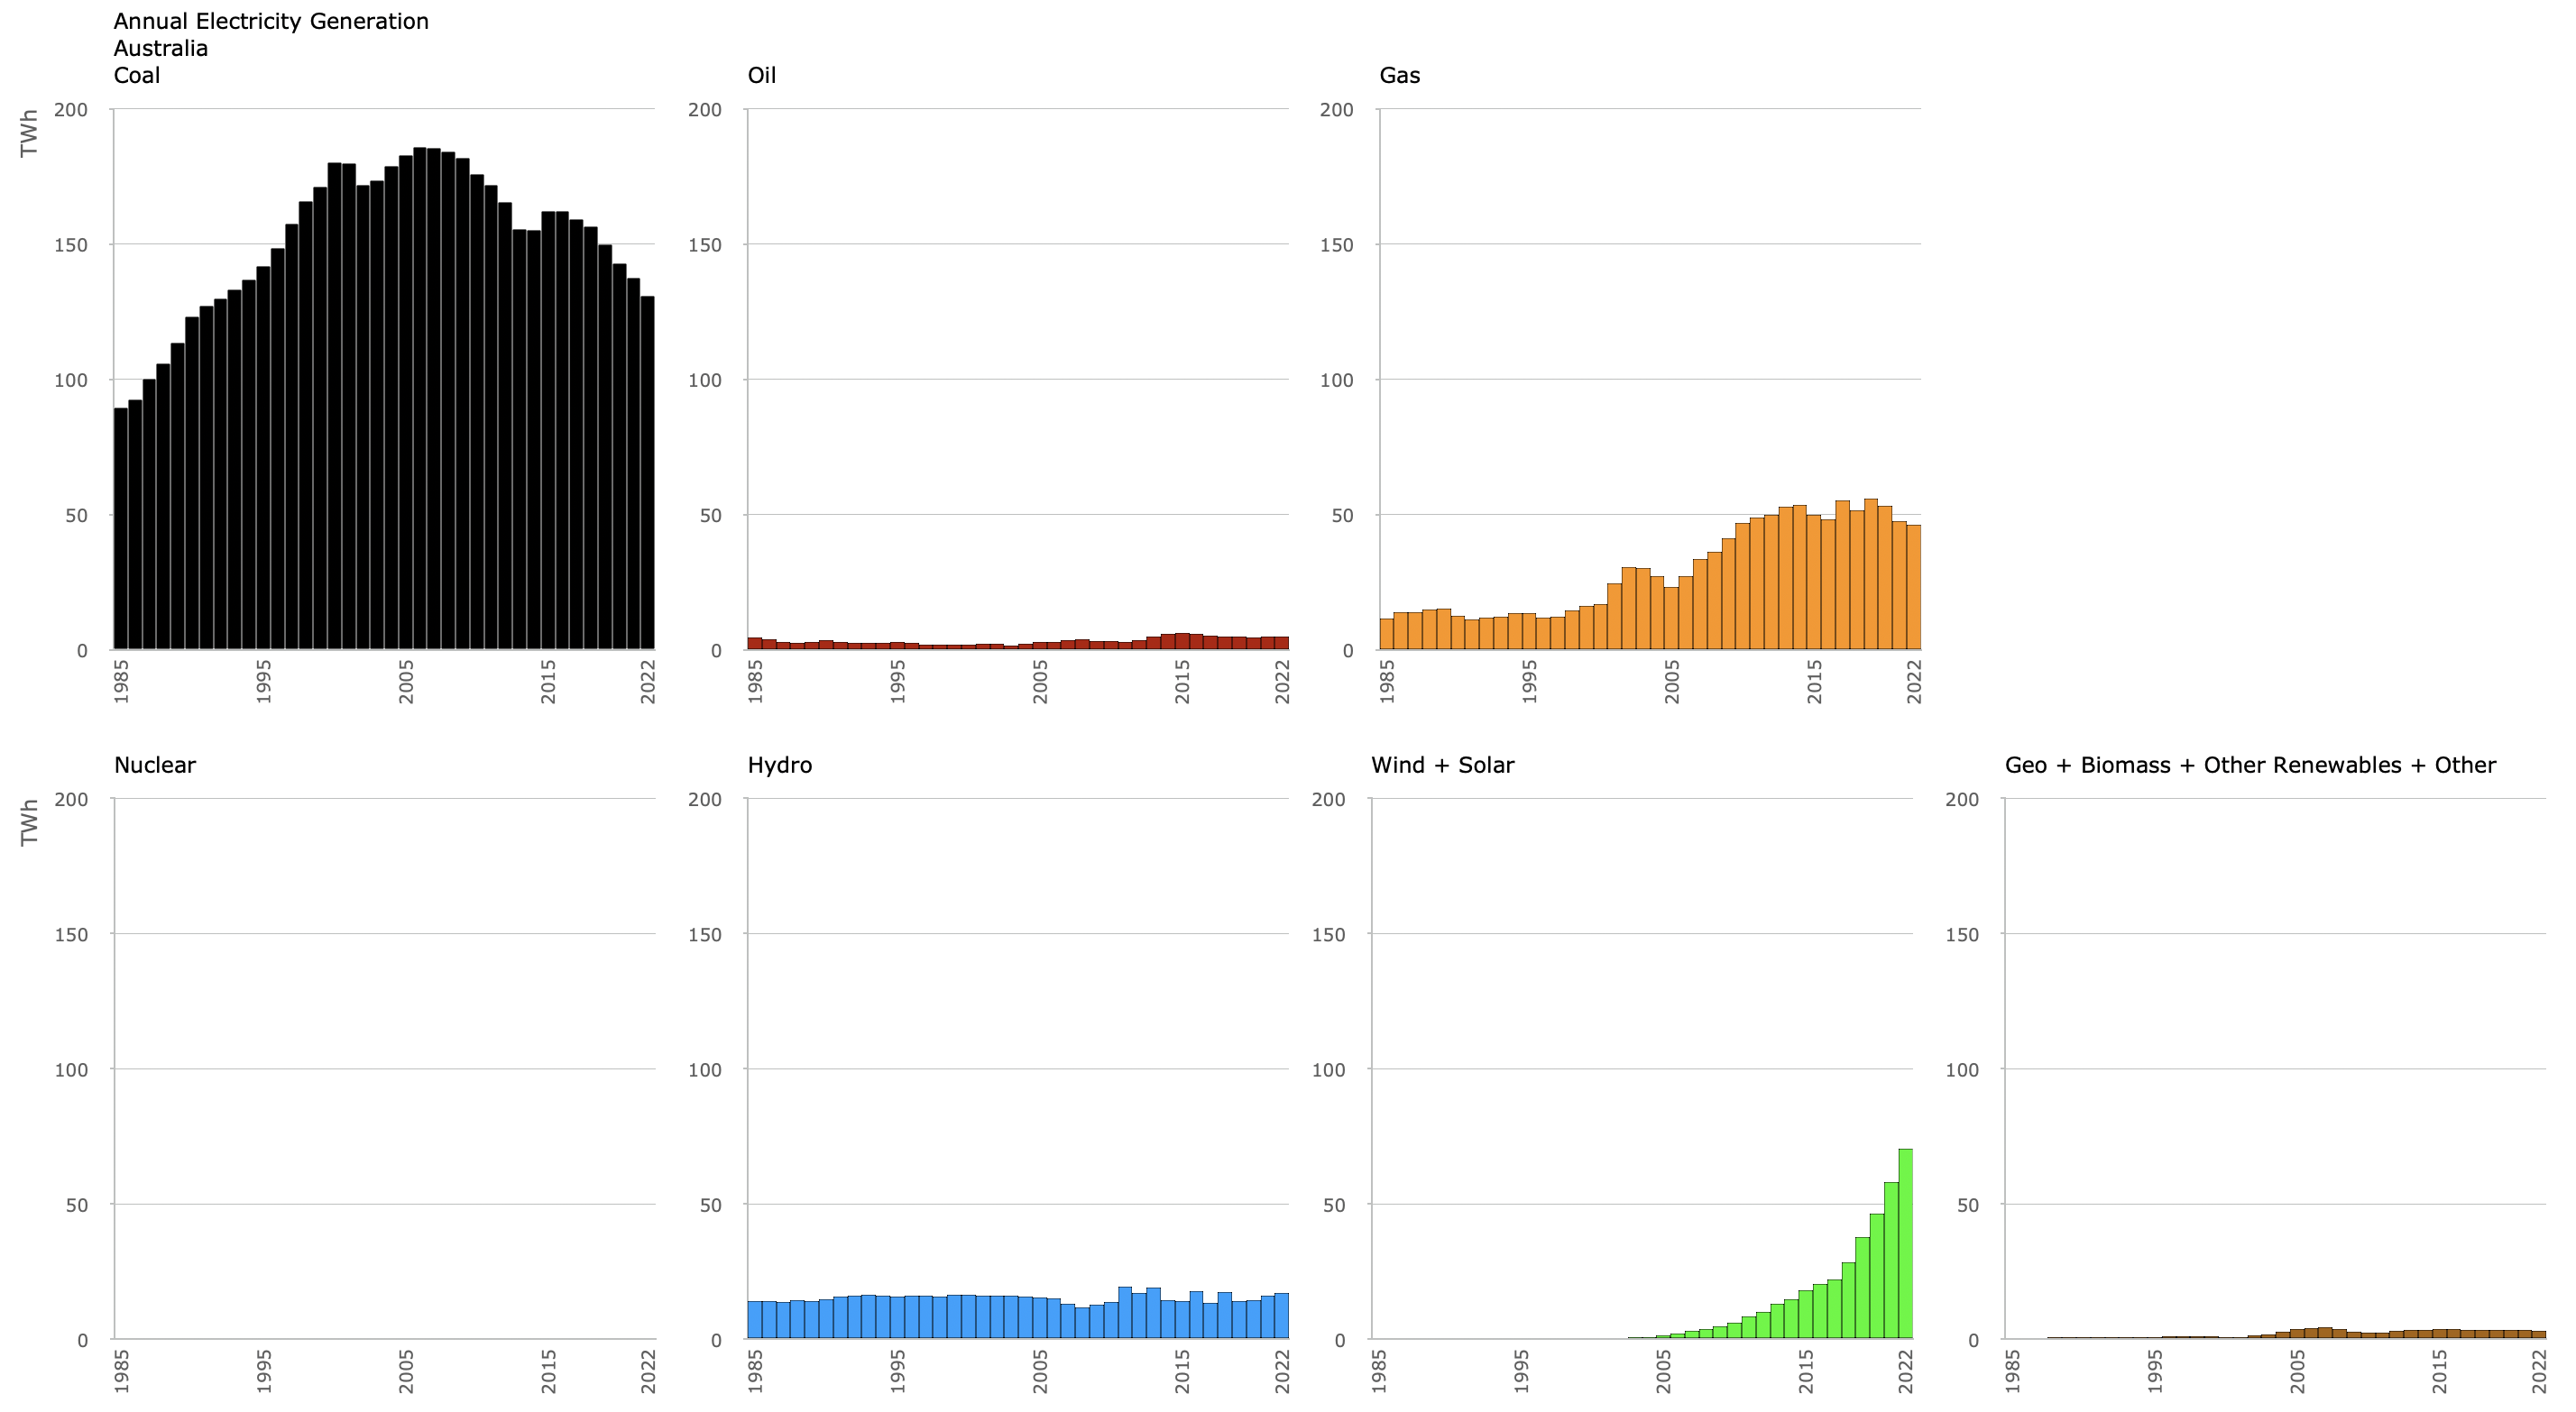
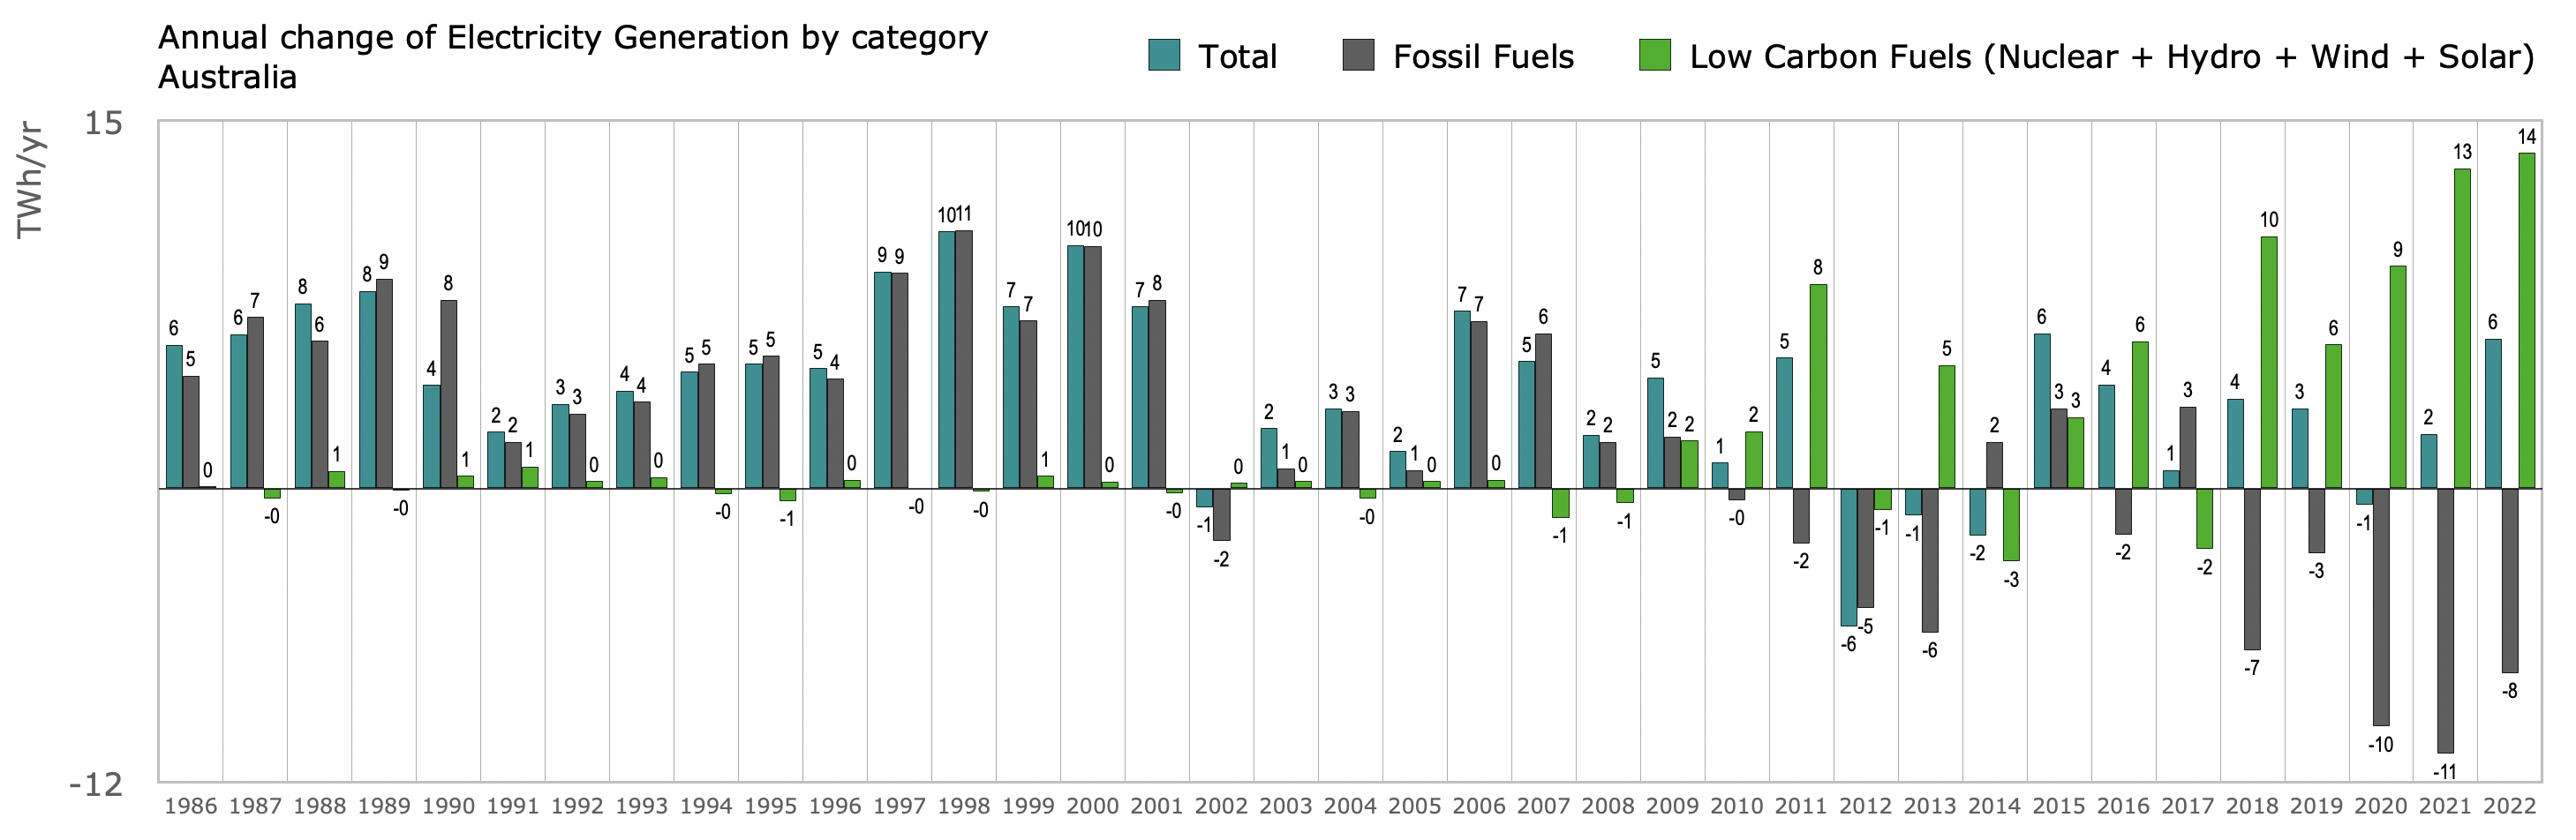
Electricity

Chart 11. Electricity generation by share in 2022. Data: Energy Institute Statistical Review of World Energy 20234.
Chart 12. Electricity generation by annual share of category (left), and fuel (right). Data: Energy Institute Statistical Review of World Energy 20234.
Chart 13. Annual electricity generation, by category. Data: Energy Institute Statistical Review of World Energy 20234. For clarity, categories ‘Geo, Biomass and Other renewables’ and ‘Other’ are not shown.
Chart 14. Annual electricity generation, by fuel. Data: Energy Institute Statistical Review of World Energy 20234.
Chart 15. Annual change of electricity generation, by category. Data: Energy Institute Statistical Review of World Energy 20234. For clarity, categories ‘Geo, Biomass and Other renewables’ and ‘Other’ are not shown. Annual changes are shown at the top of each column, values rounded.
Chart 16. Annual change of electricity generation, by fuel. Data: Energy Institute Statistical Review of World Energy 20234. For clarity, categories ‘Geo, Biomass and Other renewables’ and ‘Other’ are not shown.
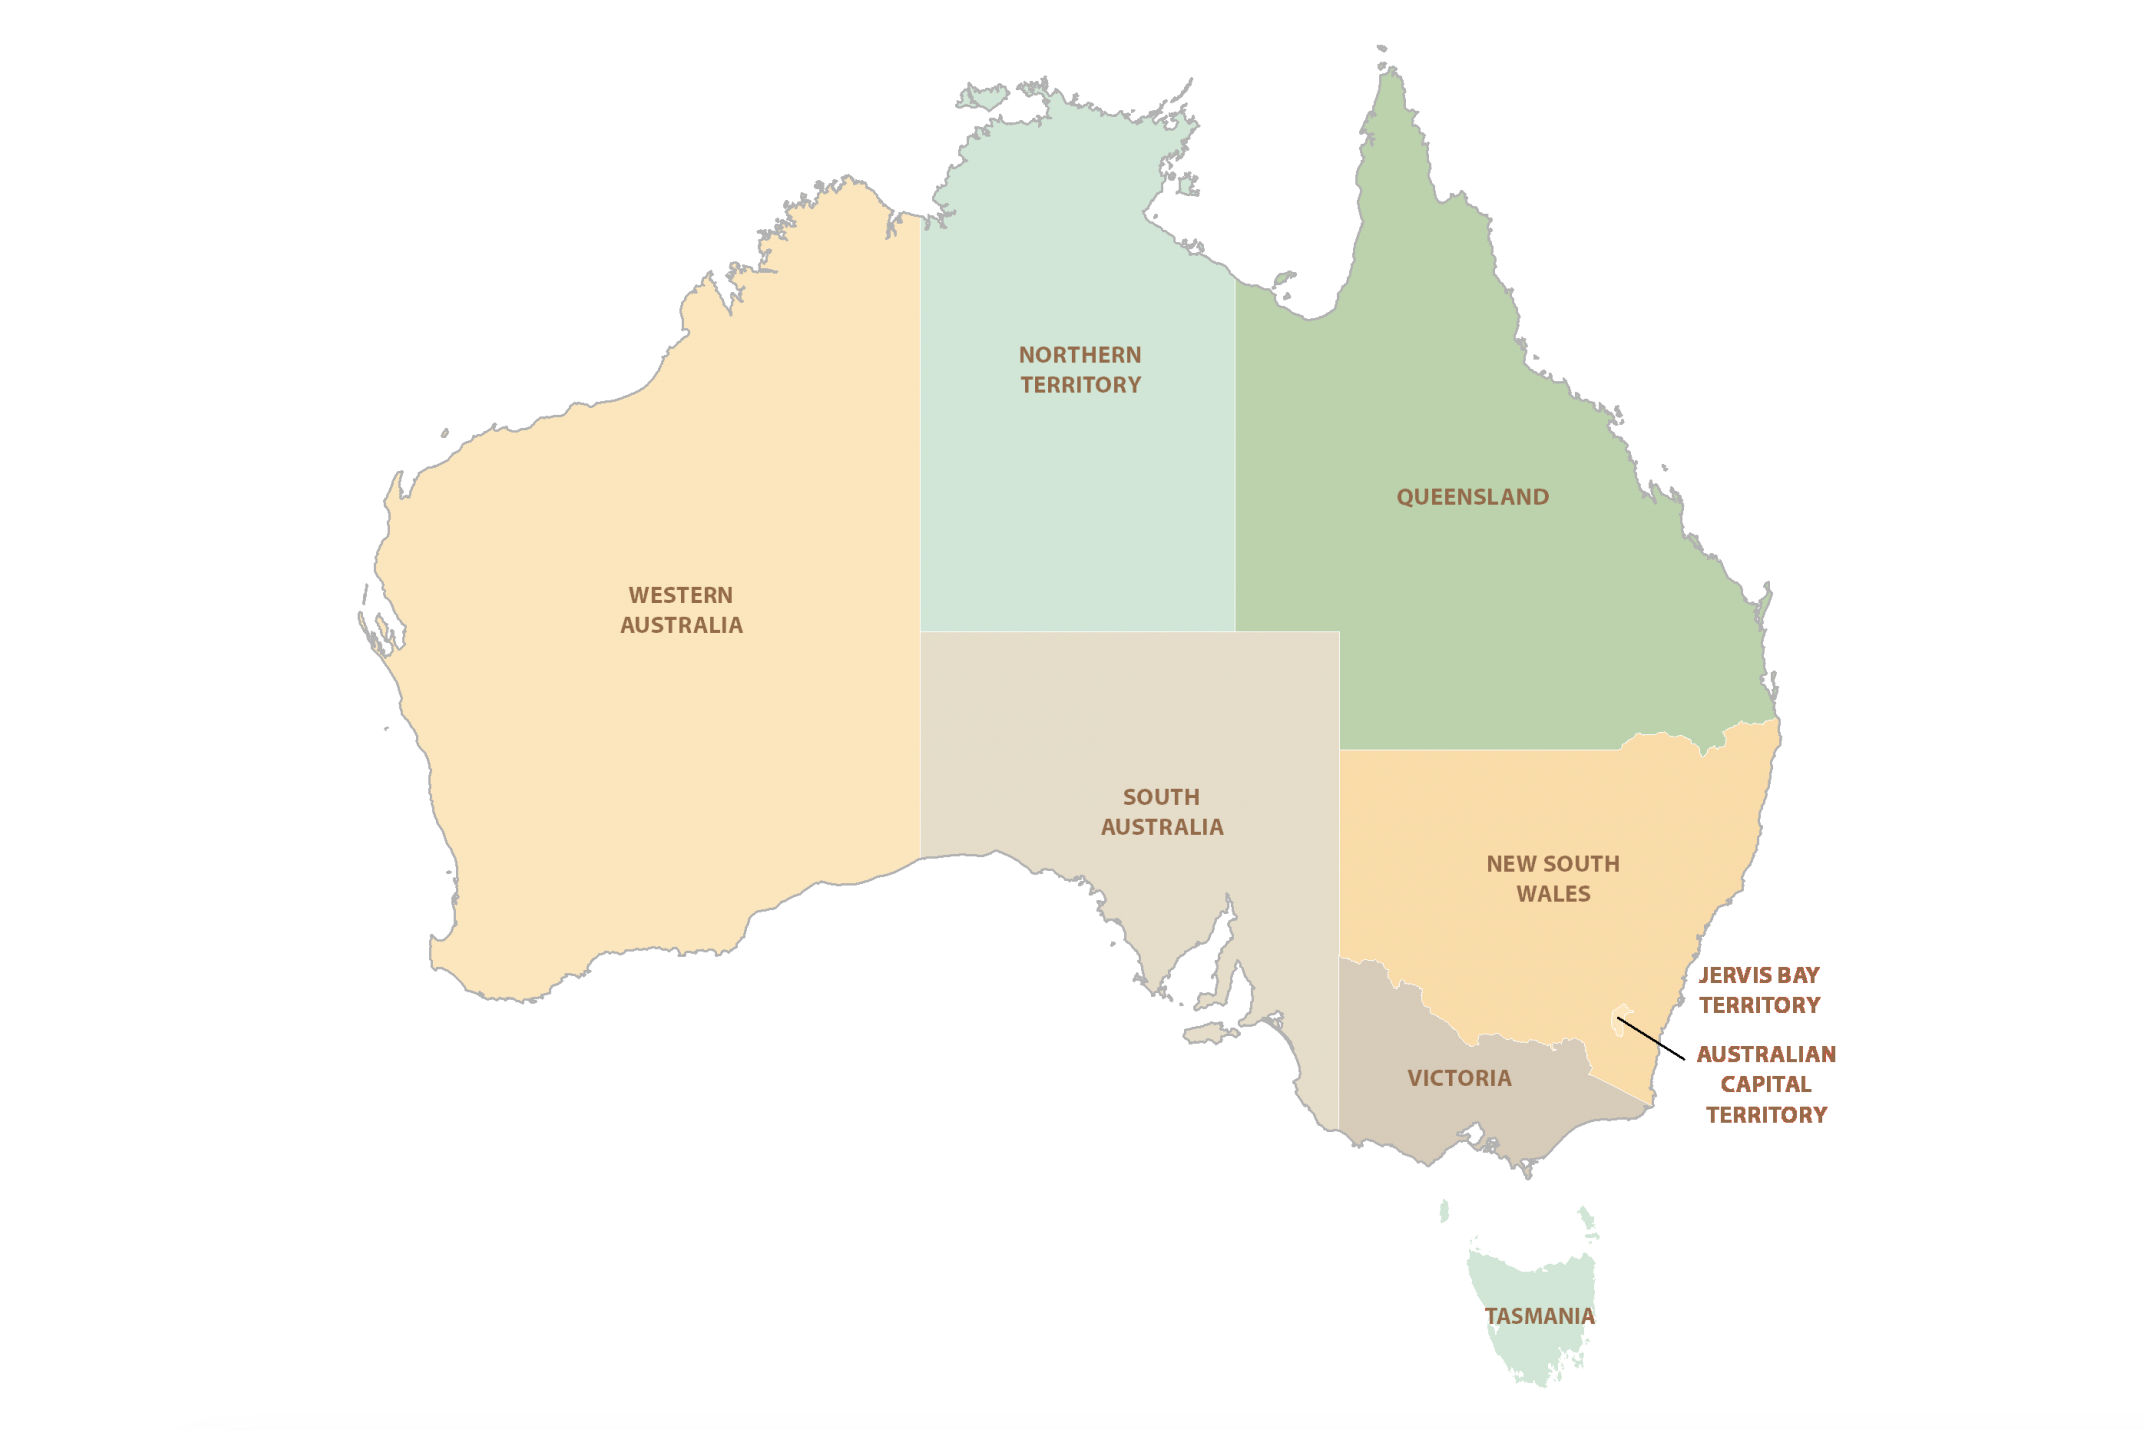
  1. https://gisgeography.com/australia-map/[]
  2. https://www.worldenergydata.org/world-fossil-fuel-production-and-primary-energy/, year 2022.[][]
  3. https://www.worldenergydata.org/carbon-rankings/, year 2021.[][]
  4. https://www.energyinst.org/statistical-review/about[][][][][][][][][][][][][][][]
  5. Sheets used from the data were: 1. ‘Coal Production – Tonnes’. 2. ‘Oil Production – Barrels’. Annual figure calculated. 3. ‘Gas Production – Bcm’.[]
  6. https://www.worldenergydata.org/carbon-intensity/[]
  7. https://www.iea.org/data-and-statistics/data-tools/energy-statistics-data-browser?country=AUSTRALI&energy=Balances&year=2021[]