Updated January 2024.
Fossil fuel production
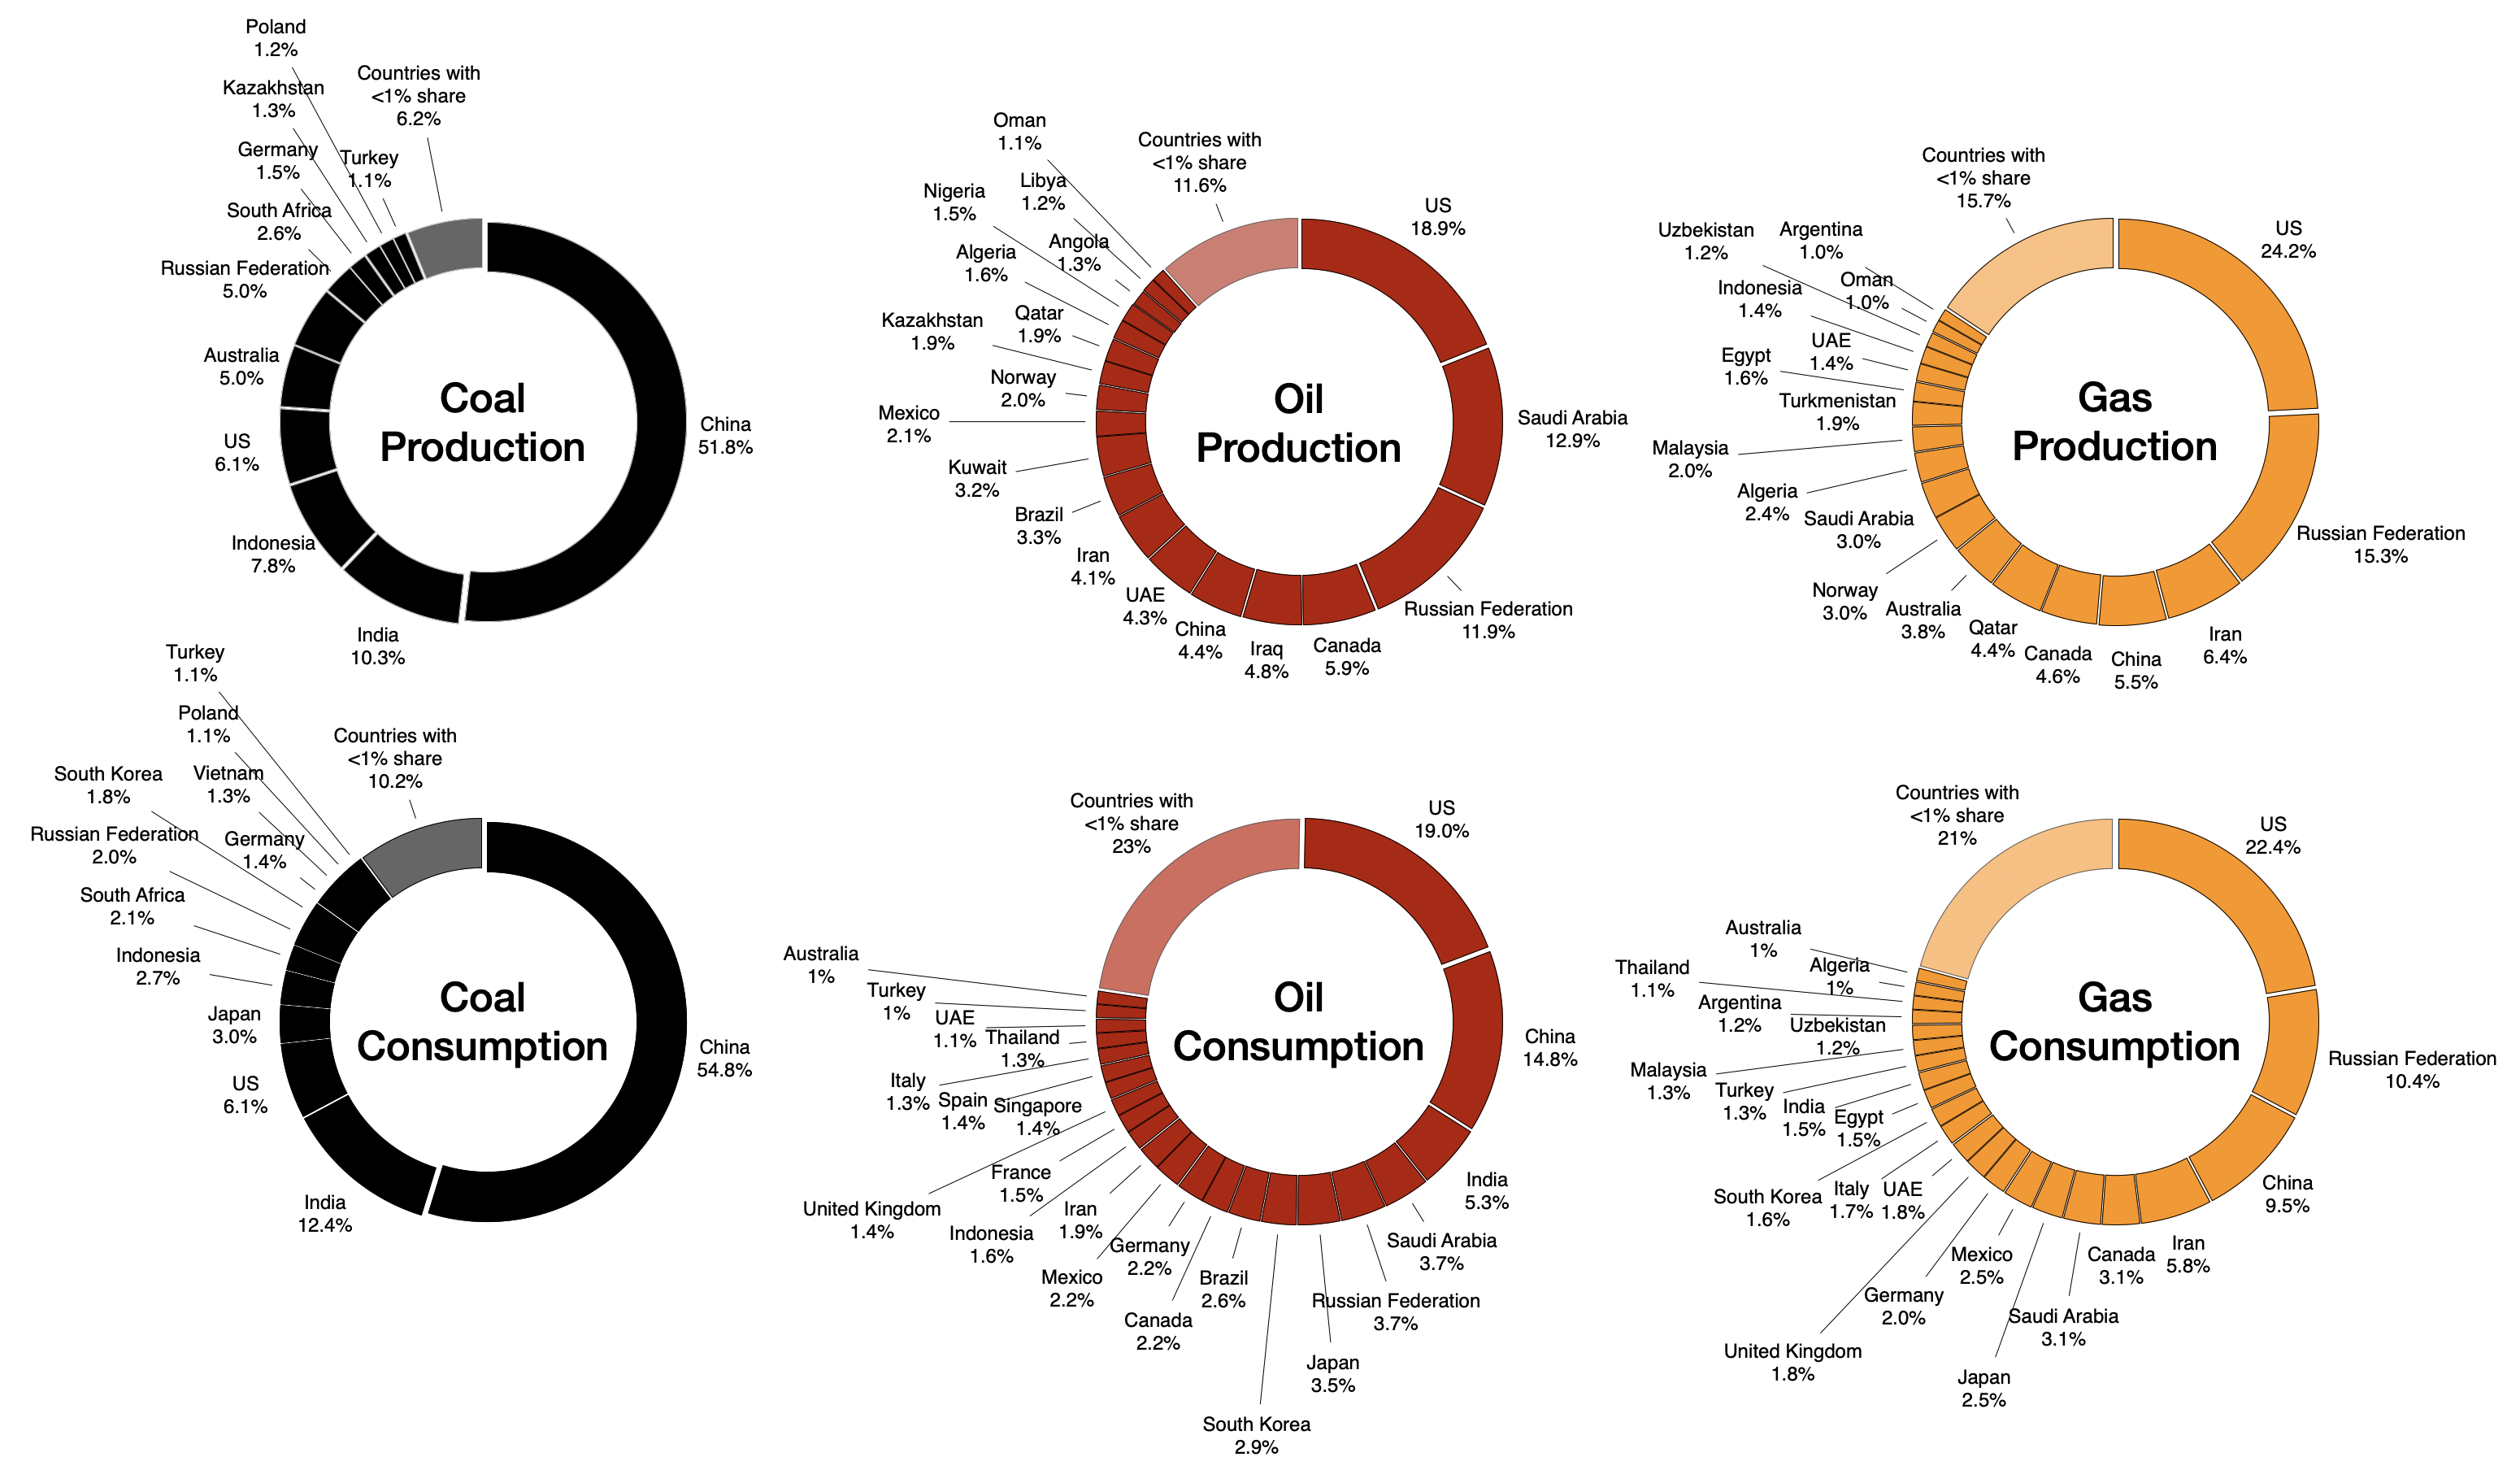
Summary of 2022
Coal
Production set a record high.
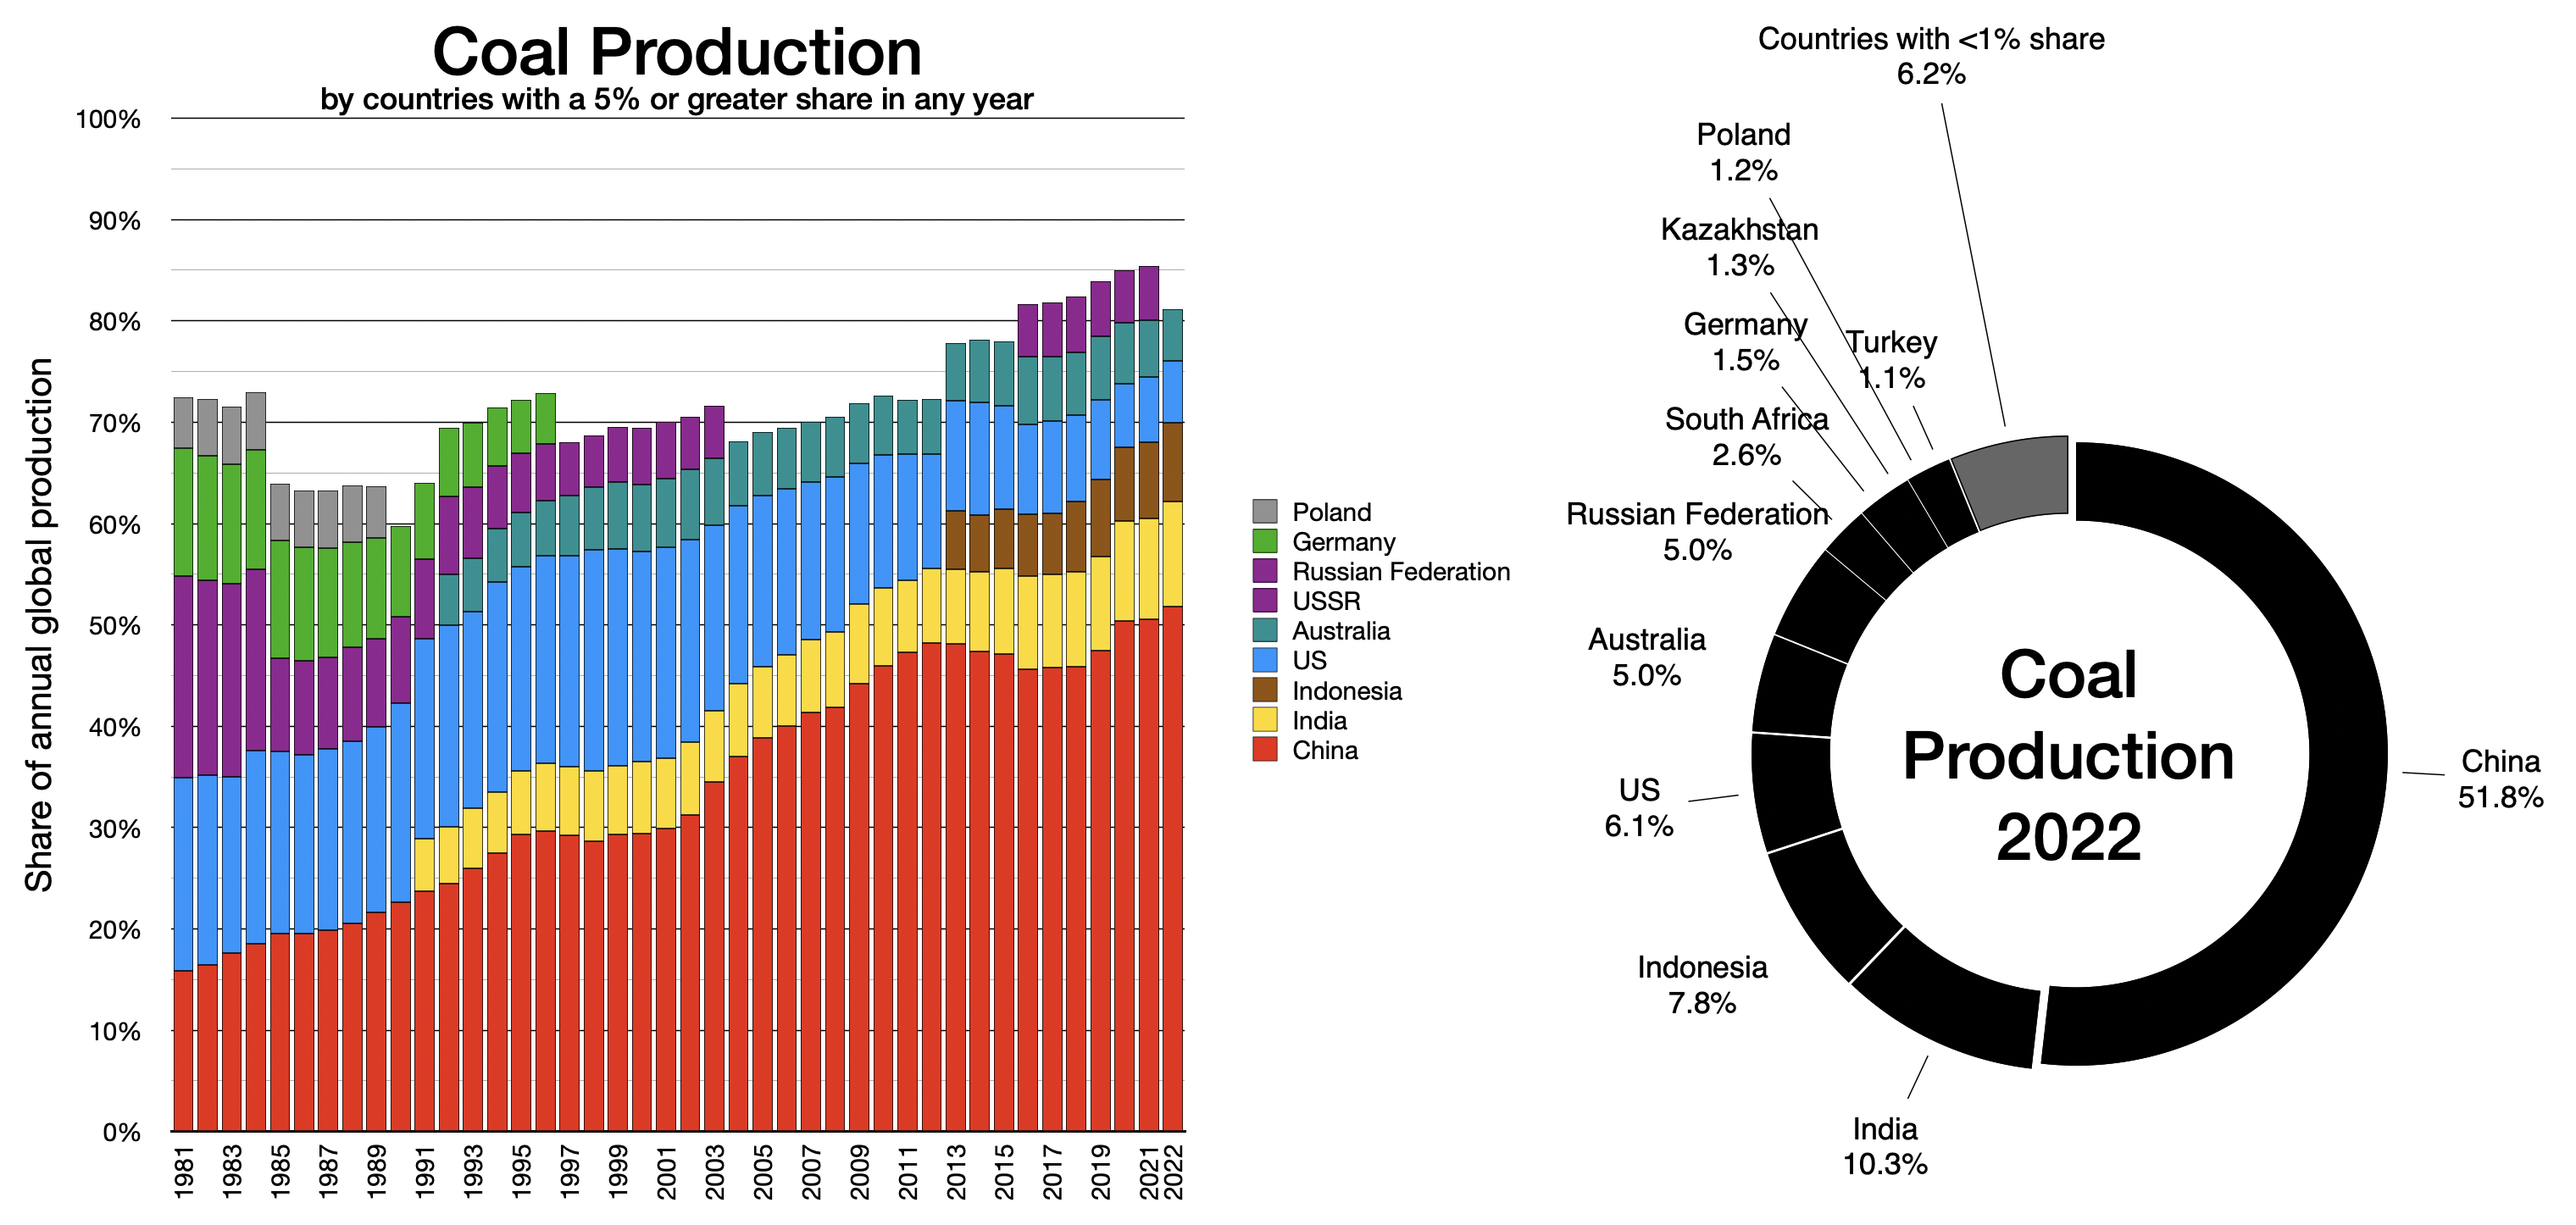
China alone accounted for just over half.
Only three countries accounted for 70% – China, India, and Indonesia.
Only six countries produced 5% or more, and accounted for 86% (2022 growth rate in brackets) –
- China (+10.5%),
- India (+12.1%),
- Indonesia (+12%),
- the US (+3%),
- Australia (-3.7%), and
- Russia (+1.1%).
11 countries produced 1% or more and accounted for 94%.
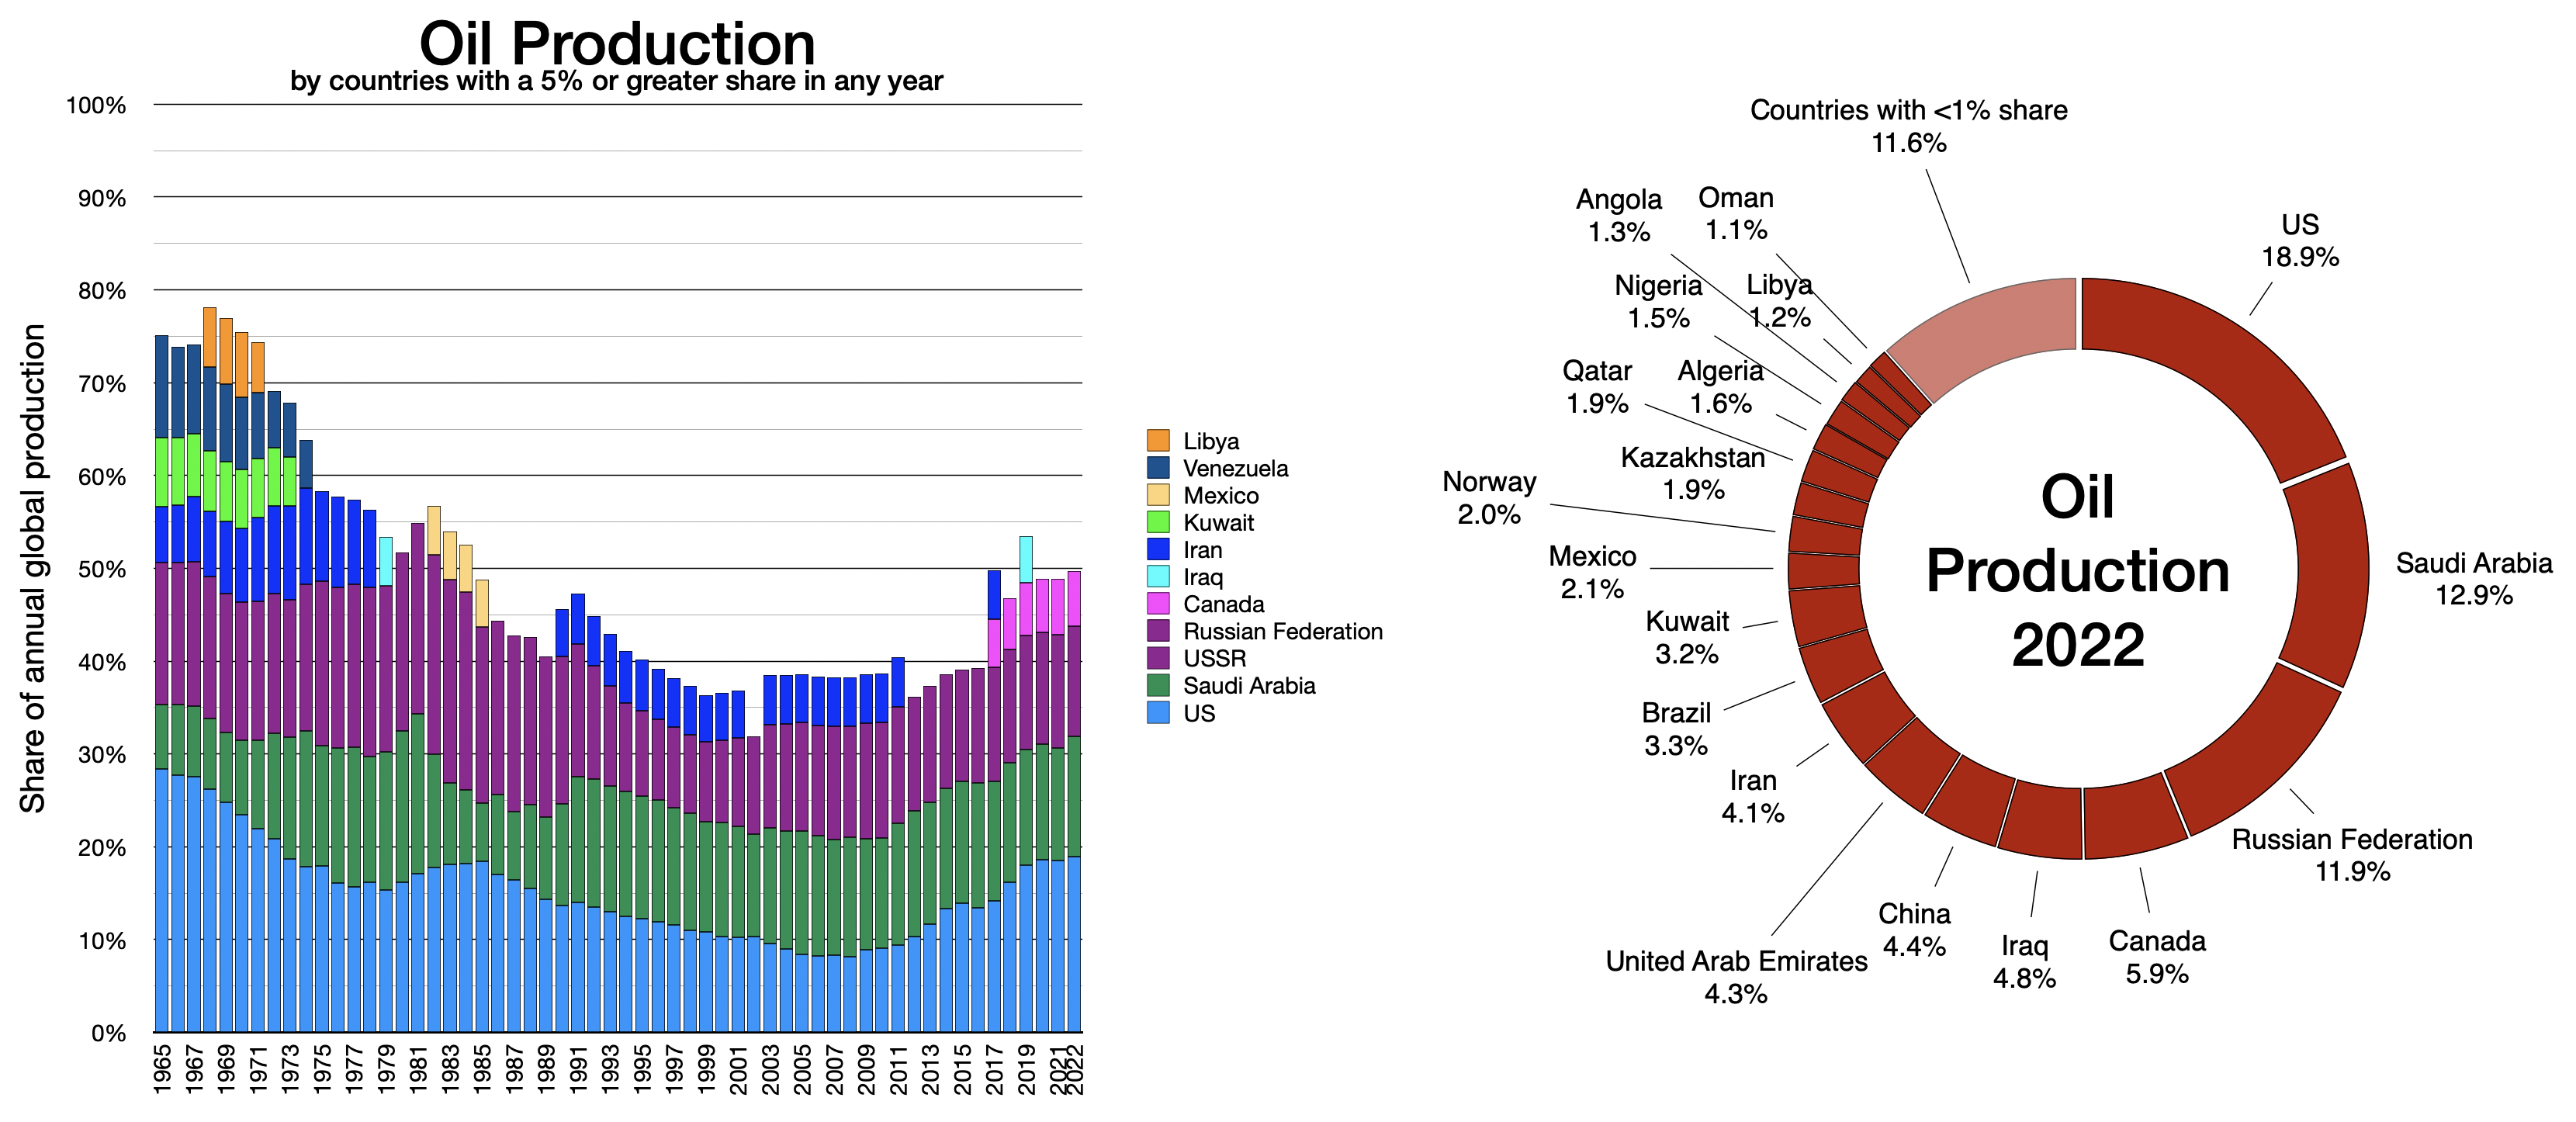
Oil
Production was 99% of the record level set in 20191.
Only five countries produced just over half (2022 growth rate in brackets) –
- the US (+6.5%),
- Saudi Arabia (+10.8%),
- Russia (+1.8%),
- Canada (+3%), and
- Iraq (+10.2%).
19 countries produced 1% or more and accounted for 88%.
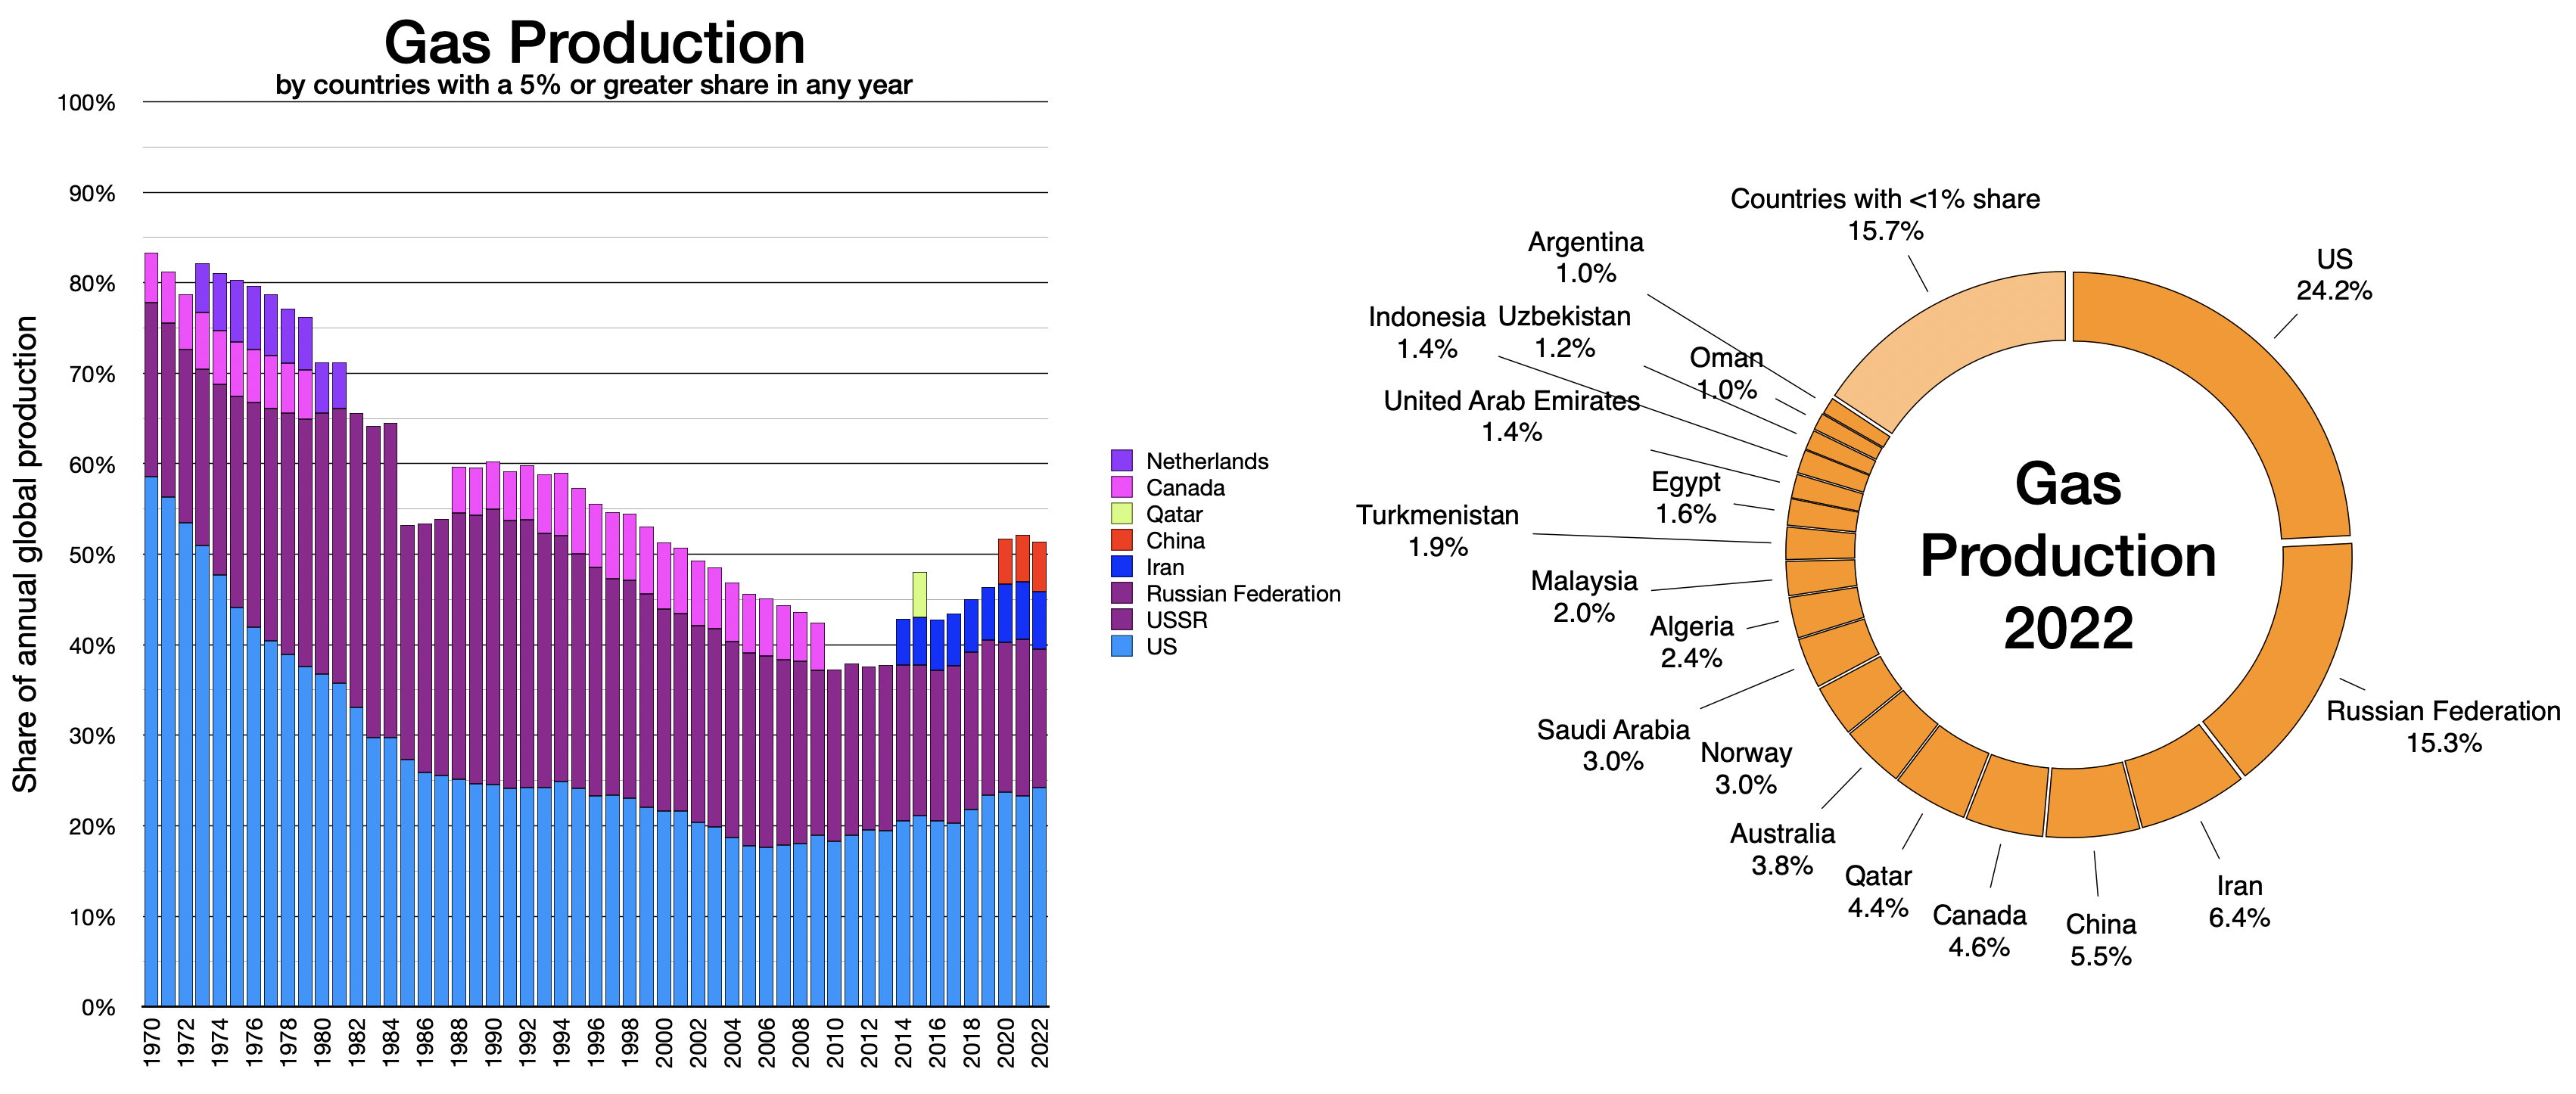
Gas
Production was 99.8% of the record level set in 20212.
Only the four countries produced just over half (2022 growth rate in brackets) –
- the US (+3.6%),
- Russia (-12%),
- Iran (+1.1%), and
- China (+6%).
18 countries produced 1% or more and accounted for 84%.
Only nine countries produced a 5% or greater share of a fossil fuel in 2022 – China, India, Indonesia, the US, Australia, Russia, Saudi Arabia, Canada, and Iran.
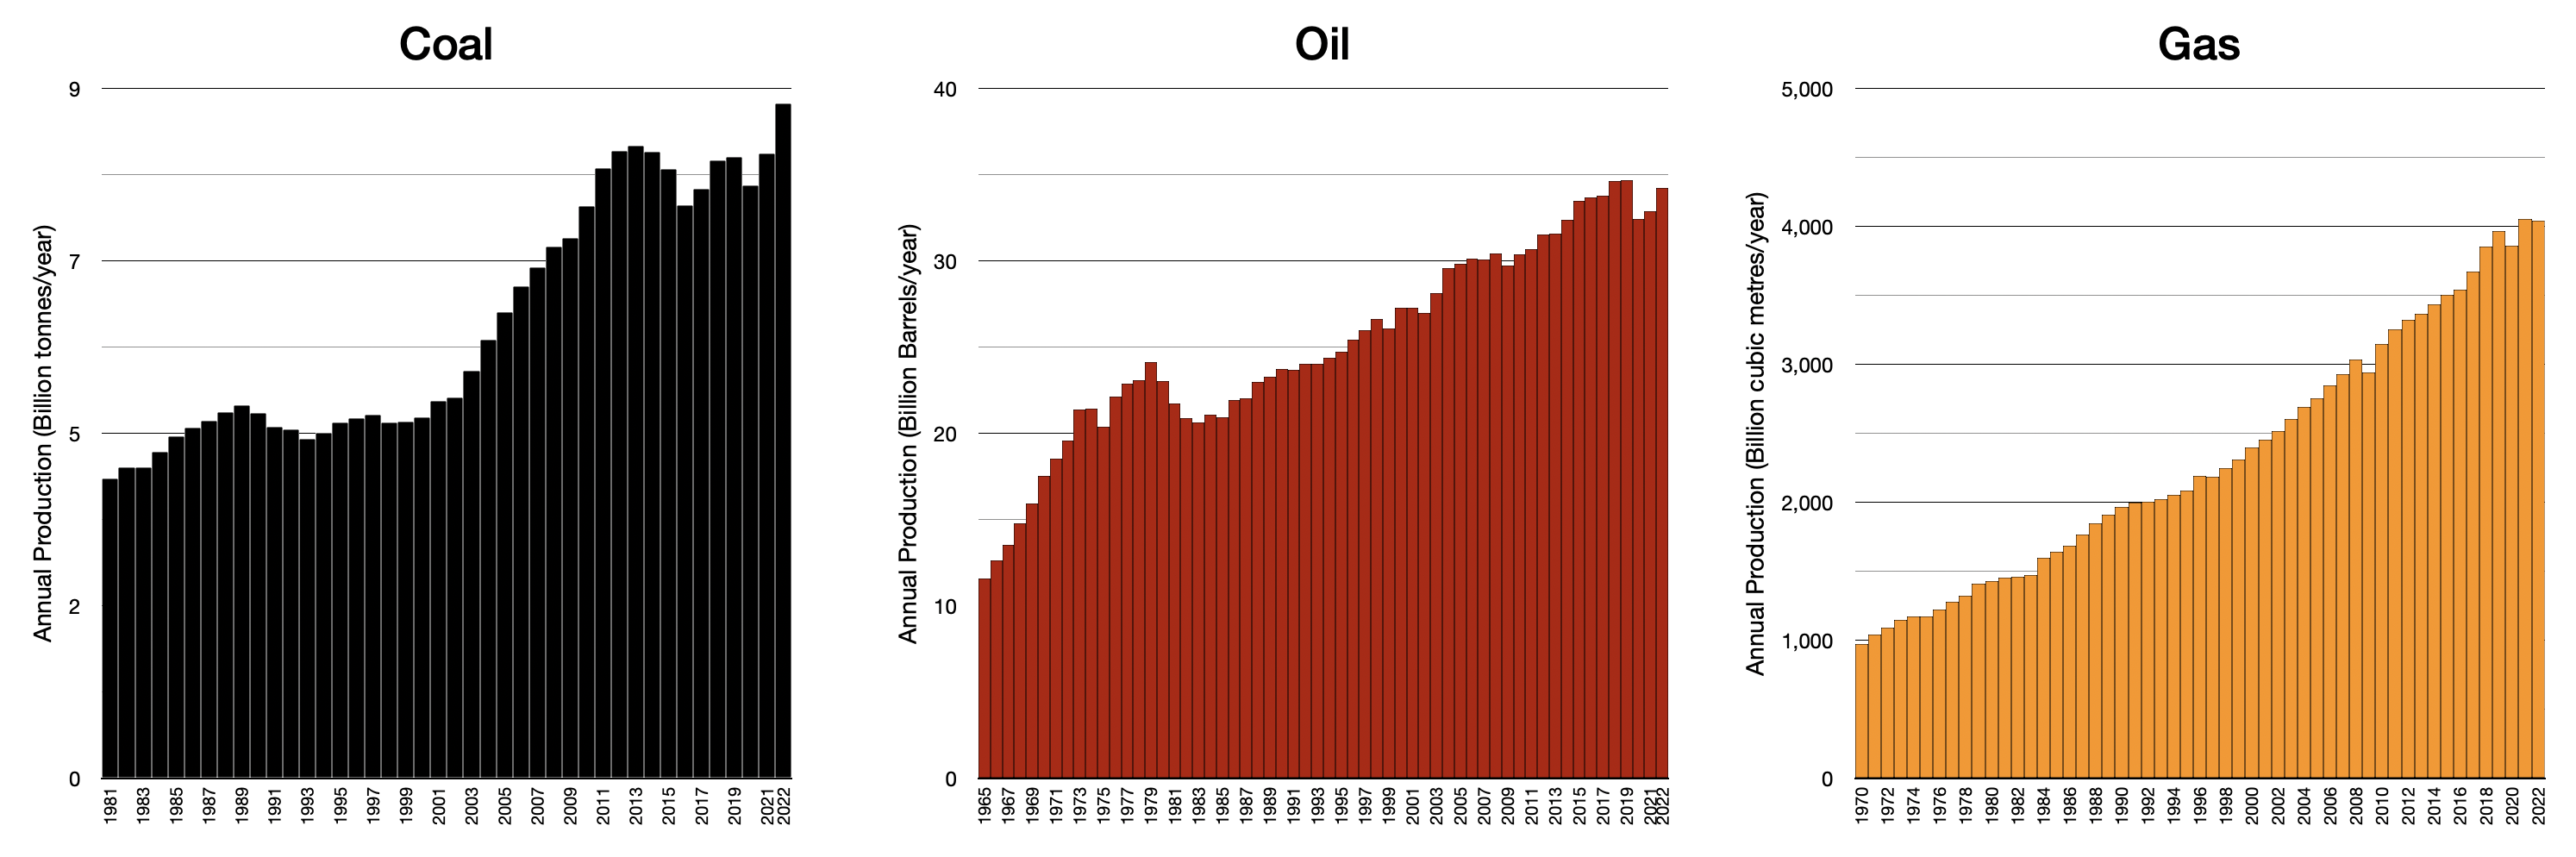
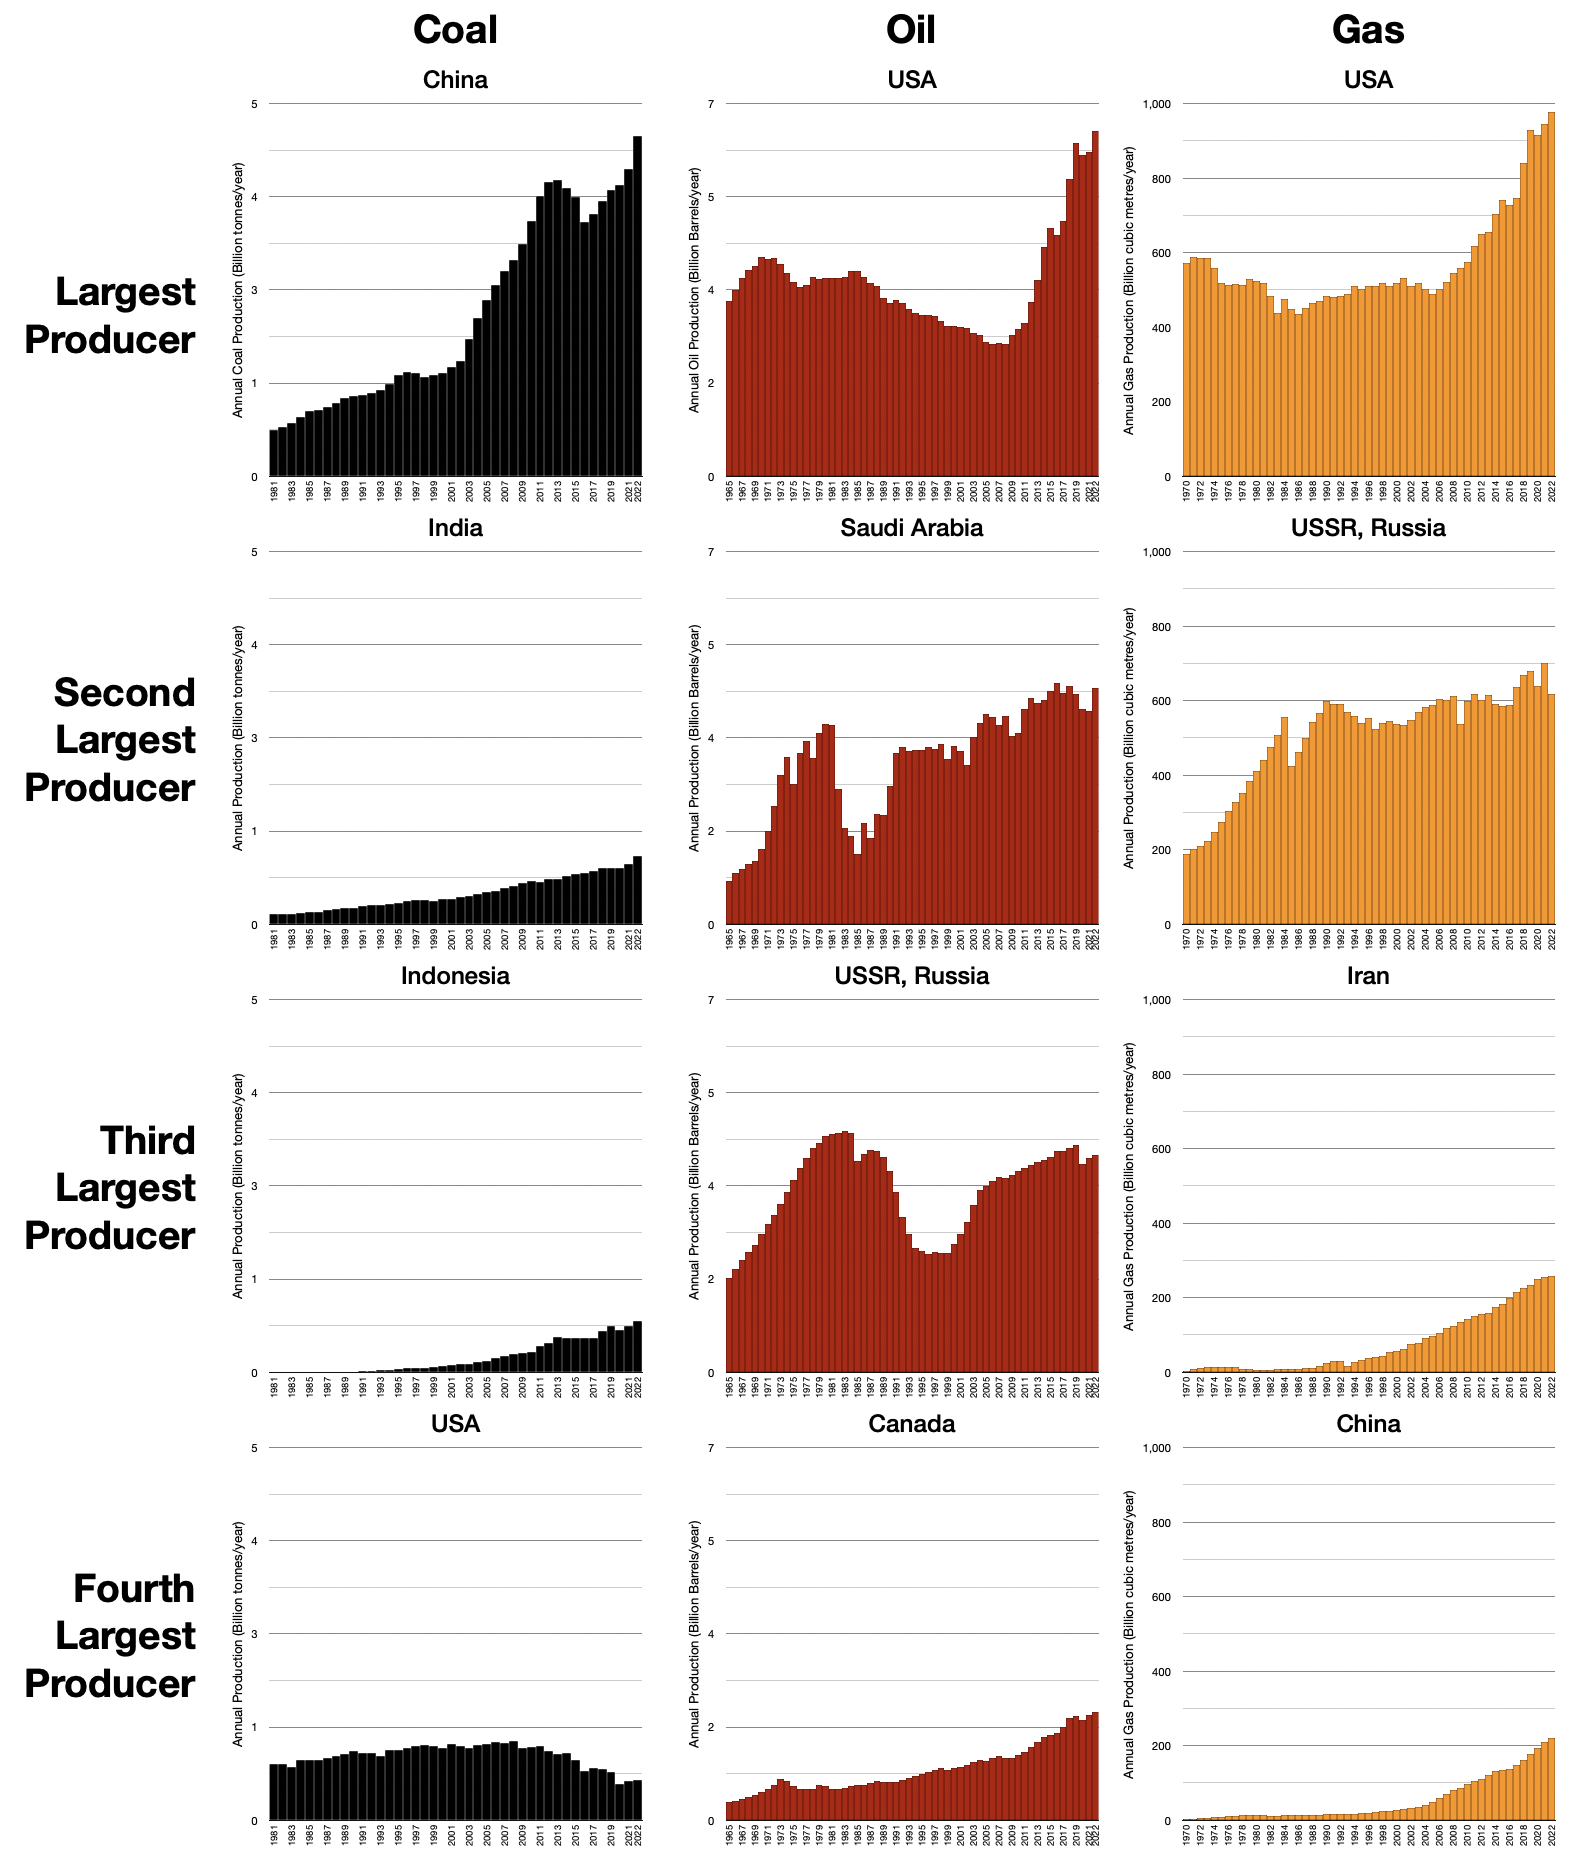
Trends
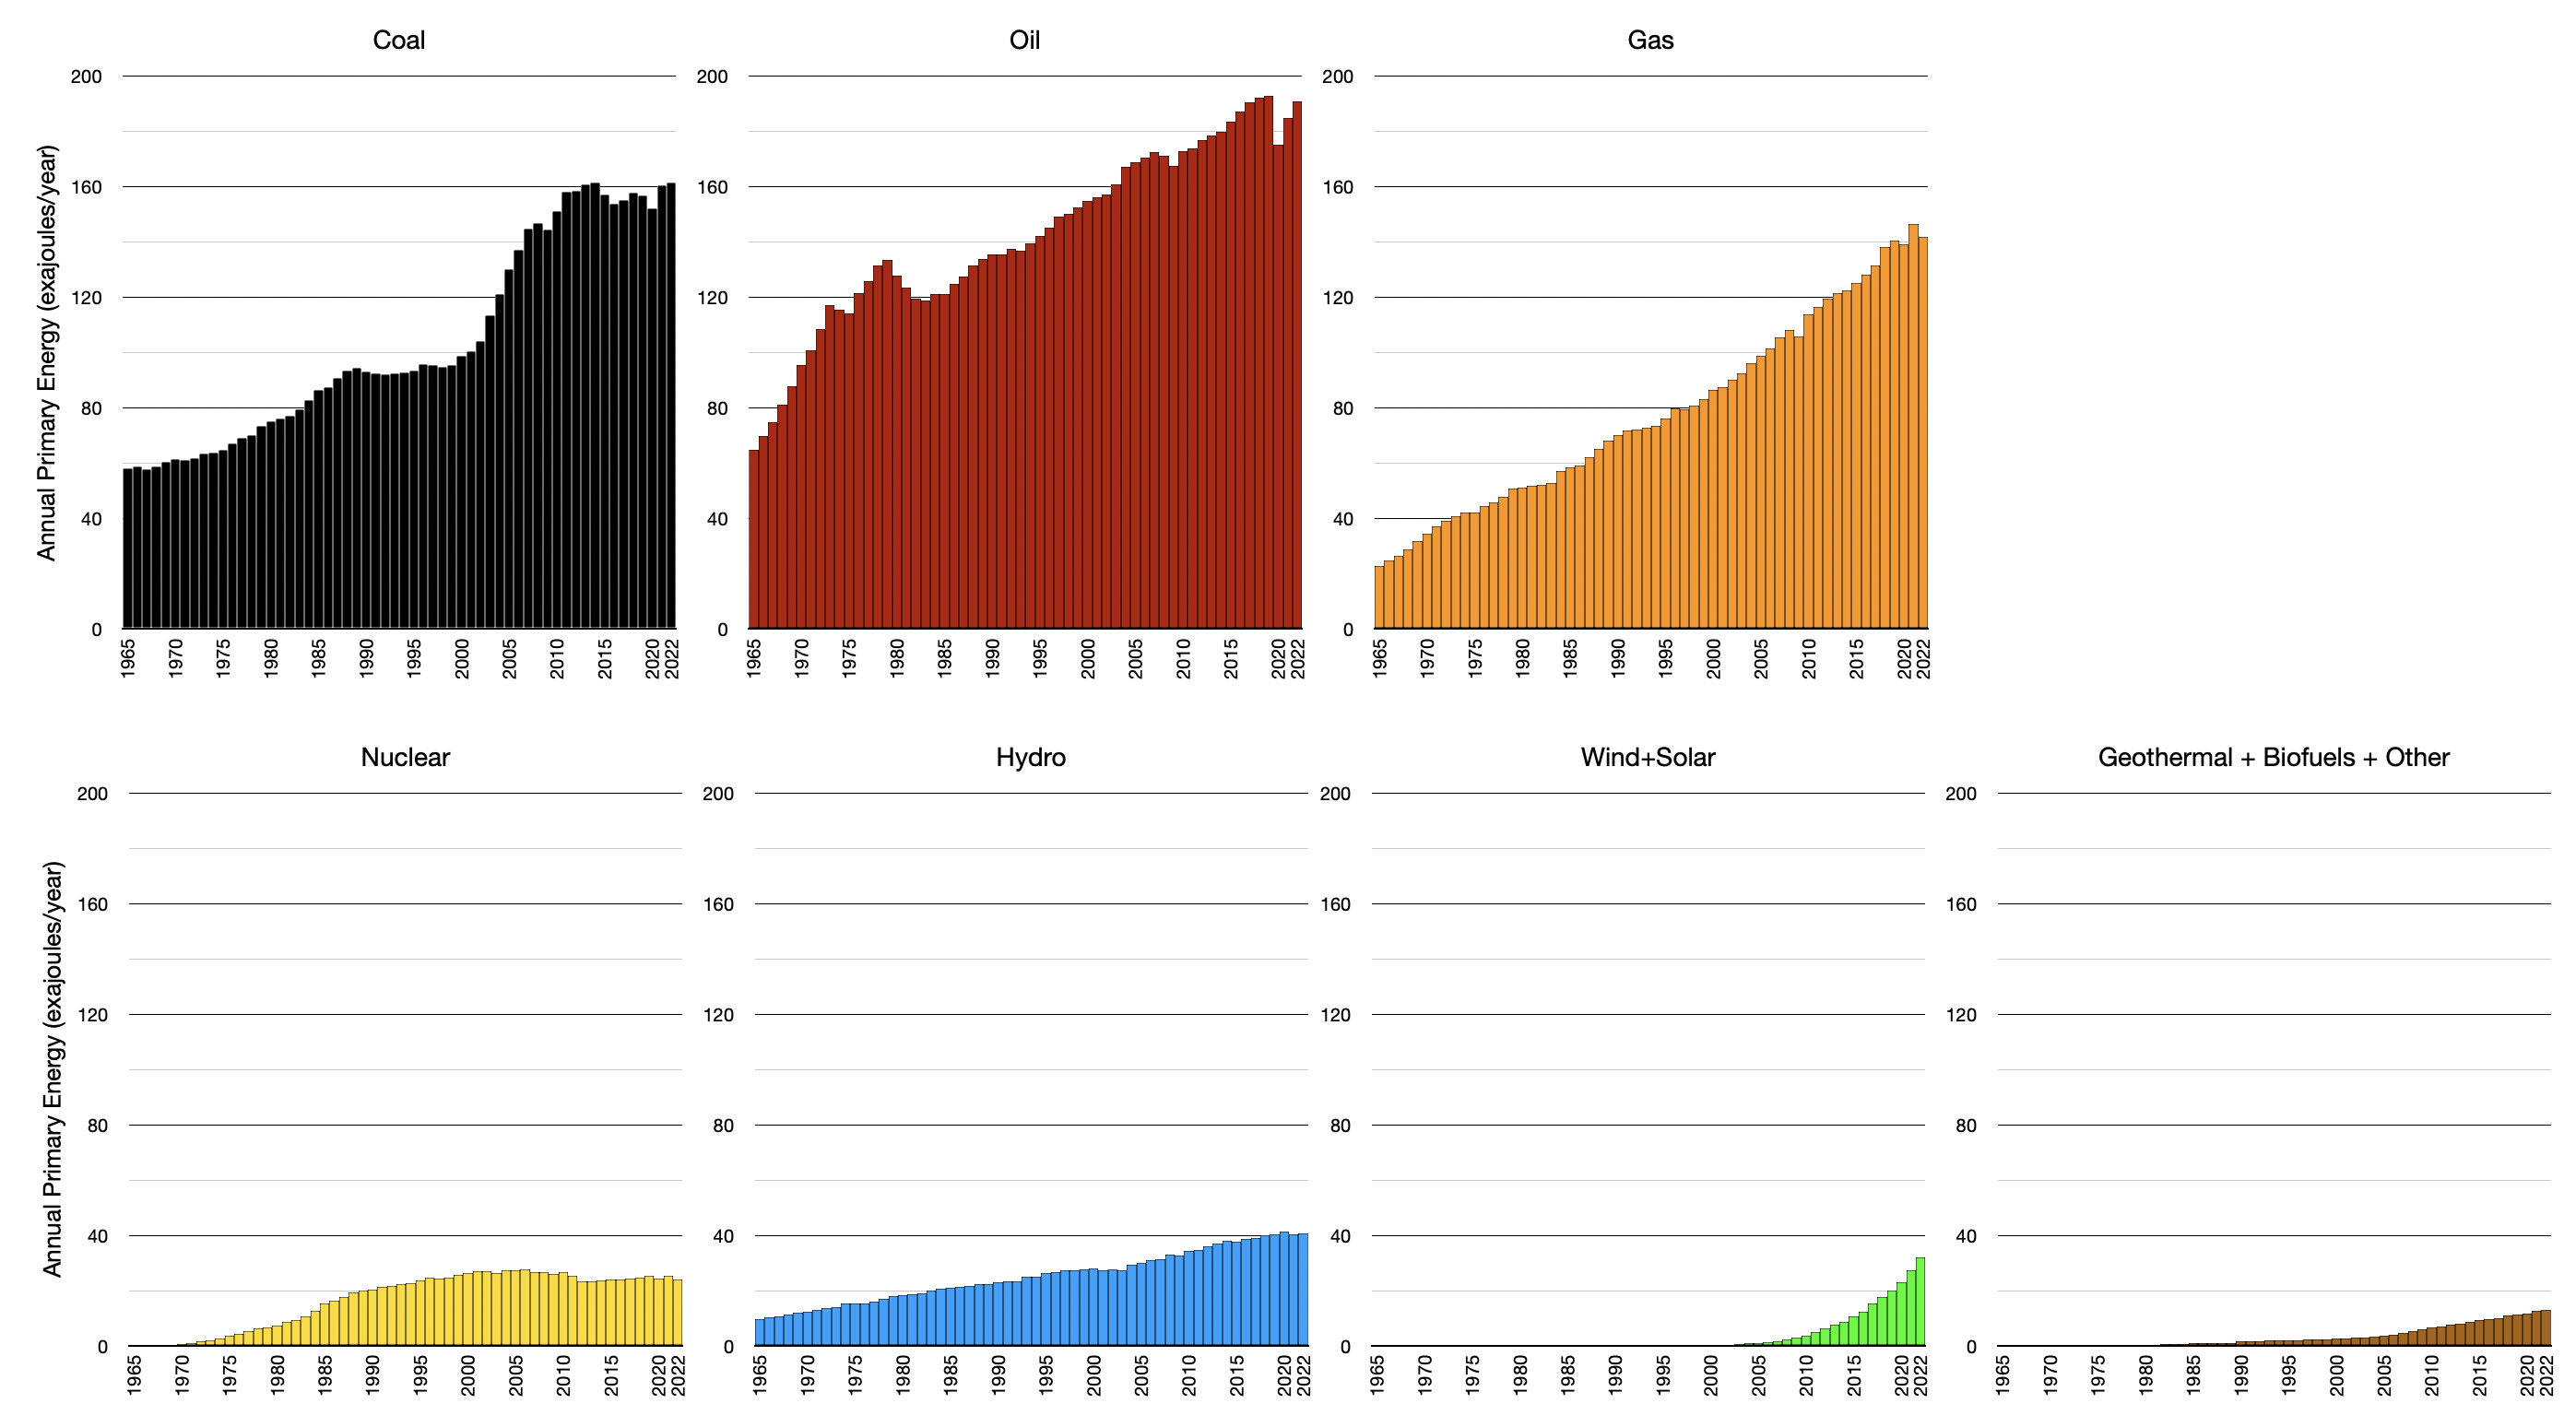
Absolute Quantities
Notes:
(a) Coal is combusted for the manufacture of steel (7% of world energy sector CO₂ emissions6), and the generation of electricity (28% of world energy sector CO₂ emissions7).
(b) 1 barrel of oil is equivalent to 159 litres, or 42 US gallons.
(c) Not all oil and gas is combusted, but even the non-combusted share causes significant CO₂ emissions. “Around 15% of oil and 5% of natural gas are used as petrochemical feedstocks and in other non-combustion processes”8. “There would still be scope 1 and 2 emissions from their extraction, processing and transport,…”8. This amounts to 19% of total CO₂ emissions per barrel-of-oil-consumed solely for combustion purposes (scope 1, 2 and 3 emissions combined)9 and 24% per barrel-of-oil-equivalent for gas10.
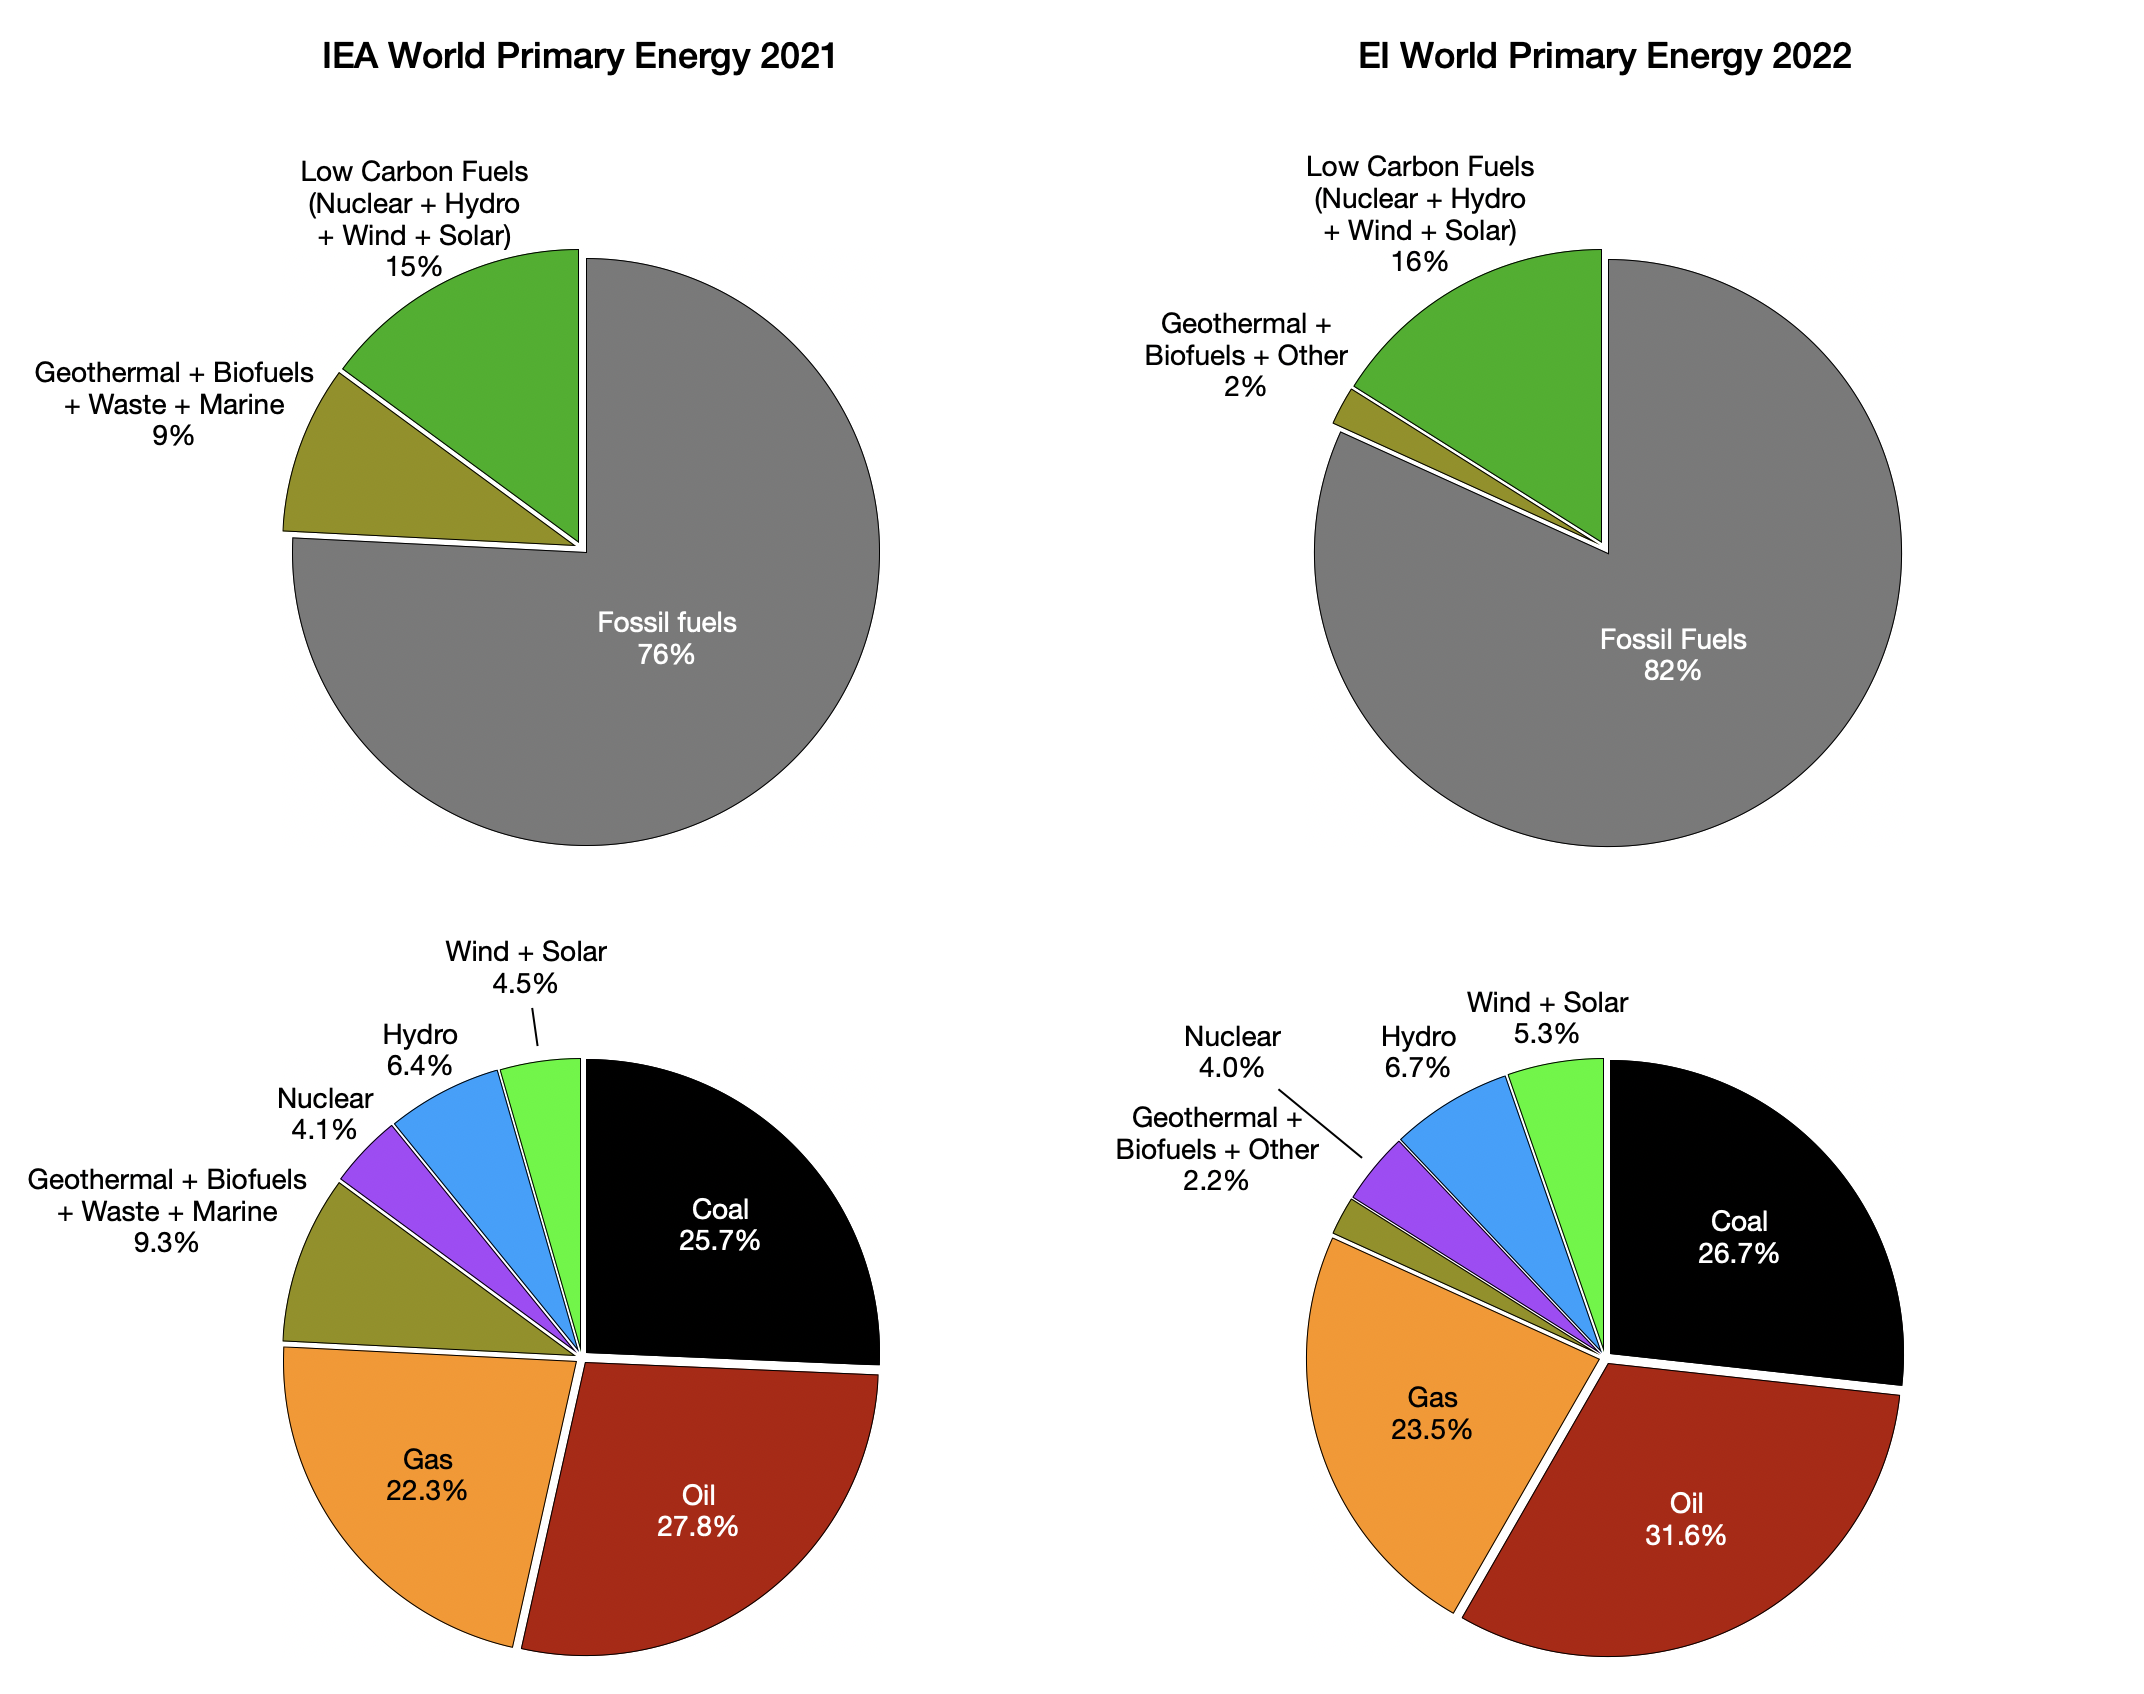
Primary energy
An explanation of primary energy can be found in the introduction.
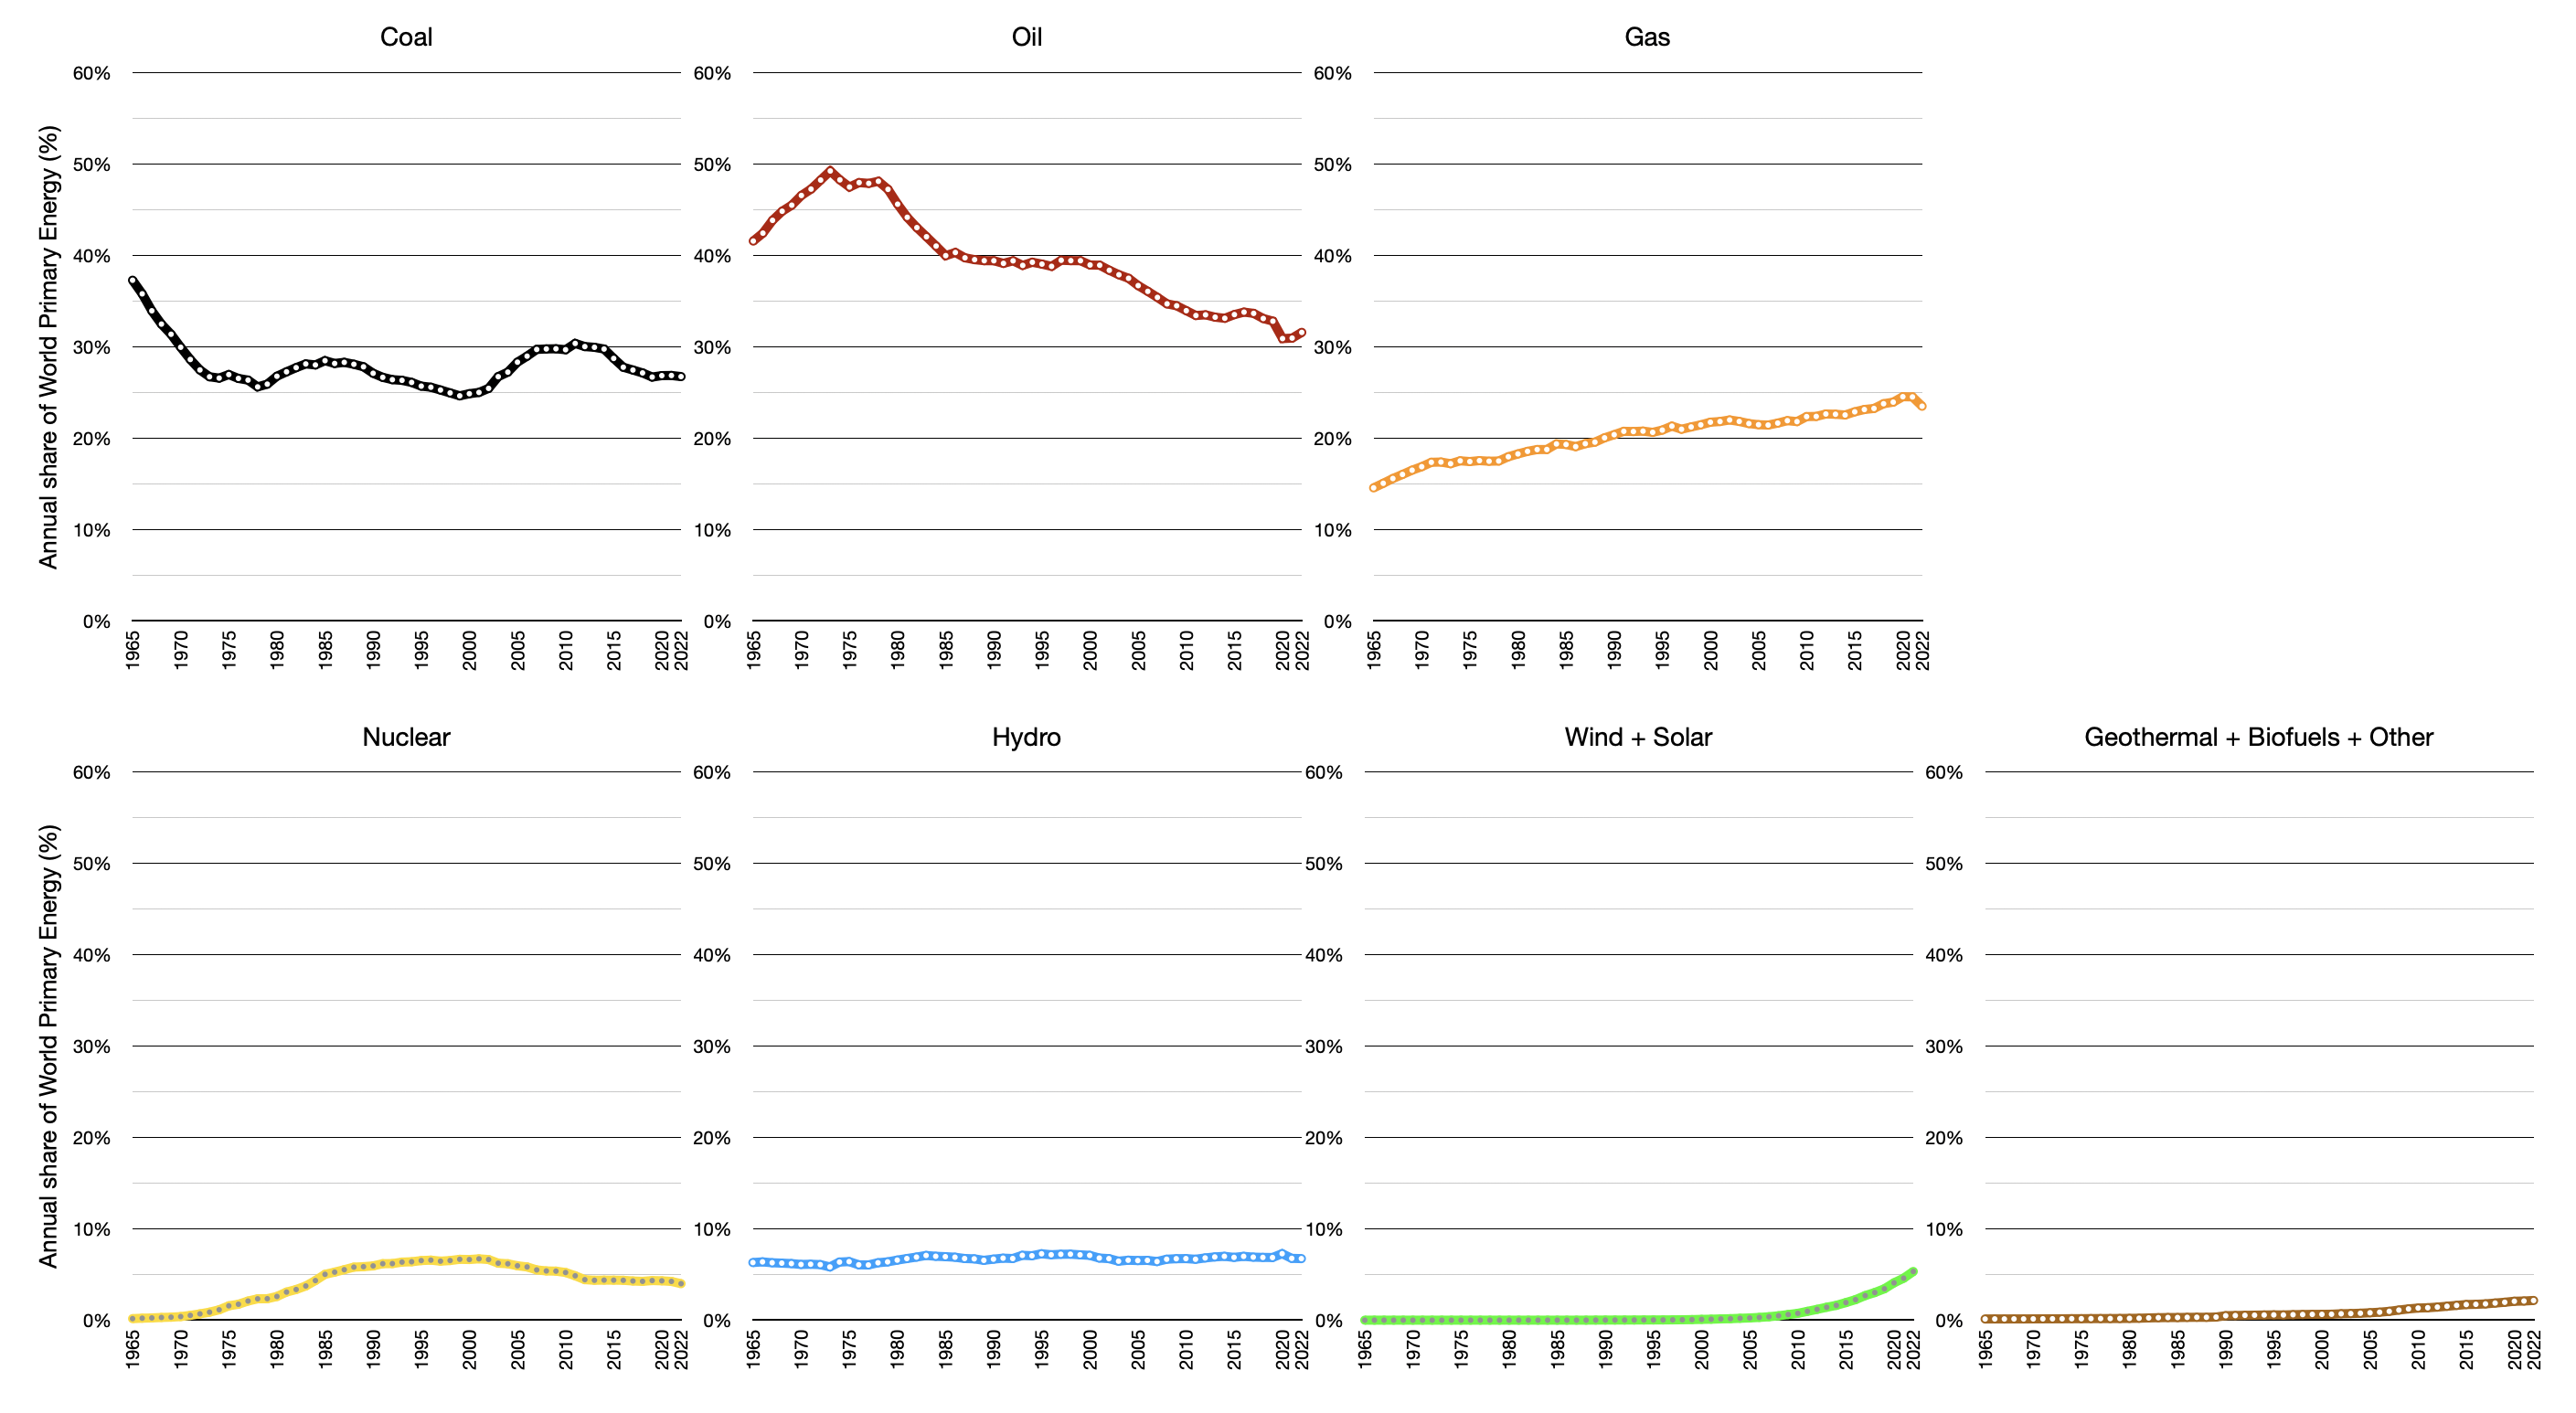
Annual shares
The charts below use the latest data from the IEA14 15 16 and the Energy Institute3 17.
The years of the charts below differ because the most recent year of the IEA’s dataset is 2020, and EI’s 2022.
EI’s data doesn’t account for solid biofuels not traded on financial markets such as dung and wood, which is used by about 2.5 billion people for residential cooking and heating18. This is shown as the significant share of biofuels and waste in the chart of the IEA’s data.
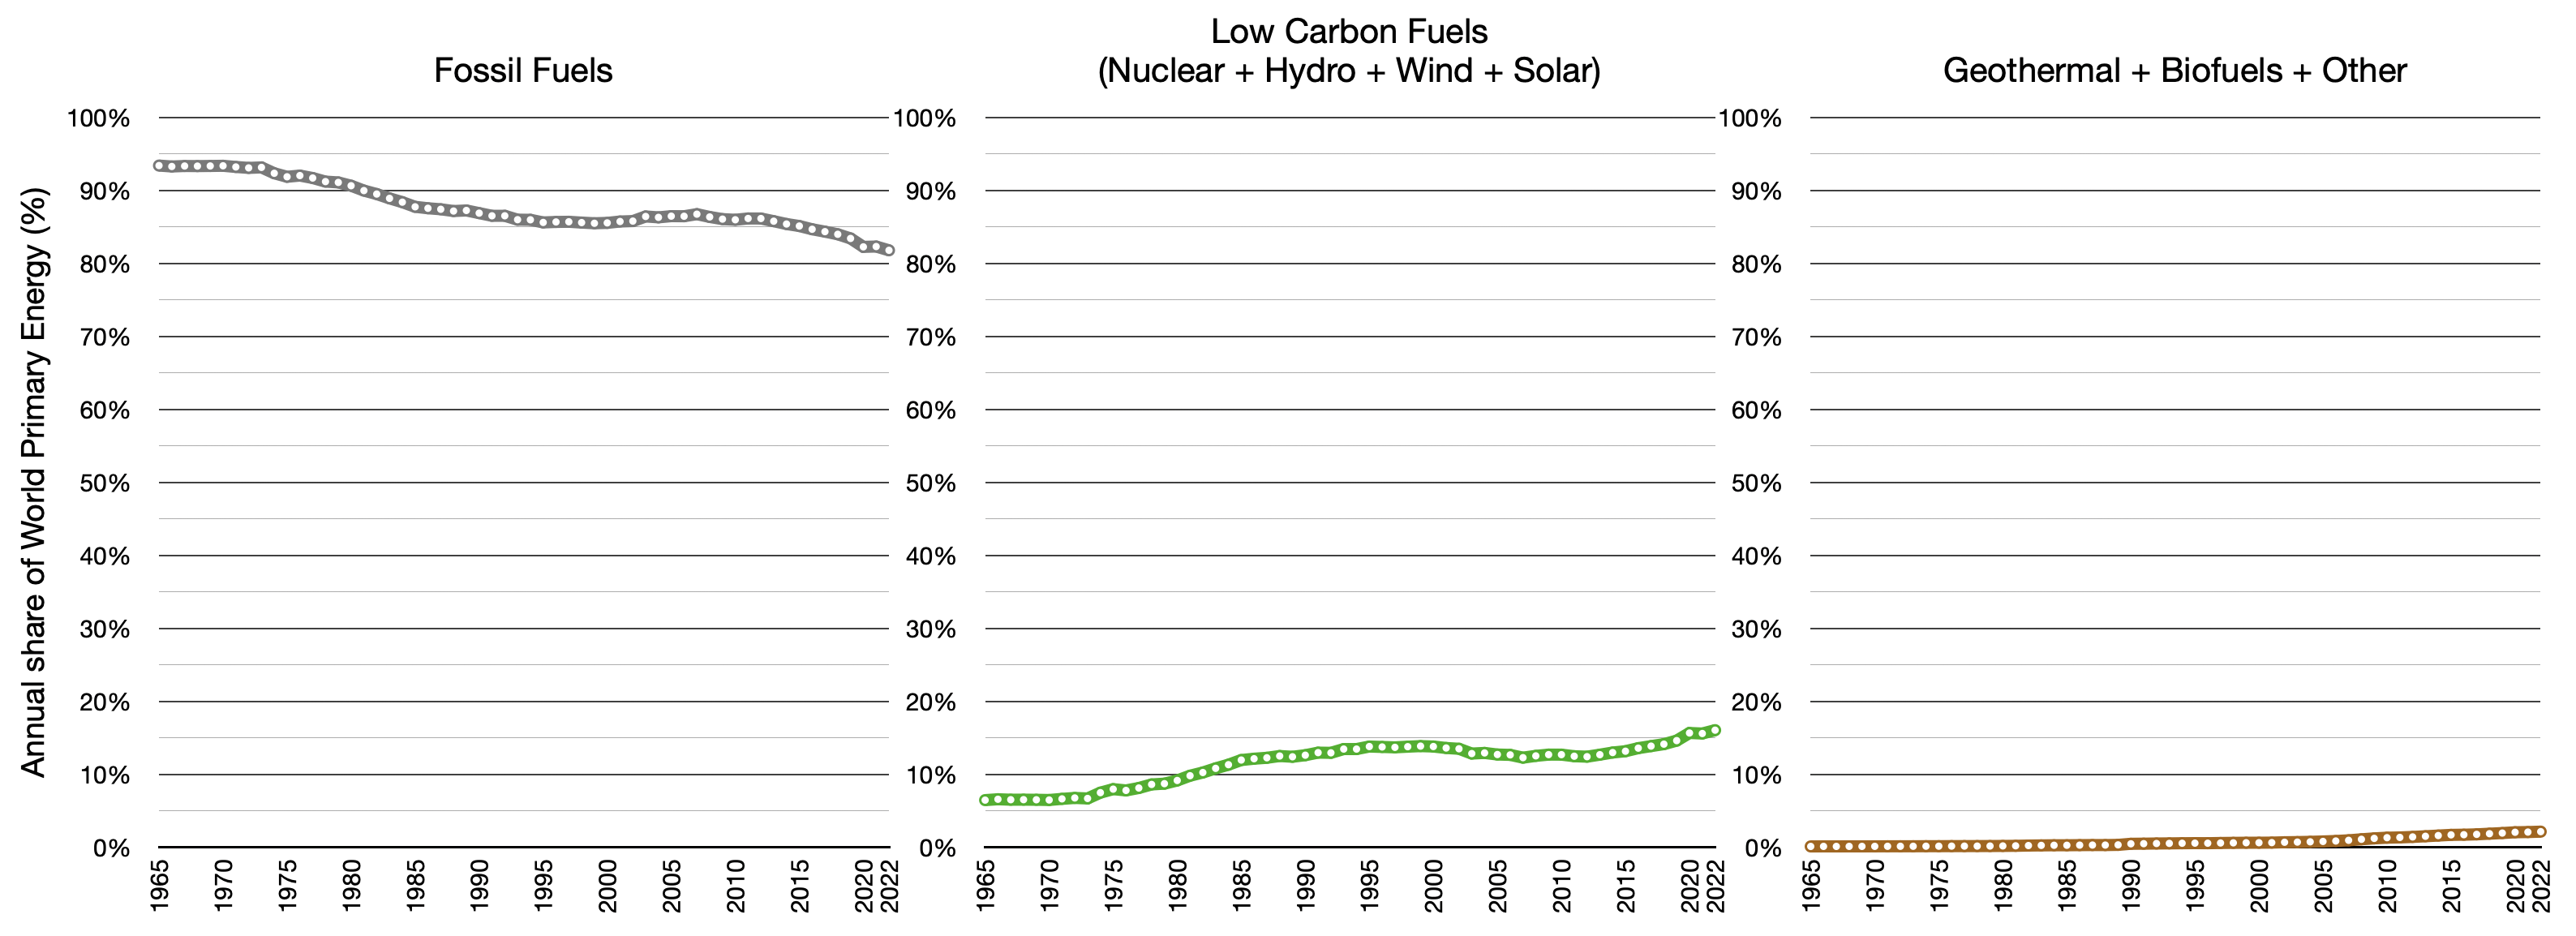
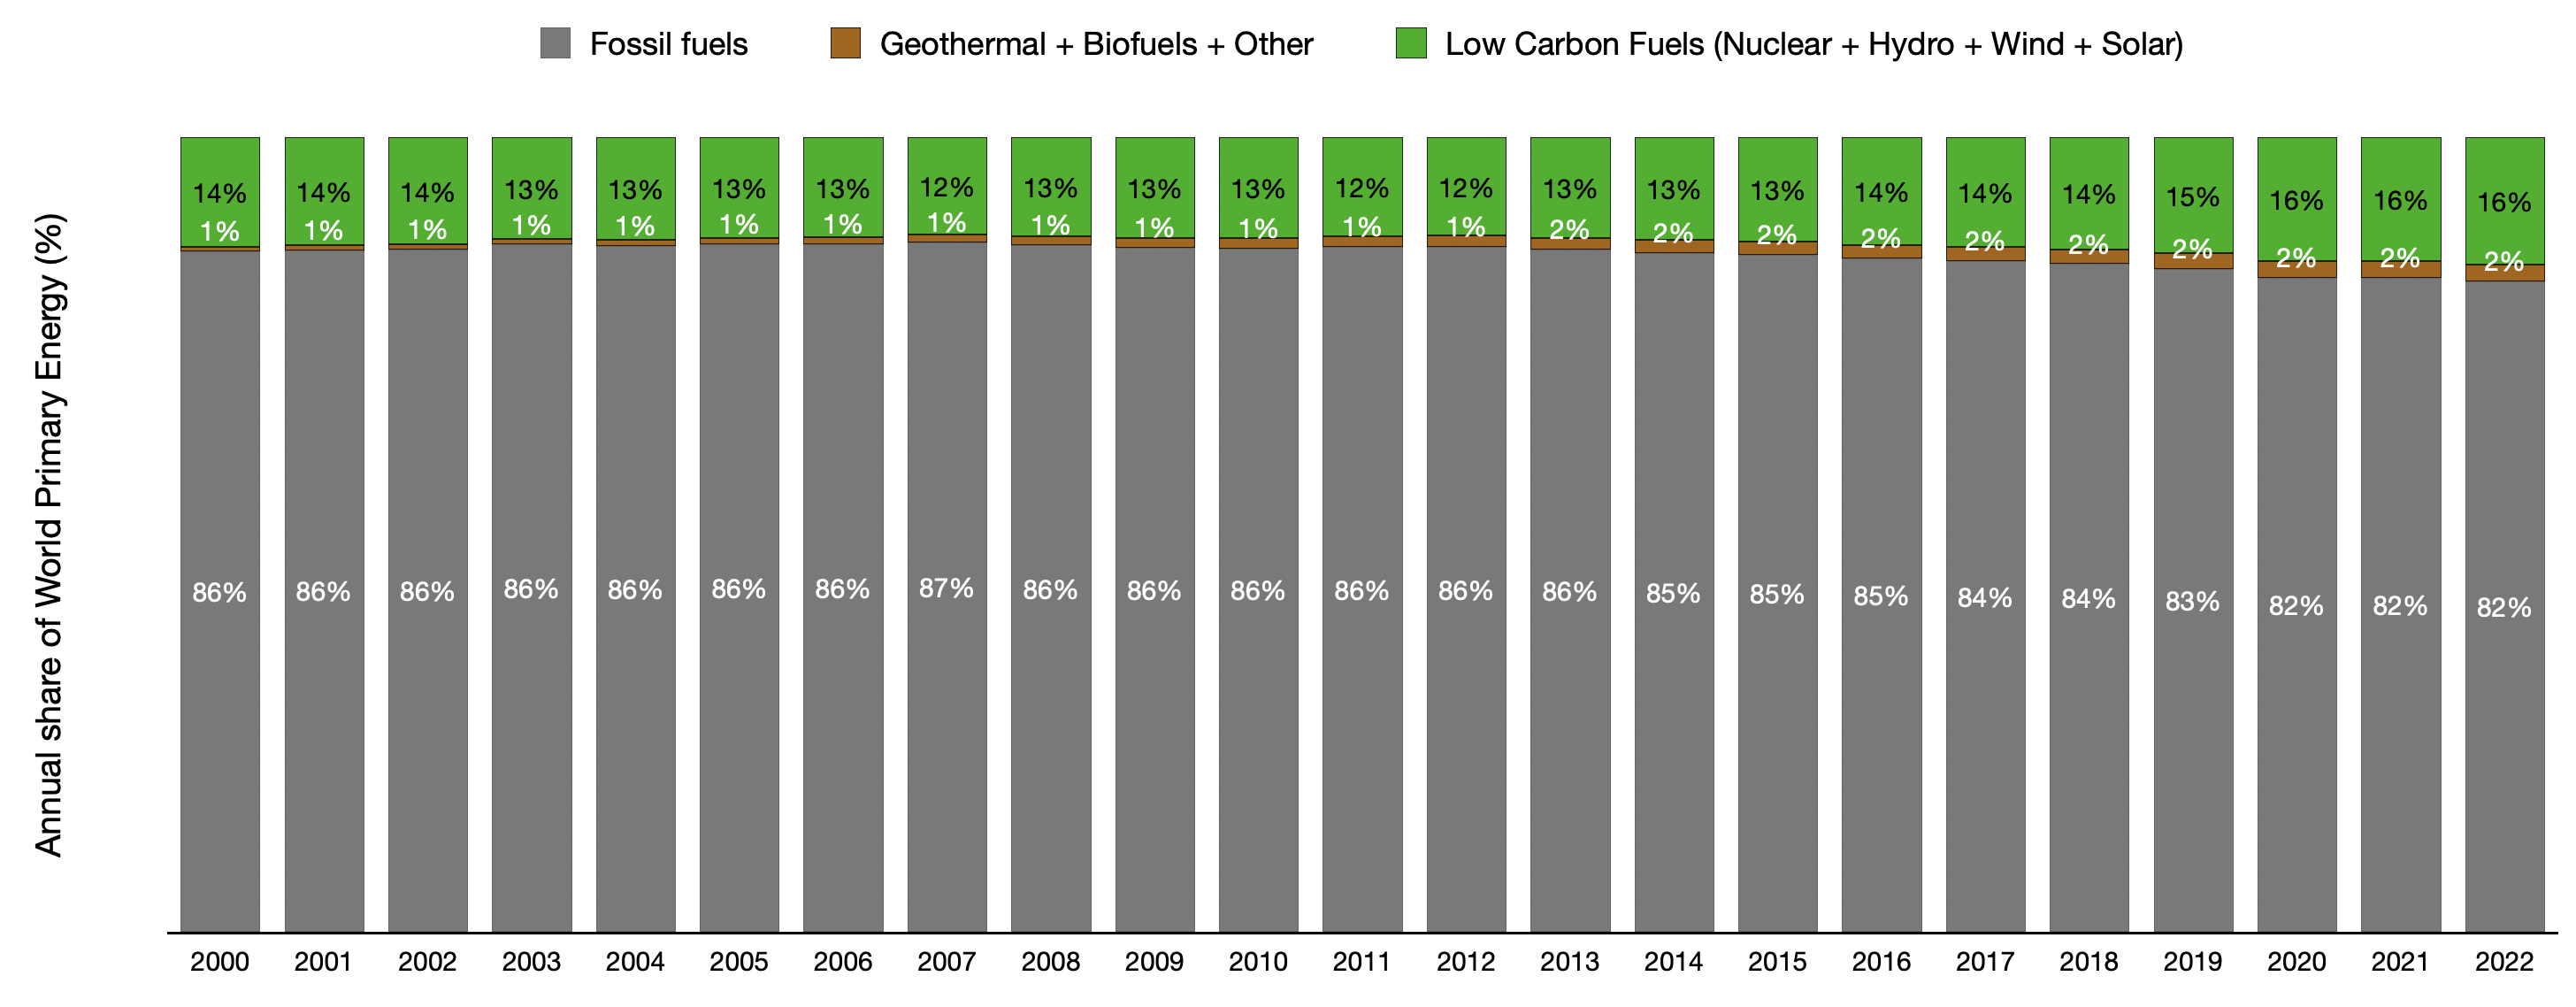
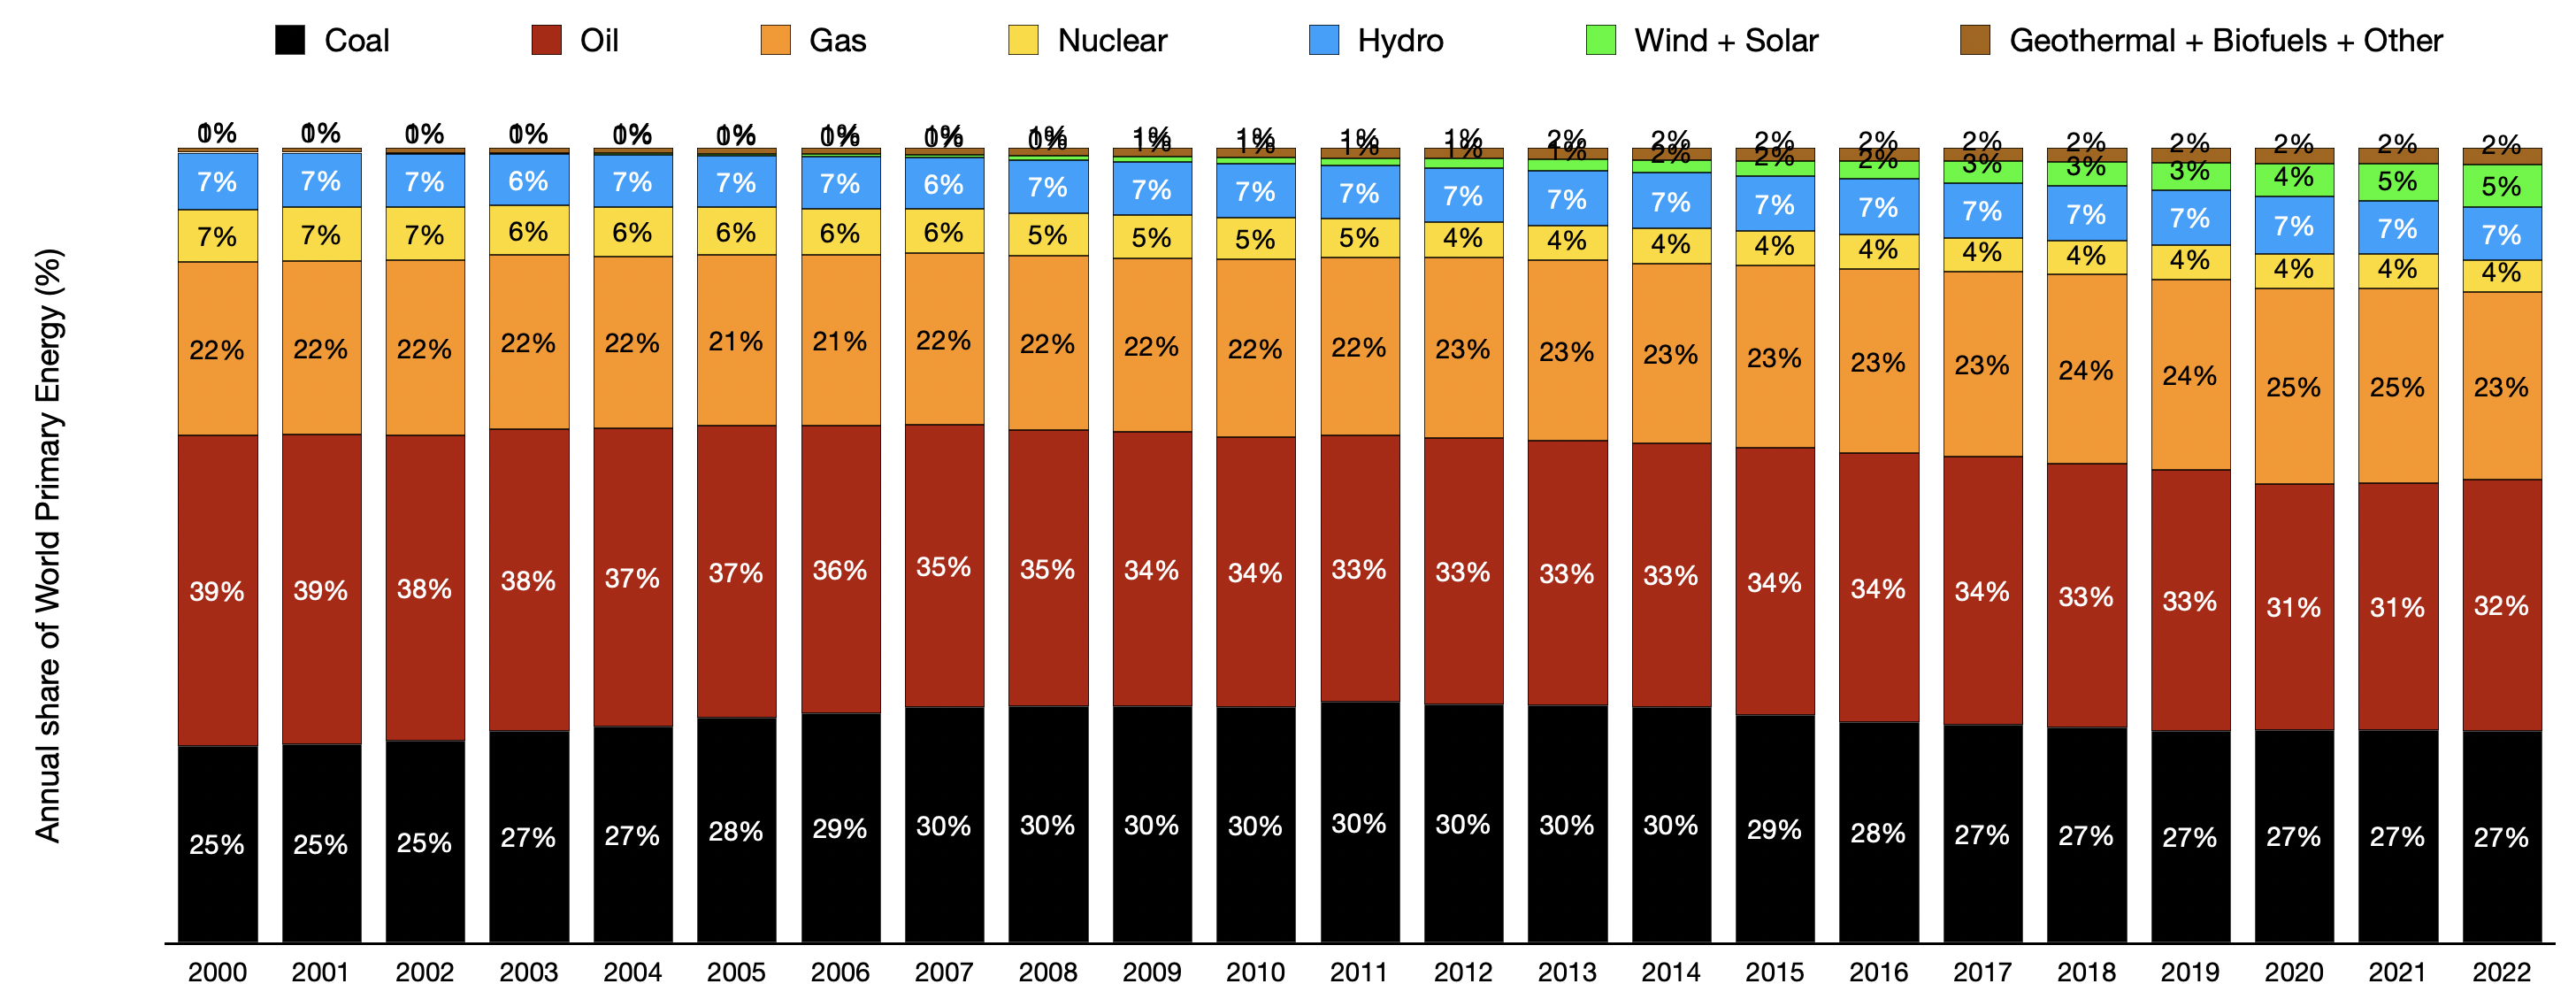
Trends
By share
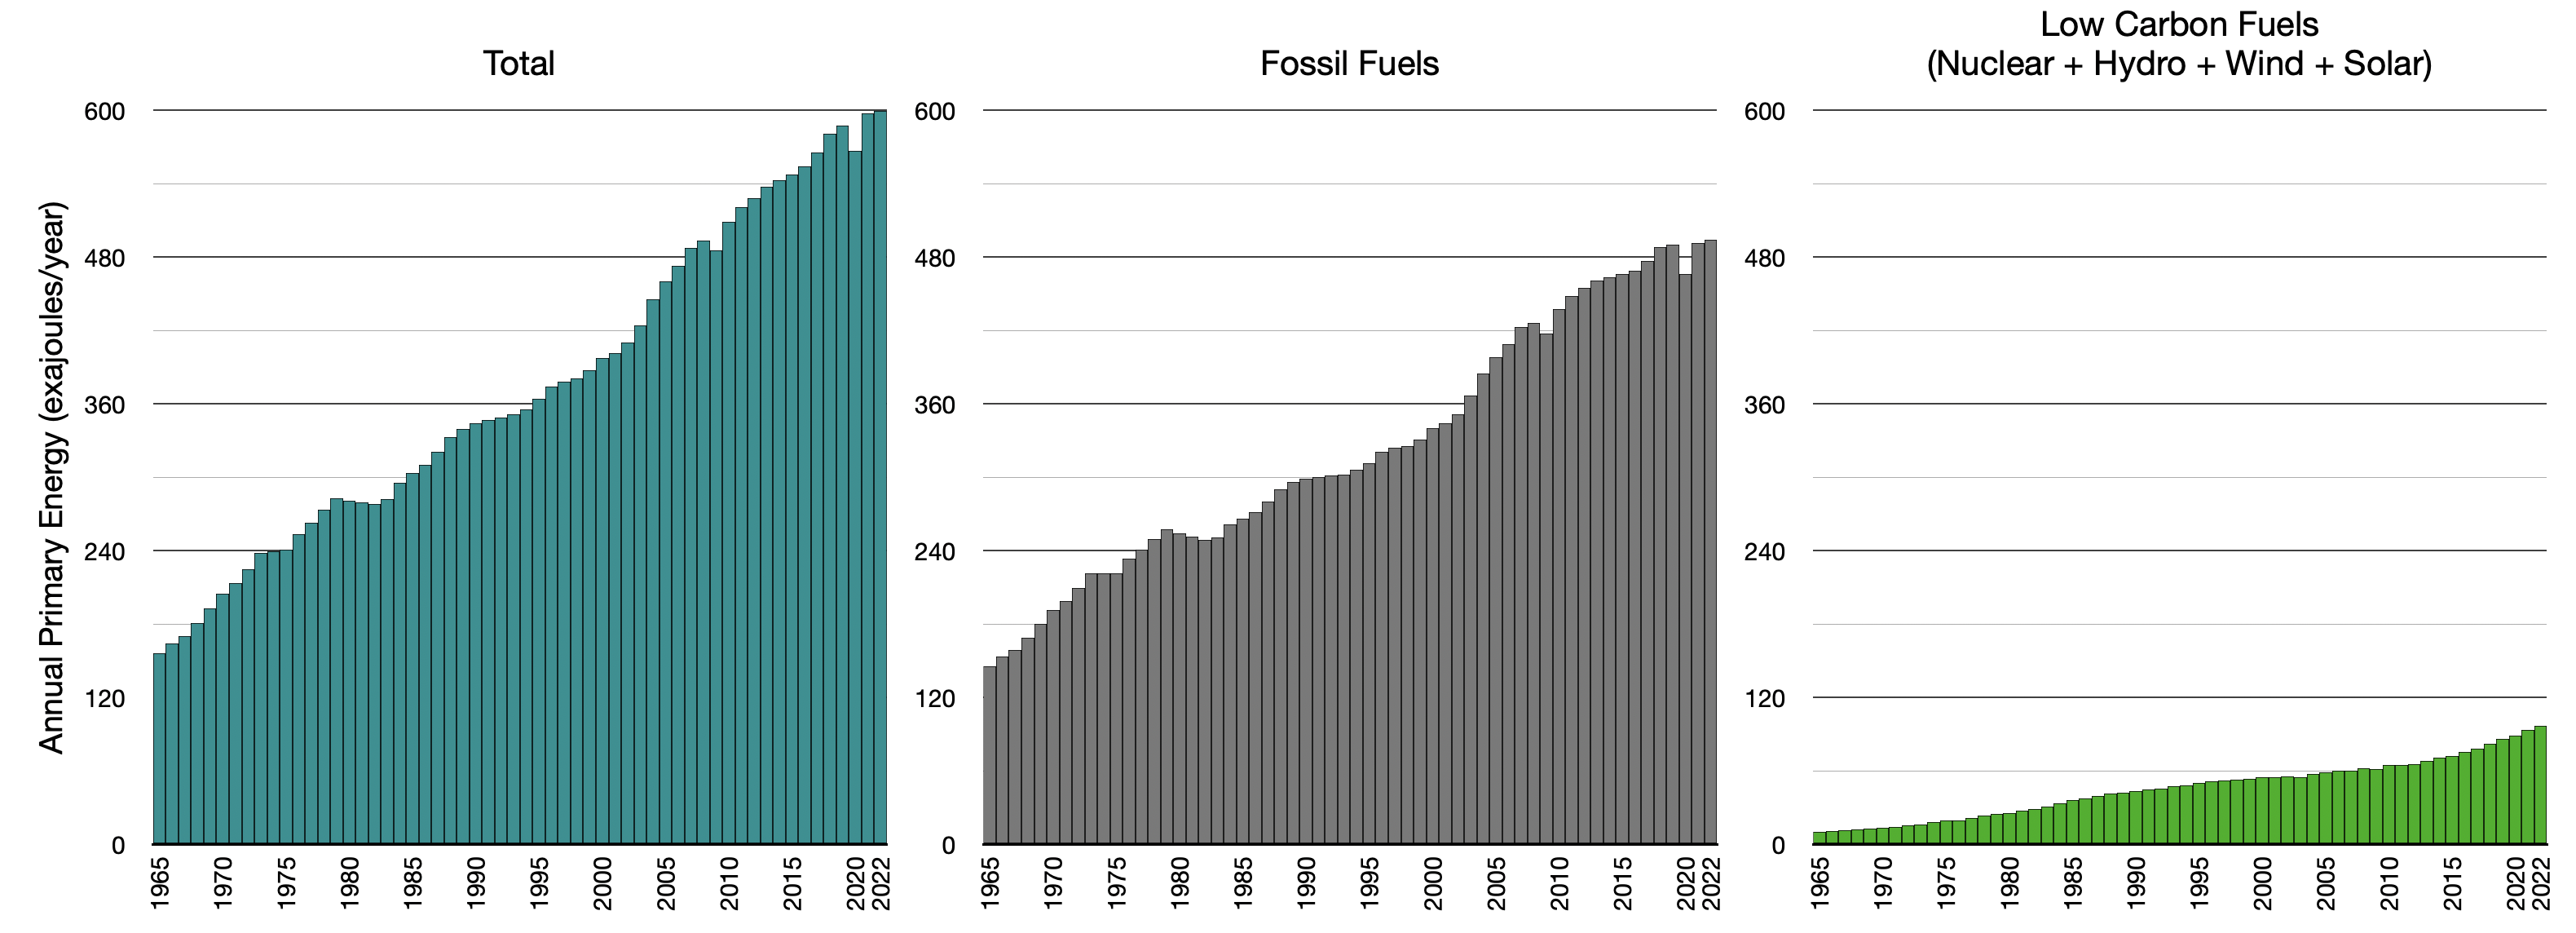
Absolute quantities
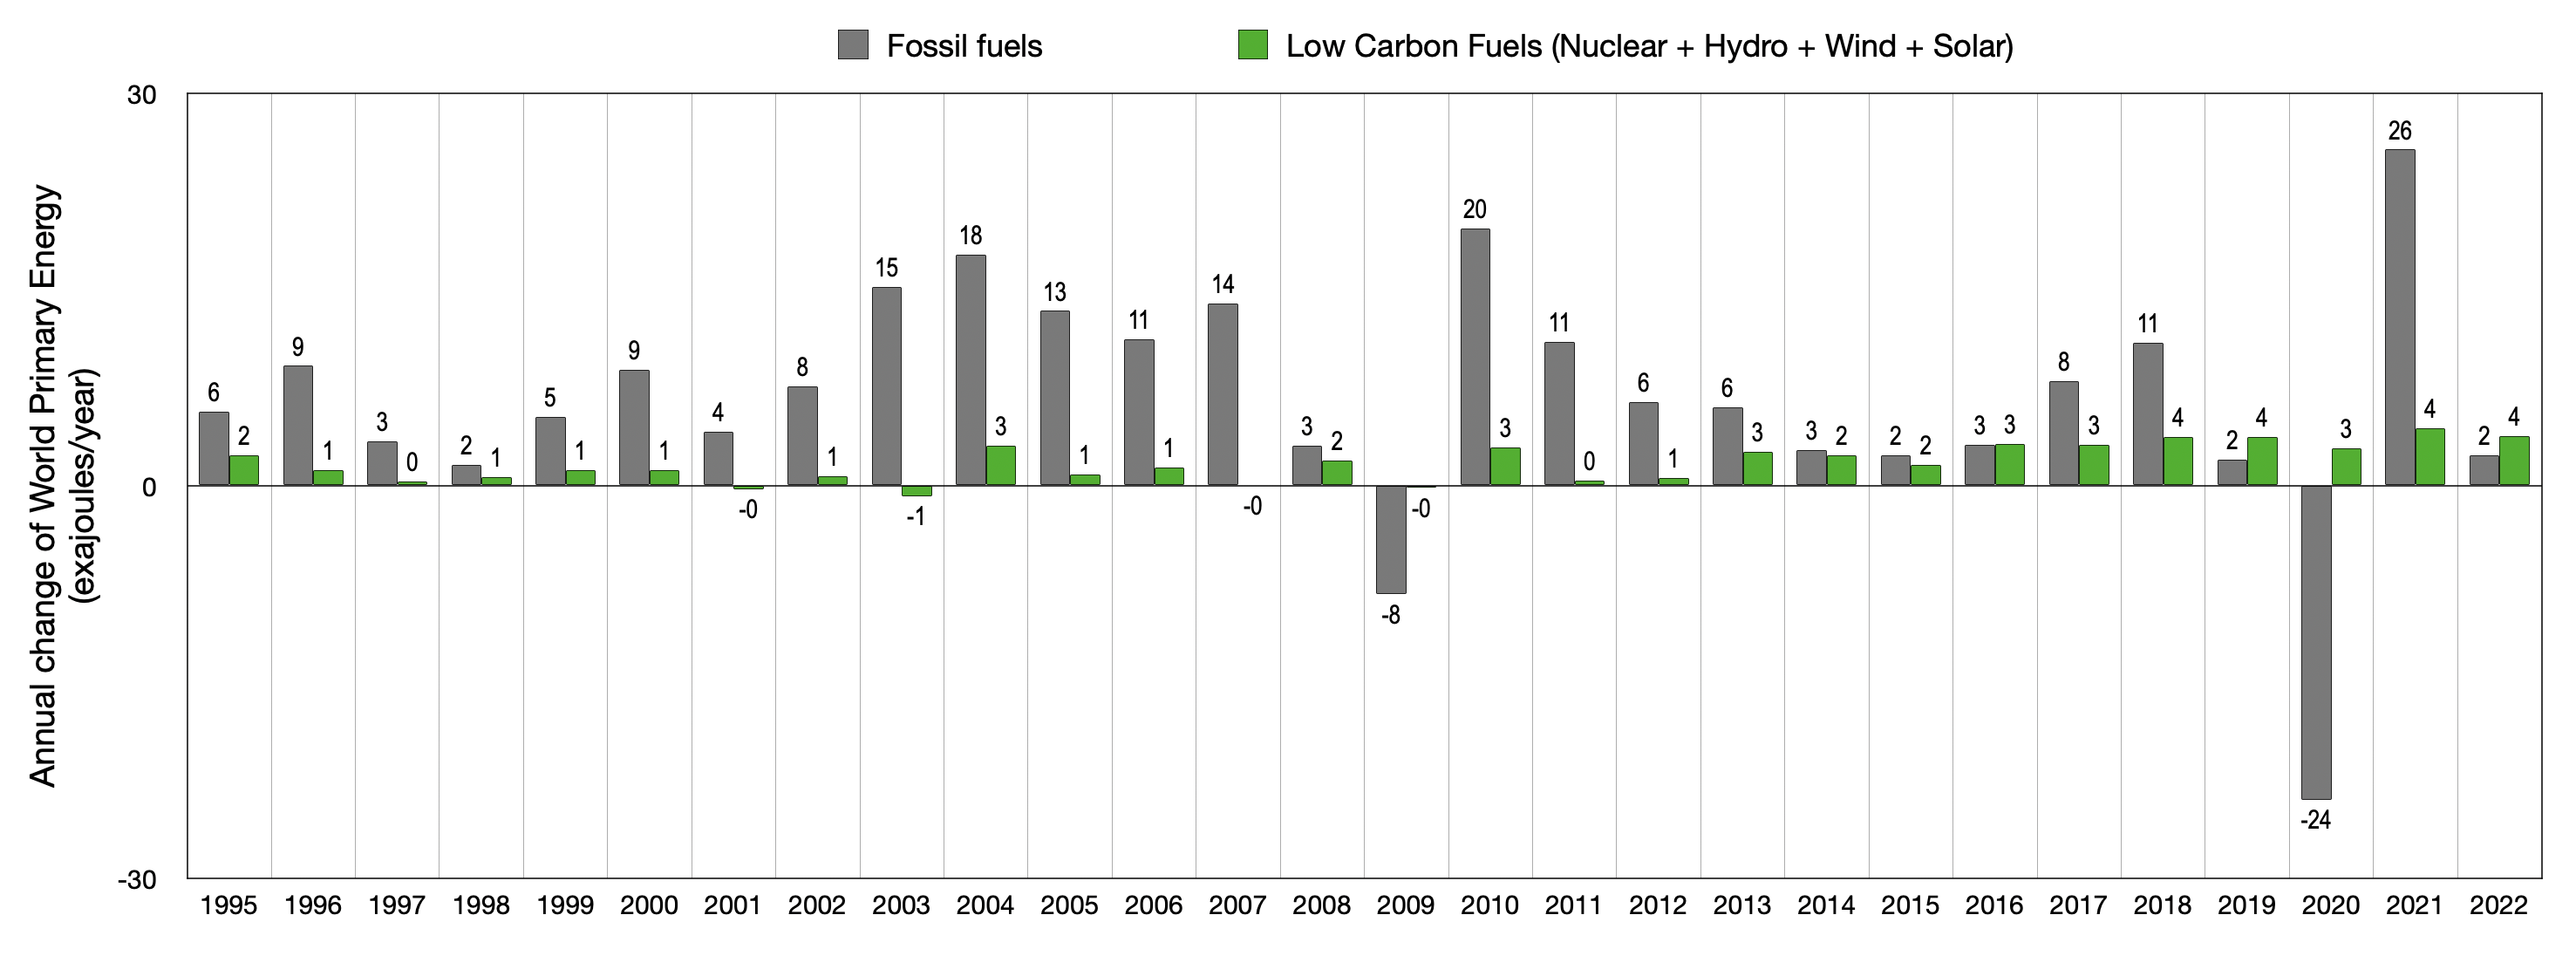
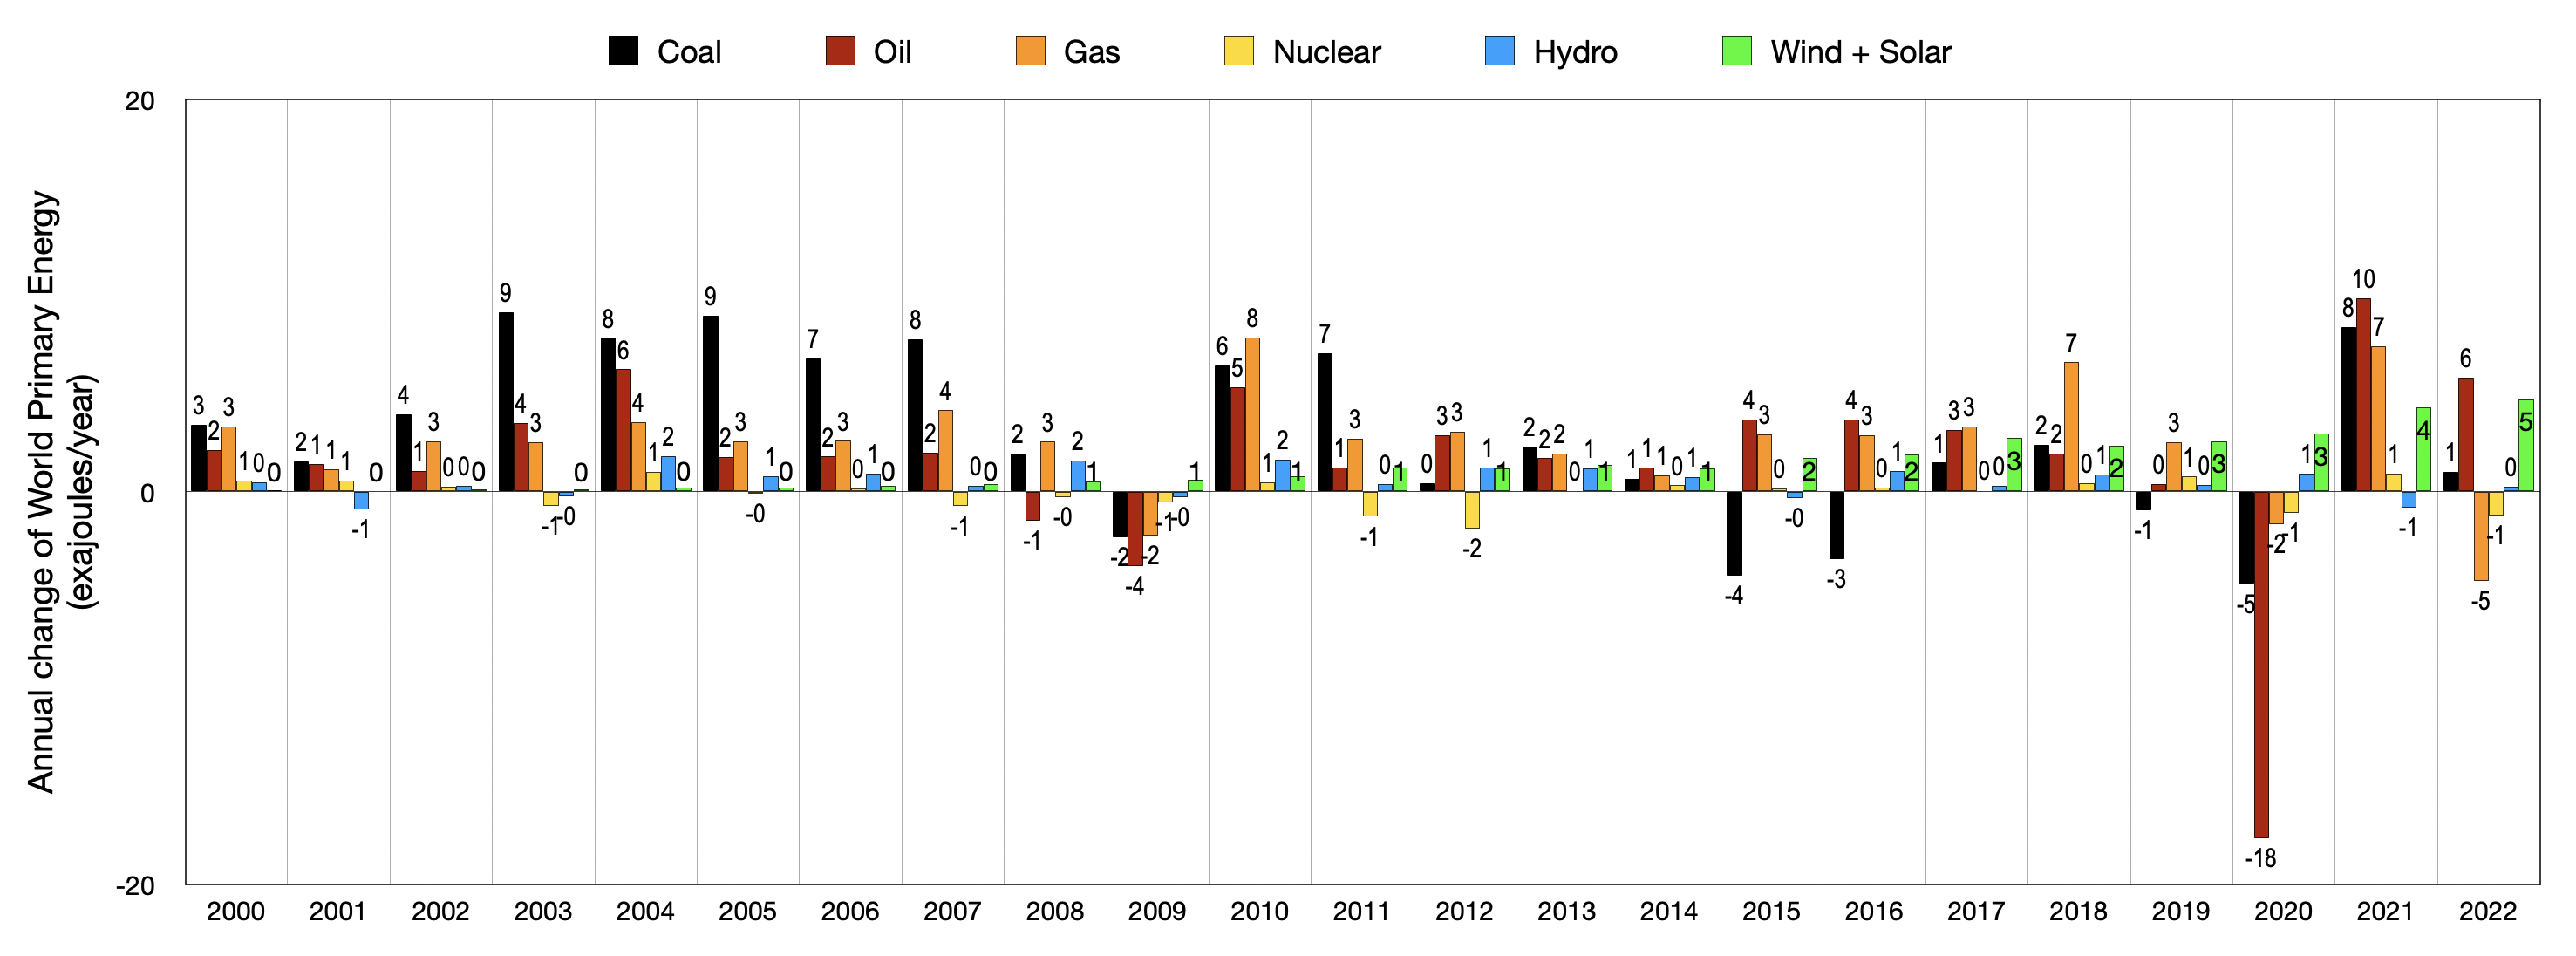
Annual additions & subtractions
Chart 14 shows that since 1995, the year of the United Nations first Climate Change Conference of Parties (COP1)22, annual reductions of fossil fuels have occurred only twice – due to the Global Financial Crisis23 and COVID24. The reduction in 2020 was more than matched by the rebound in 2021.
- 93,848/94,972[↩]
- 4043.8/4053.4[↩]
- https://www.energyinst.org/statistical-review/about[↩][↩][↩][↩][↩][↩][↩][↩][↩][↩][↩][↩][↩][↩][↩][↩]
- Sheets used were ‘Coal Production – Tonnes’, ‘Oil Production -Barrels’ and ‘Gas Production – Bcm’.[↩]
- Sheets used from the data were: 1. ‘Coal Production – Tonnes’. 2. ‘Oil Production – Barrels’. Annual figure calculated. 3. ‘Gas Production – Bcm’.[↩]
- https://www.iea.org/reports/iron-and-steel-technology-roadmap[↩]
- https://www.iea.org/reports/coal-fired-electricity states “In 2021 CO₂ emissions from coal-fired power plants rose to a record 9.7 Gt”. According to the Global Carbon Project, Global Carbon Project. (2022). Supplemental data of Global Carbon Budget 2022 (Version 1.0) [Data set]. Global Carbon Project. https://www.icos-cp.eu/science-and-impact/global-carbon-budget/2022, energy sector CO₂ emissions in 2021 totalled 14.99Gt (coal) + 11.85 (coal) + 7.93 (gas) + 0.42 (flaring) = 35.18GtCO₂, and therefore coal fired electricity generation was responsible for 9.7/35.18 = 27.6% of world energy sector CO₂ emissions.[↩]
- p.99 https://iea.blob.core.windows.net/assets/4315f4ed-5cb2-4264-b0ee-2054fd34c118/The_Oil_and_Gas_Industry_in_Energy_Transitions.pdf[↩][↩]
- Oil scope 1 + scope 2 CO₂ emissions: “95 kilogrammes of CO₂ equivalent (kgCO₂-eq) is emitted in bringing an average barrel of oil to end-use consumers.” Oil scope 3 CO₂ emissions: “The global average array of oil products produced from a barrel of crude oil equivalent in 2018 results in around 405 kgCO₂ when combusted.”, p.30 https://iea.blob.core.windows.net/assets/4315f4ed-5cb2-4264-b0ee-2054fd34c118/The_Oil_and_Gas_Industry_in_Energy_Transitions.pdf, 95/(95+405) = 19%[↩]
- Gas scope 1 + scope 2 CO₂ emissions: “For natural gas, global average scope 1 and 2 emissions are around 100 kg CO2-eq/boe.”. Gas scope 3 CO₂ emissions: There is a much smaller degree of variation in CO₂ emissions from the combustion of natural gas, but on average, emissions are 320 kgCO₂/boe” p.30 https://iea.blob.core.windows.net/assets/4315f4ed-5cb2-4264-b0ee-2054fd34c118/The_Oil_and_Gas_Industry_in_Energy_Transitions.pdf, 100/(100+320) = 24%.[↩]
- Sheet used was ‘Coal Production – Tonnes’.[↩]
- Sheet used was ‘Oil Production – Barrels’.[↩]
- Sheet used was ‘Gas Production – Bcm’.[↩]
- https://www.iea.org/data-and-statistics/data-tools/energy-statistics-data-browser?country=WORLD&energy=Balances&year=2020[↩]
- The IEA labels primary energy ‘Total Energy Supply (TES)’.[↩]
- The method used by the IEA on their own site uses their own method for TES calculations that rely on accountancy which relatively enlarges the contribution of nuclear energy, and diminishes that from other non-combustibles. This site overcomes this as explained in the introduction. The method of primary energy equivalency used by the IEA is the physical energy content method, which applies the following weights to non-combustible energy supplies: Nuclear = 33%, Geothermal heat = 50%, Geothermal electricity = 10%, Solar thermal heat = 100%, Solar thermal electricity = 33%, Hydro, wind, marine and solarPV = 100%. For further information see section A.II.4, Krey V., O. Masera, G. Blanford, T. Bruckner, R. Cooke, K. Fisher-Vanden, H. Haberl, E. Hertwich, E. Kriegler, D. Mueller, S. Paltsev, L. Price, S. Schlömer, D. Ürge-Vorsatz, D. van Vuuren, and T. Zwickel, 2014: Annex II: Metrics & Methodology. In: Climate Change 2014: Mitigation of Climate Change. Contribution of Working Group III to the Fifth Assessment Report of the Intergovernmental Panel on Climate Change [Edenhofer, O., R. Pichs-Madruga, Y. Sokona, E. Farahani, S. Kadner, K. Seyboth, A. Adler, I. Baum, S. Brunner, P. Eickemeier, B. Kriemann, J. Savolainen, S. Schlömer, C. von Stechow, T. Zwickel and J.C. Minx (eds.)]. Cambridge University Press, Cambridge, United Kingdom and New York, NY, USA. https://www.ipcc.ch/site/assets/uploads/2018/02/ipcc_wg3_ar5_annex-ii.pdf[↩]
- The EI labels primary energy as ‘Energy Consumption’.[↩]
- https://www.worldenergydata.org/biofuels/[↩]
- https://www.iea.org/data-and-statistics/data-browser?country=WORLD&fuel=Energy%20supply&indicator=TESbySource[↩]
- Substitution method of primary energy equivalency applied to non-combustible data. For more information see this website’s guide.[↩]
- The share of marine energy (tidal, wave, etc) is too small to show, at 0.0015%.[↩]
- https://en.wikipedia.org/wiki/United_Nations_Climate_Change_conference#1995:_COP_1,_Berlin,_Germany[↩][↩][↩]
- https://en.wikipedia.org/wiki/Financial_crisis_of_2007%E2%80%932008[↩]
- https://en.wikipedia.org/wiki/COVID-19[↩]