Organisation of this and the following two posts is adapted from the paper ‘Assessing ‘‘Dangerous Climate Change’’: Required Reduction of Carbon Emissions to Protect Young People, Future Generations and Nature’.1
Arctic feedback
Global warming is rapidly melting Arctic sea ice, thereby triggering a fast amplifying feedback that drives further warming. This is known as polar amplification or the sea ice/ocean surface albedo feedback: “With retreating sea ice, surface albedo decreases, air temperatures increase and the ocean can absorb more heat. The resulting ocean warming contributes to further sea ice melting.”2
Sea ice helps to keep the Arctic atmosphere cold. Its whiteness reflects much of the Sun’s energy back to space, and it physically insulates the Arctic atmosphere from the underlying Arctic Ocean. With less sea ice, more dark open water is exposed, which readily absorbs the Sun’s energy in summer, heating the ocean and leading to even more melt. With less sea ice there is also less insulation, so that heat from the ocean escapes to warm the atmosphere in the autumn and winter.
NSIDC, 2009, Highlights–Arctic Amplification.3
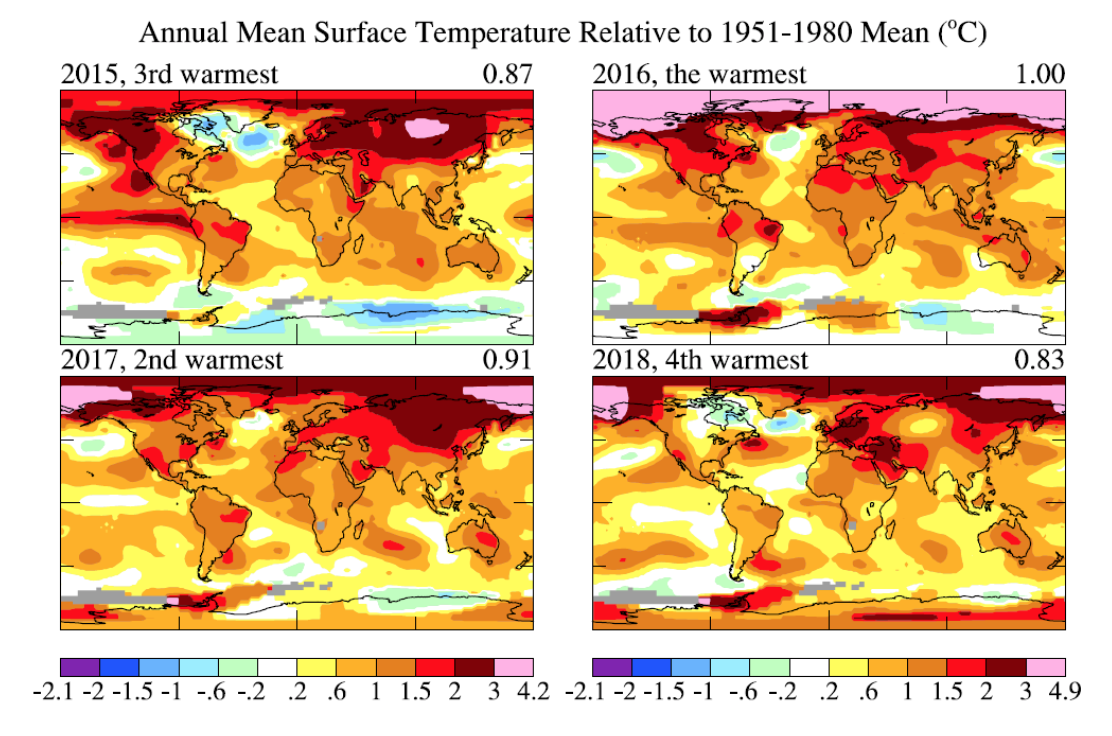
Surface air temperatures in the Arctic continued to warm at twice the rate relative to the rest of the globe. Arctic air temperatures for the past five years (2014-18) have exceeded all previous records since 1900.
In 2018 Arctic sea ice remained younger, thinner, and covered less area than in the past. The 12 lowest extents in the satellite record have occurred in the last 12 years.
NOAA, 2018, Arctic Report Card.5
Dr. Osborne, the lead editor of the report and manager of NOAA’s Arctic Research Program, said the Arctic was undergoing its “most unprecedented transition in human history.”
In 2018, “warming air and ocean temperatures continued to drive broad long-term change across the polar region, pushing the Arctic into uncharted territory,” she said at a meeting of the American Geophysical Union in Washington.
NYT, 2018, Warming in Arctic Raises Fears of a ‘Rapid Unraveling’ of the Region.6
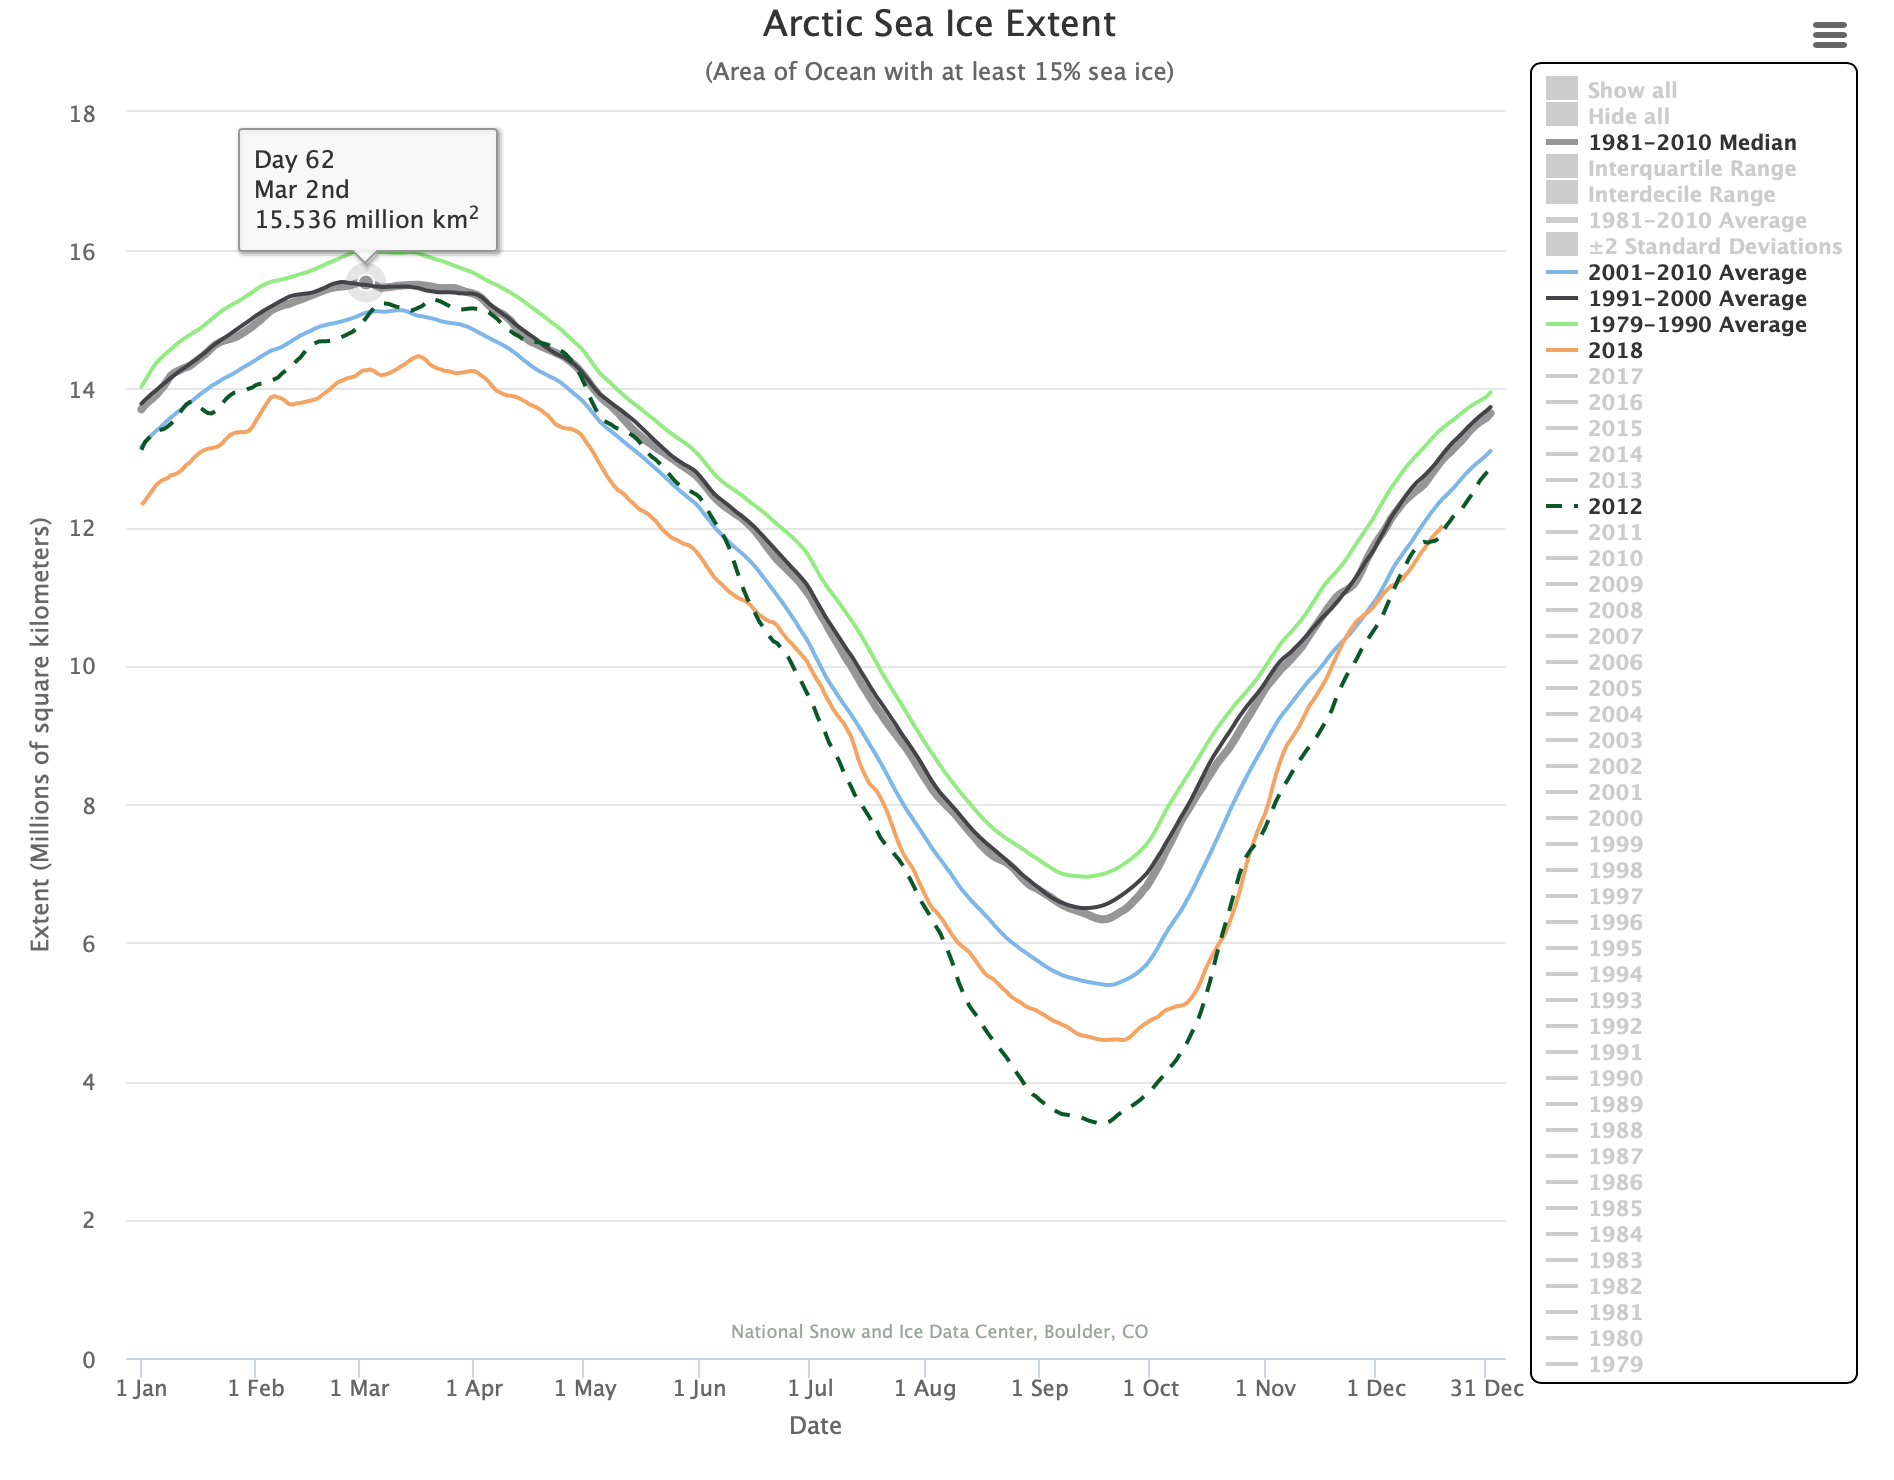
Arctic sea ice extent7 increases during the colder months, reaching a maximum in March, and decreases in the warmer months, reaching a minimum in September. This cycle is shown below.
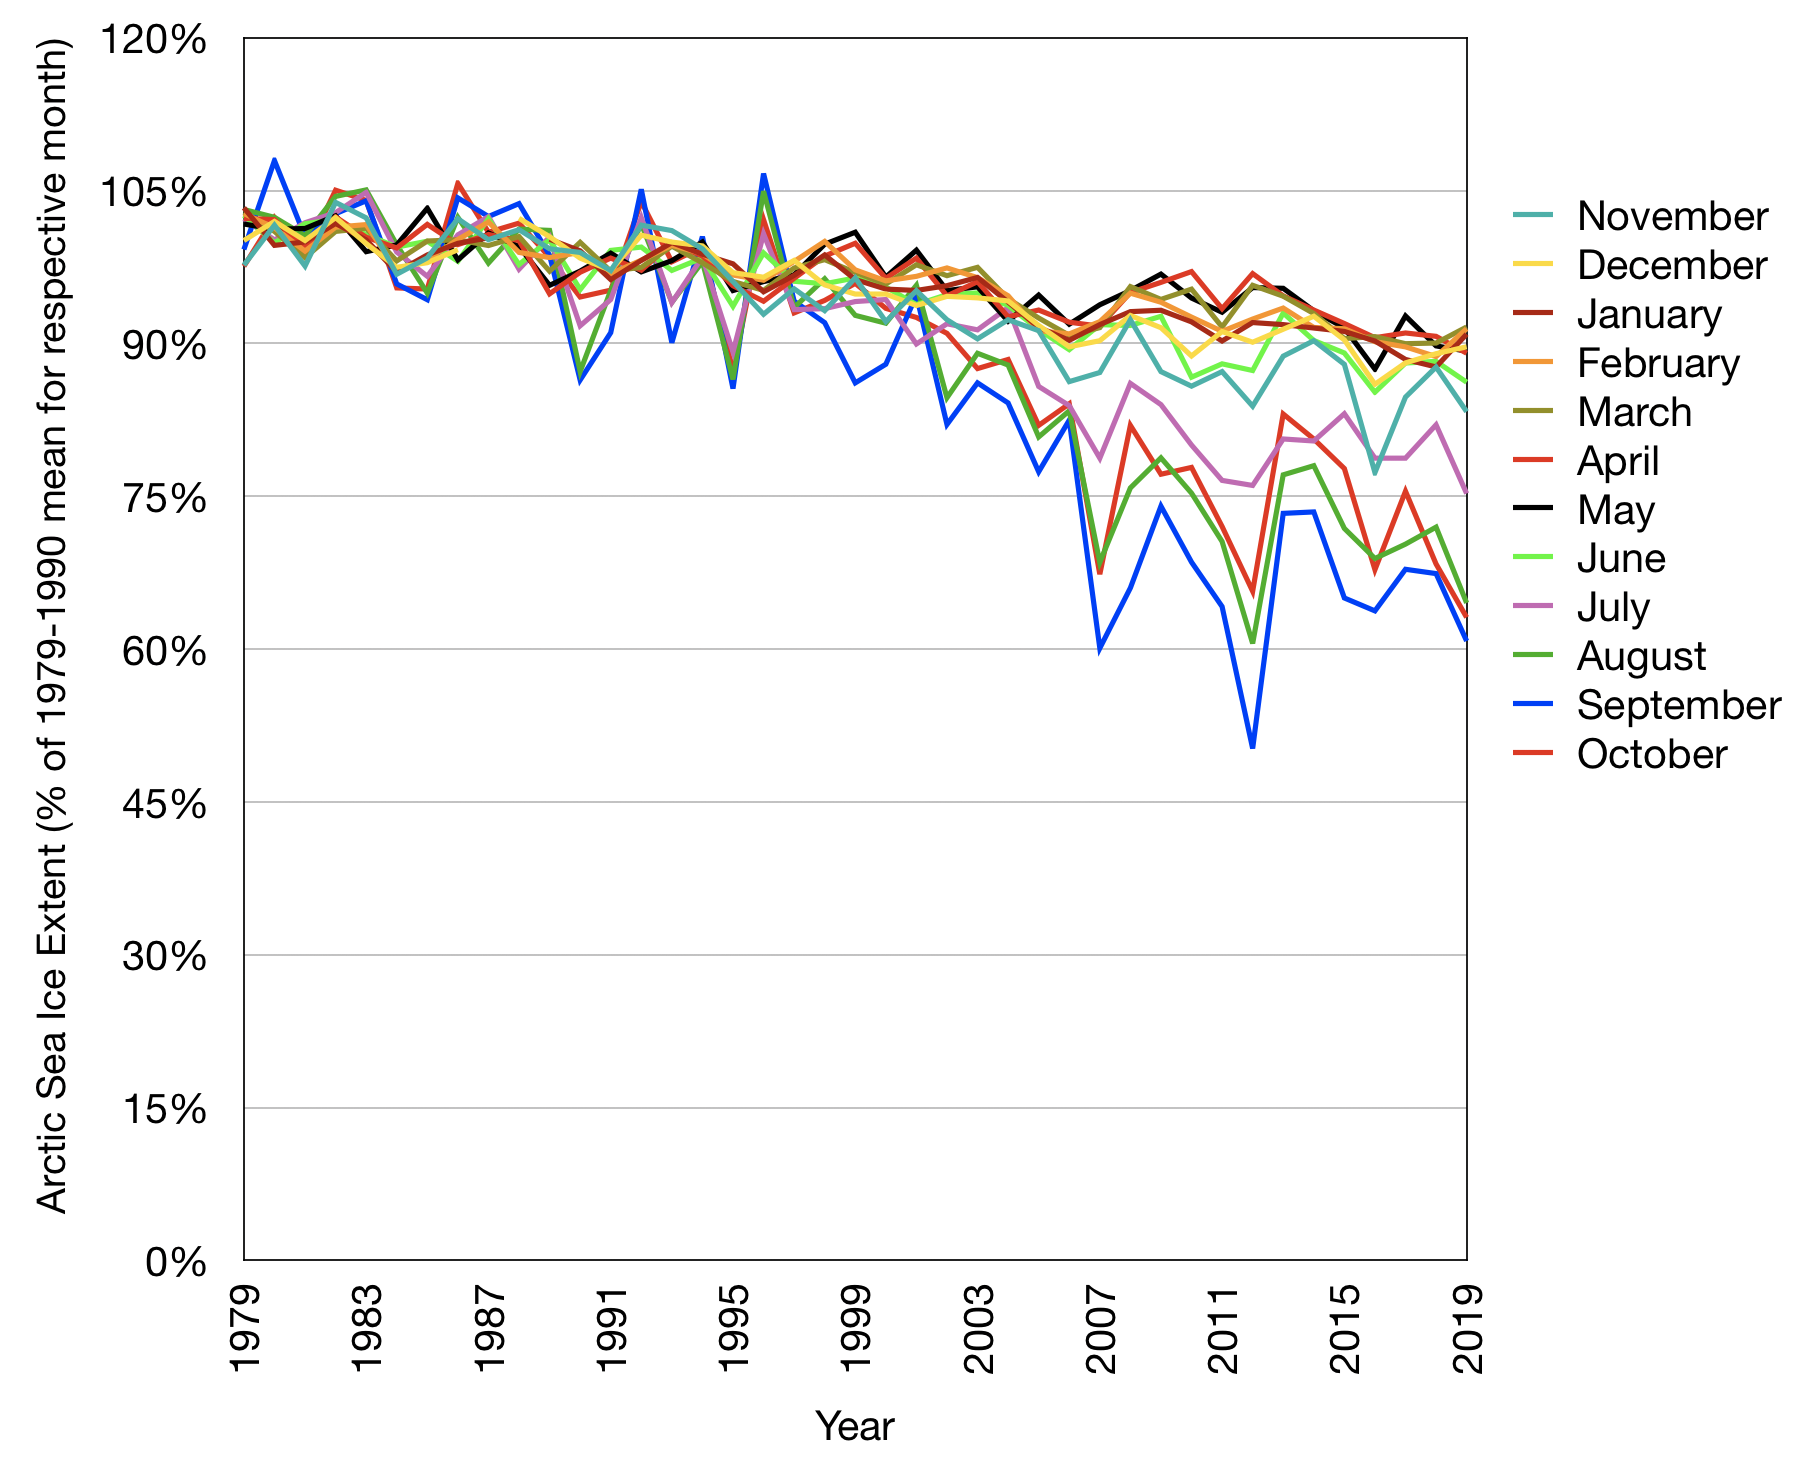
Arctic sea ice extent during warm months has declined to 60% of the 1979-90 mean (i.e. average) for each month.
The following video explains the decline of the annual creation and extent of Arctic sea ice.
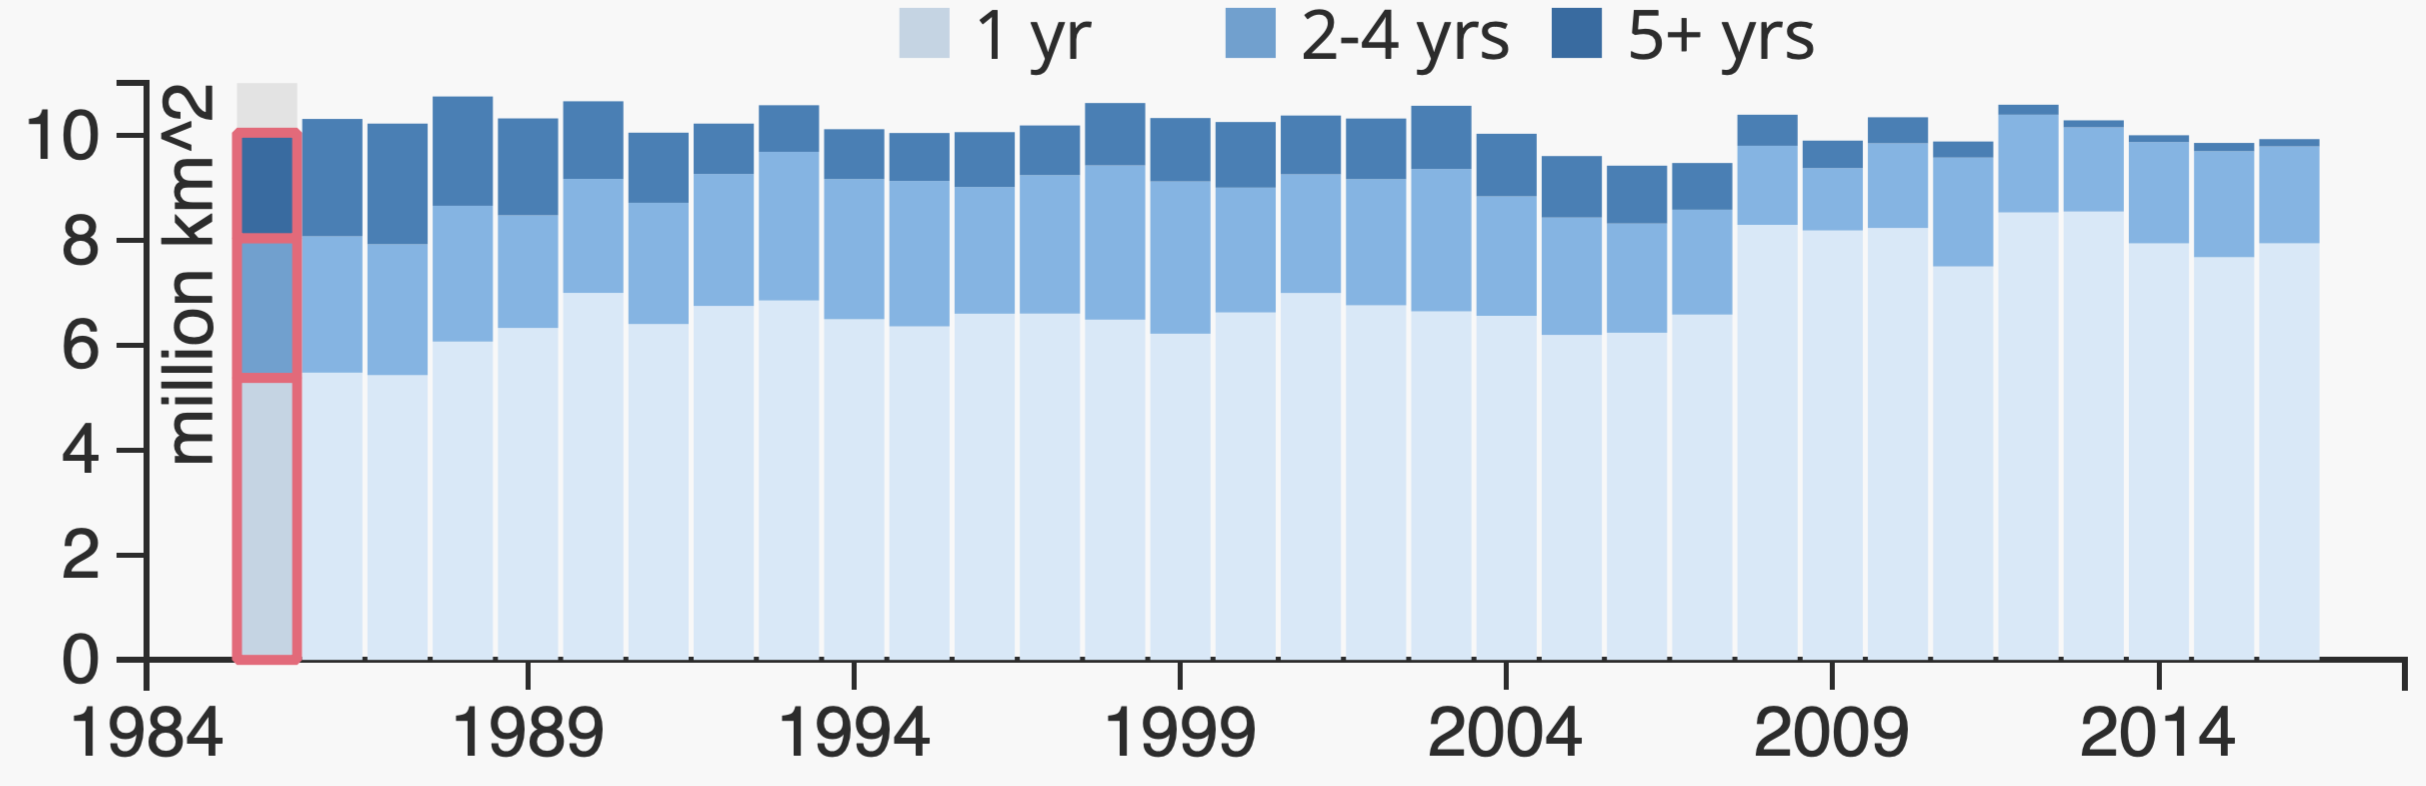
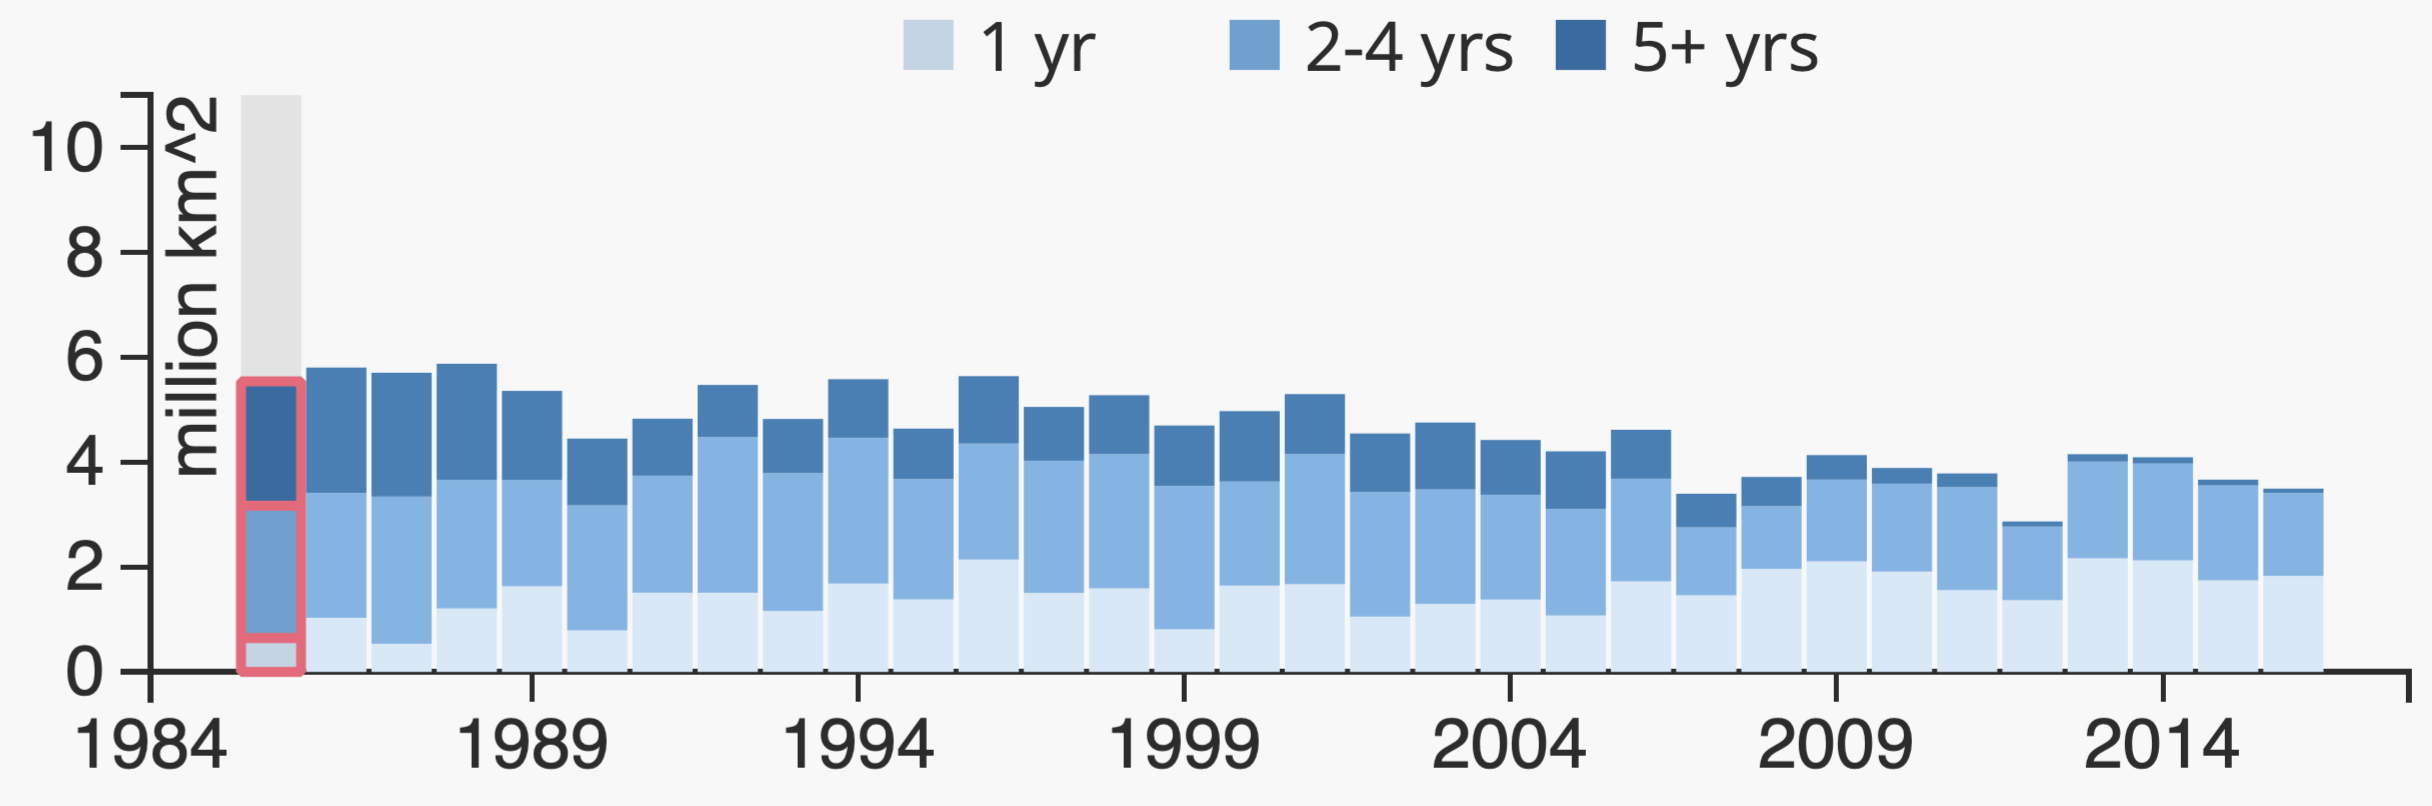
Older, and therefore thicker Arctic sea ice has almost completely disappeared:
Over the past three decades of global warming, the oldest and thickest ice in the Arctic has declined by a stunning 95 percent, according the National Oceanic and Atmospheric Administration’s annual Arctic Report Card.11
The finding suggests that the sea at the top of the world has already morphed into a new and very different state, with major implications not only for creatures such as walruses and polar bears but, in the long term, perhaps for the pace of global warming itself.
Increasingly, what remains is ice that only forms after the peak warmth of the summer, usually in September, and which may not survive the following summer. This “first year ice” is more brittle, more easily tossed around by winds and waves, rendering the Arctic ice pack more mobile and prone to breaking apart.
In 1985, the new NOAA report found, 16 percent of the Arctic was covered by the very oldest ice, more than four years old, at the height of winter. But by March, that number had dropped to under 1 percent. That’s a 95 percent decline.
At the same time, the youngest, first-year ice has gone from 55 percent of the pack in the 1980s to 77 percent, the report finds. (The remainder is ice that is two to three years old.)
The Washington Post, 2018, The Arctic Ocean has lost 95 percent of its oldest ice — a startling sign of what’s to come.12
This process of reverse-aging, scientists say, is all headed to a crucial moment — when all of the ice in the Arctic will be thin and a year old or less. When that happens — the day of maximum youth — we will be on the verge of a much feared milestone: an entirely ice-free Arctic Ocean in summer.
“Looking down from the North Pole from above, for all intents and purposes, you’re going to see a blue Arctic Ocean” Meier said.14Ramanathan15 fears that entirely ice-free summers, if they began to occur regularly, could add another half-degree Celsius (0.9 degrees Fahrenheit) of warming on top of whatever else the planet has experienced by that time.
The Washington Post, 2018, The Arctic Ocean has lost 95 percent of its oldest ice — a startling sign of what’s to come.12
“If that were to happen, I would think of it as an unmitigated disaster,” said Ramanathan of consistently ice-free Arctic summers. “It will quickly pump in this half a degree warming.”
Glaciers
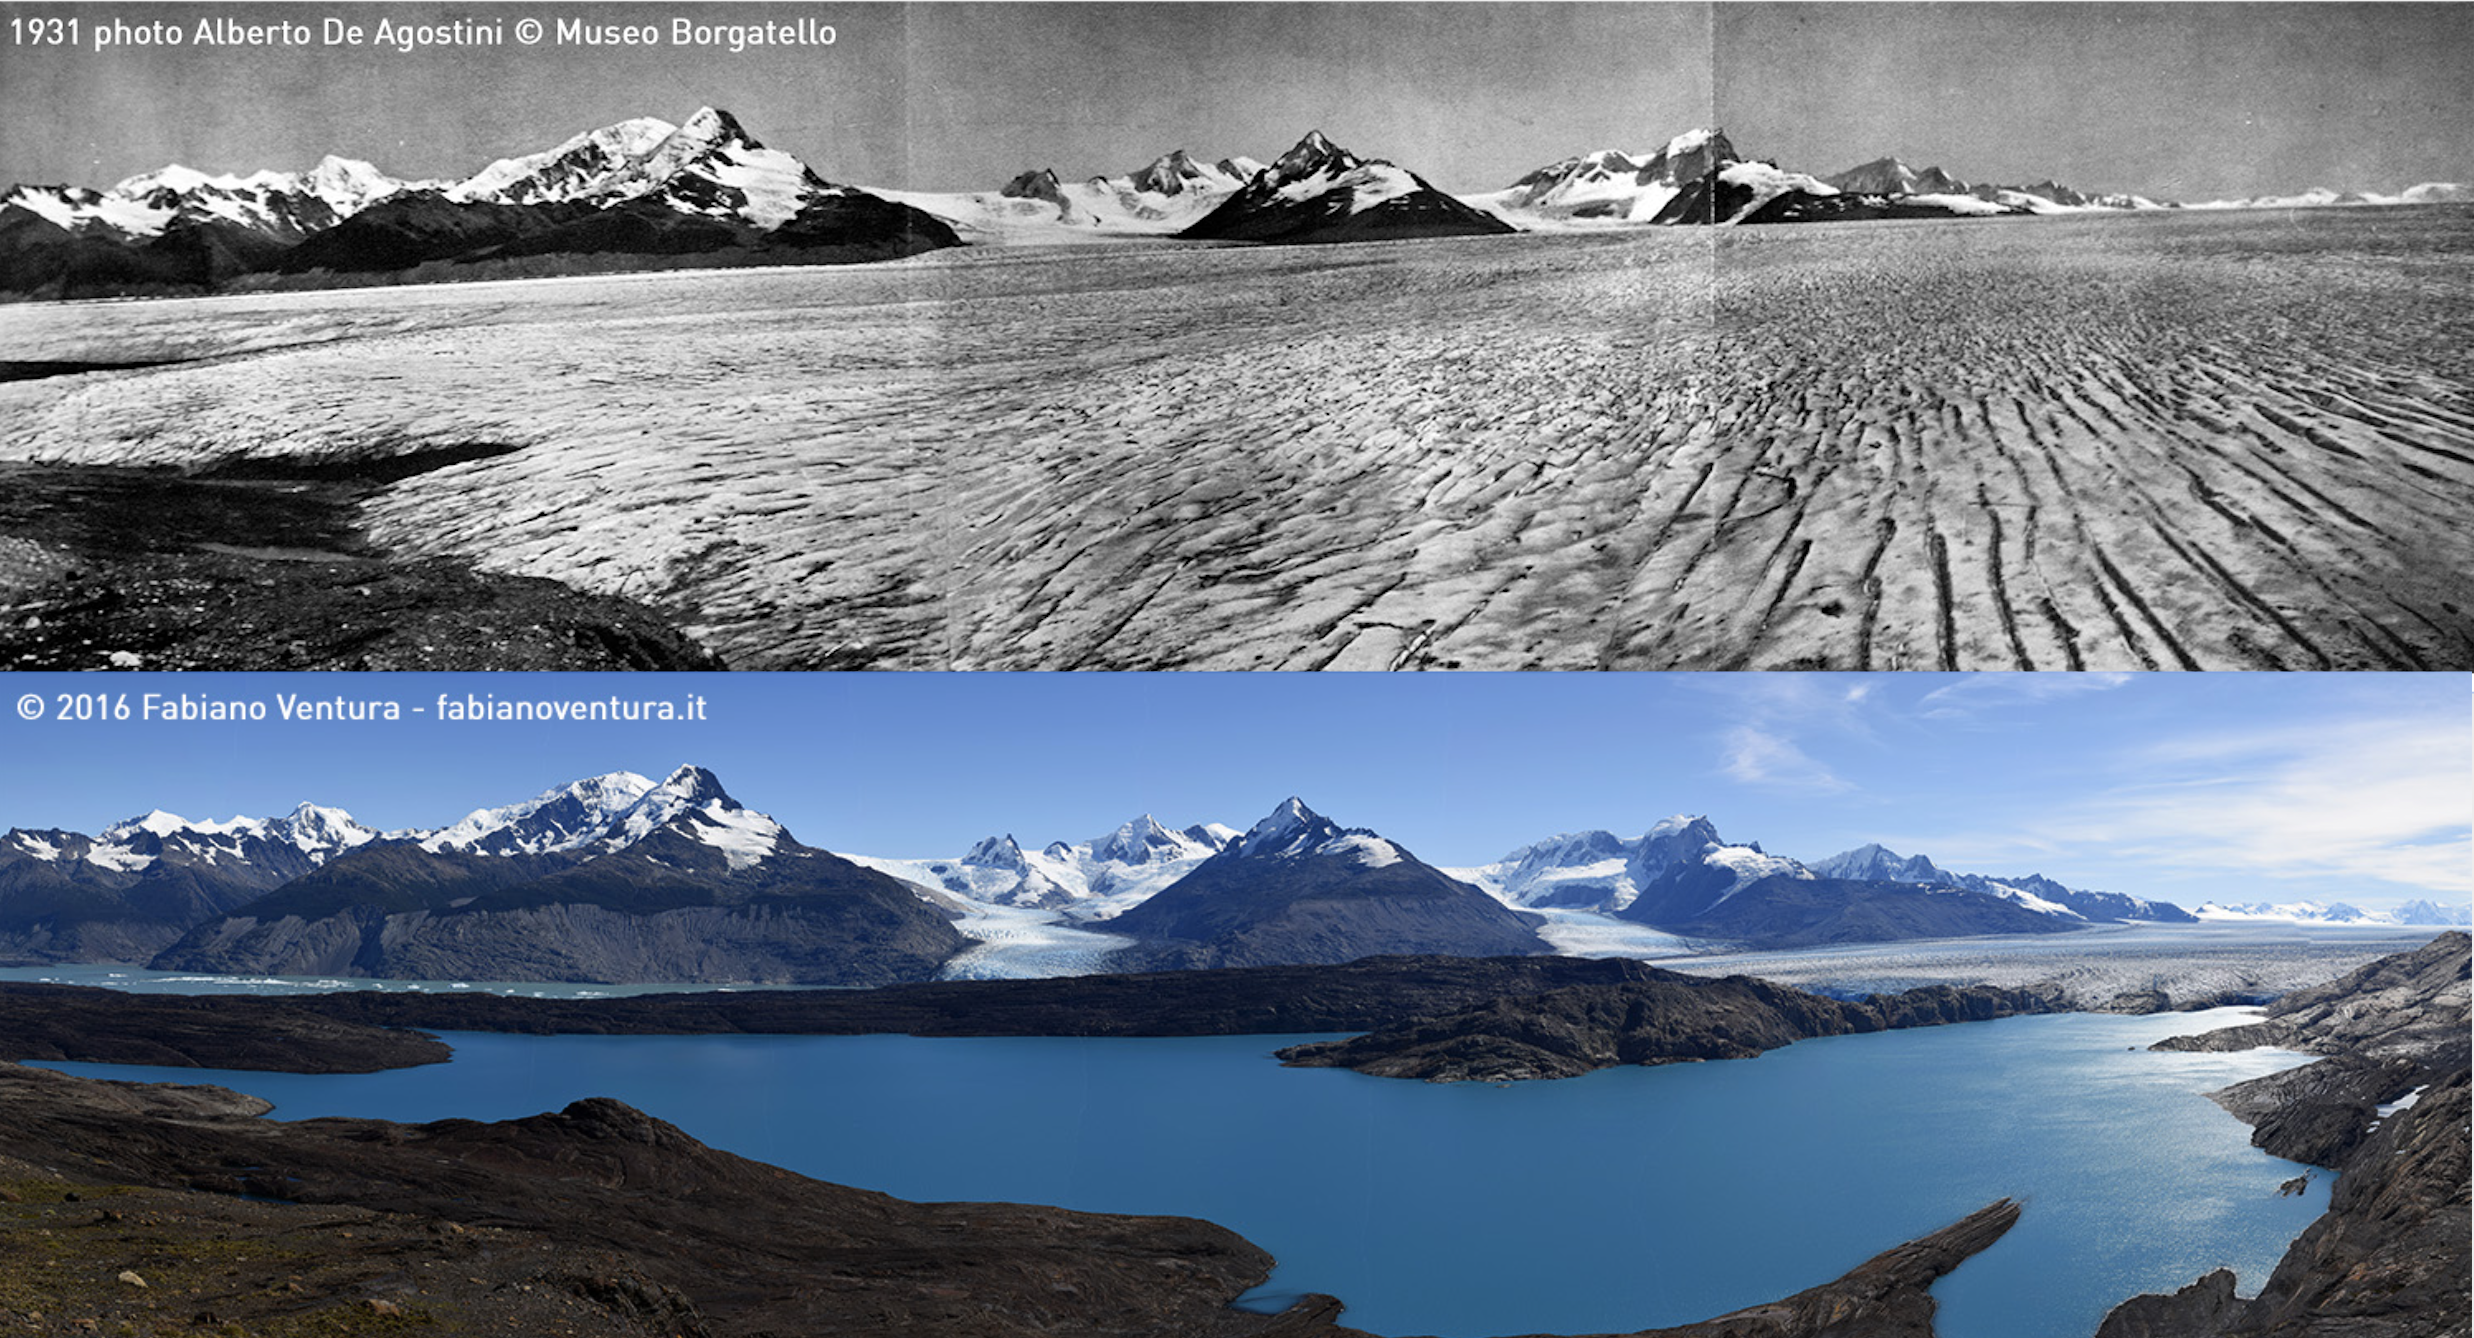
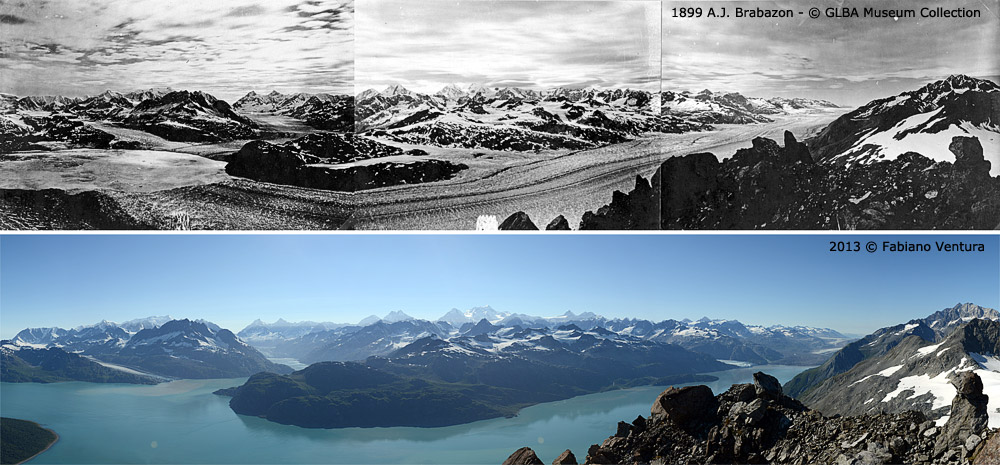
A striking consequence of global warming16 is rapid retreat of glaciers, such as the Upsala glacier in the Southern Andes:
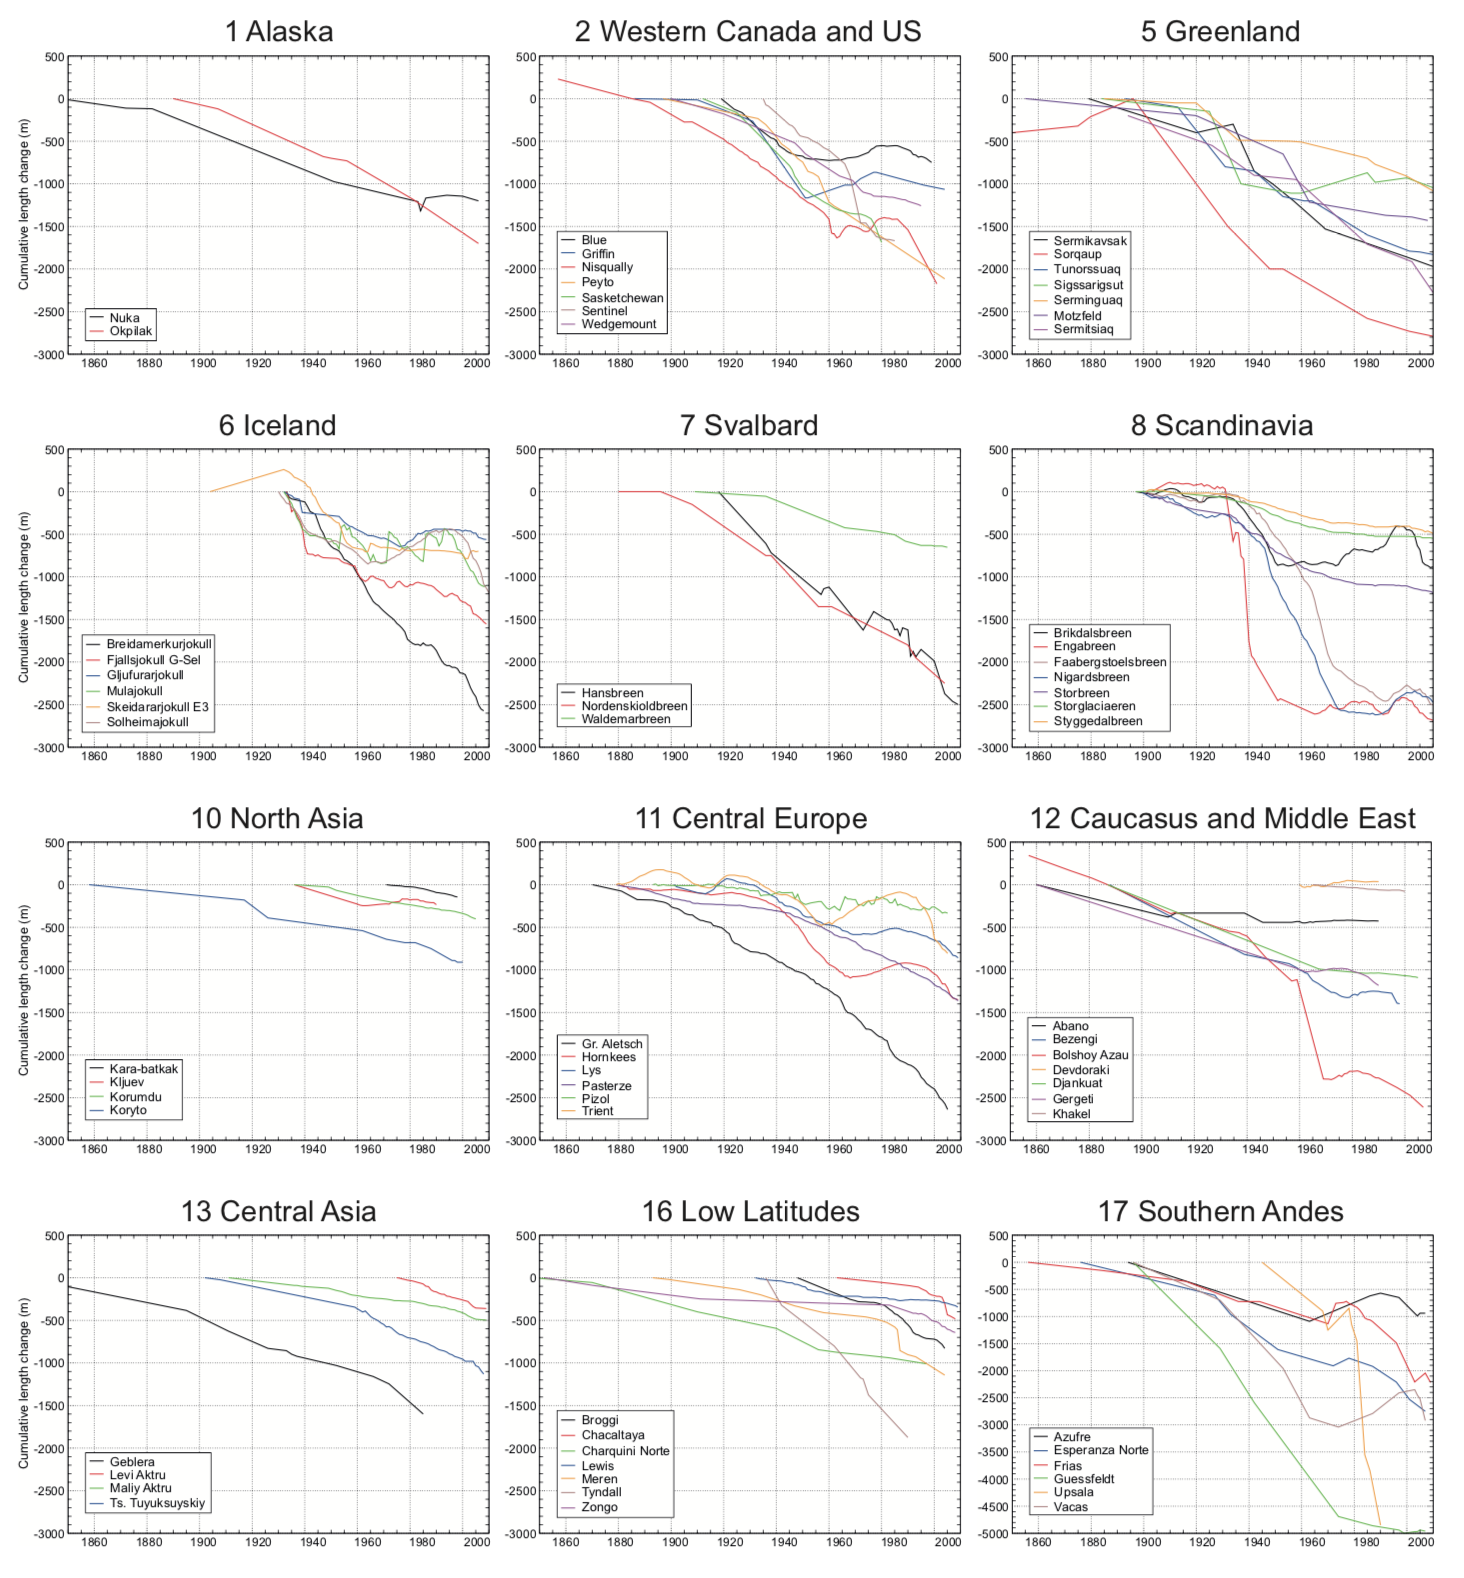
The charts below show the obvious global trend of glacier retreat:
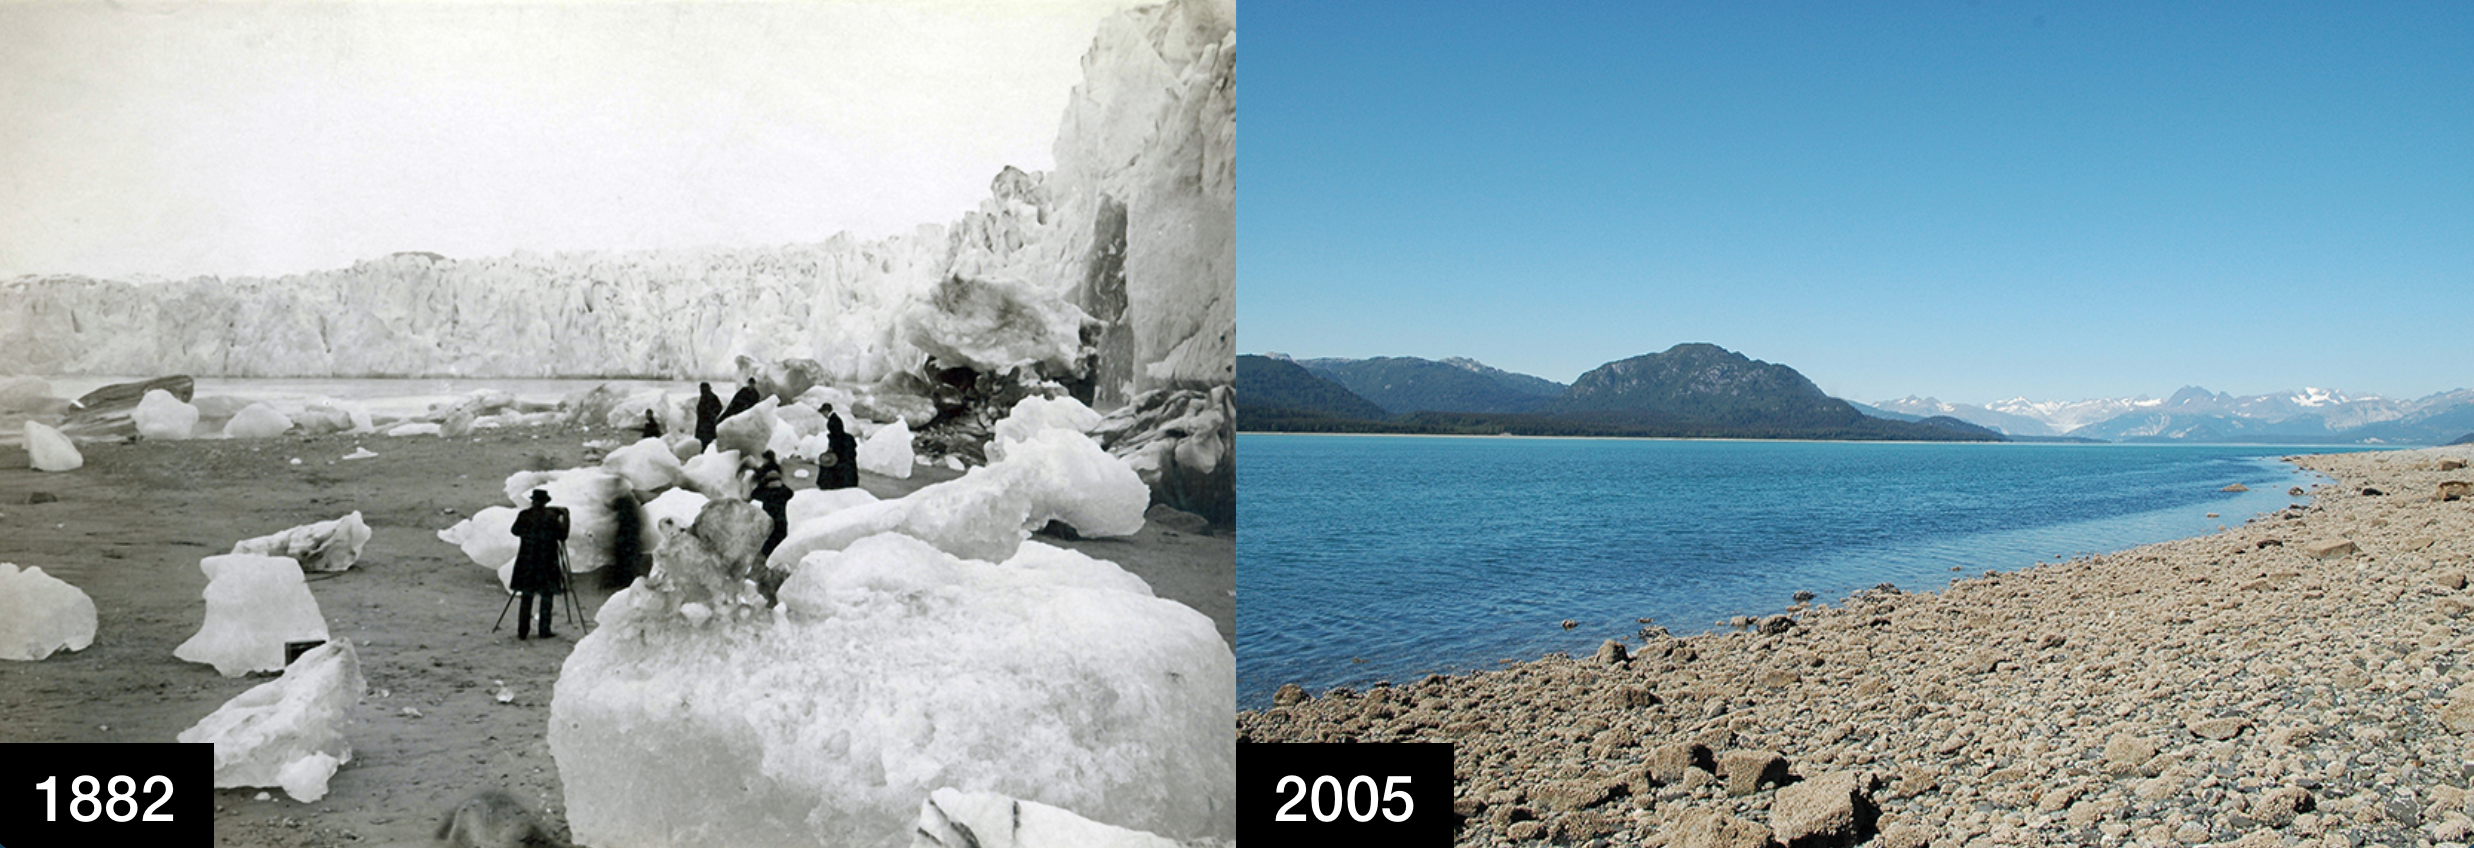
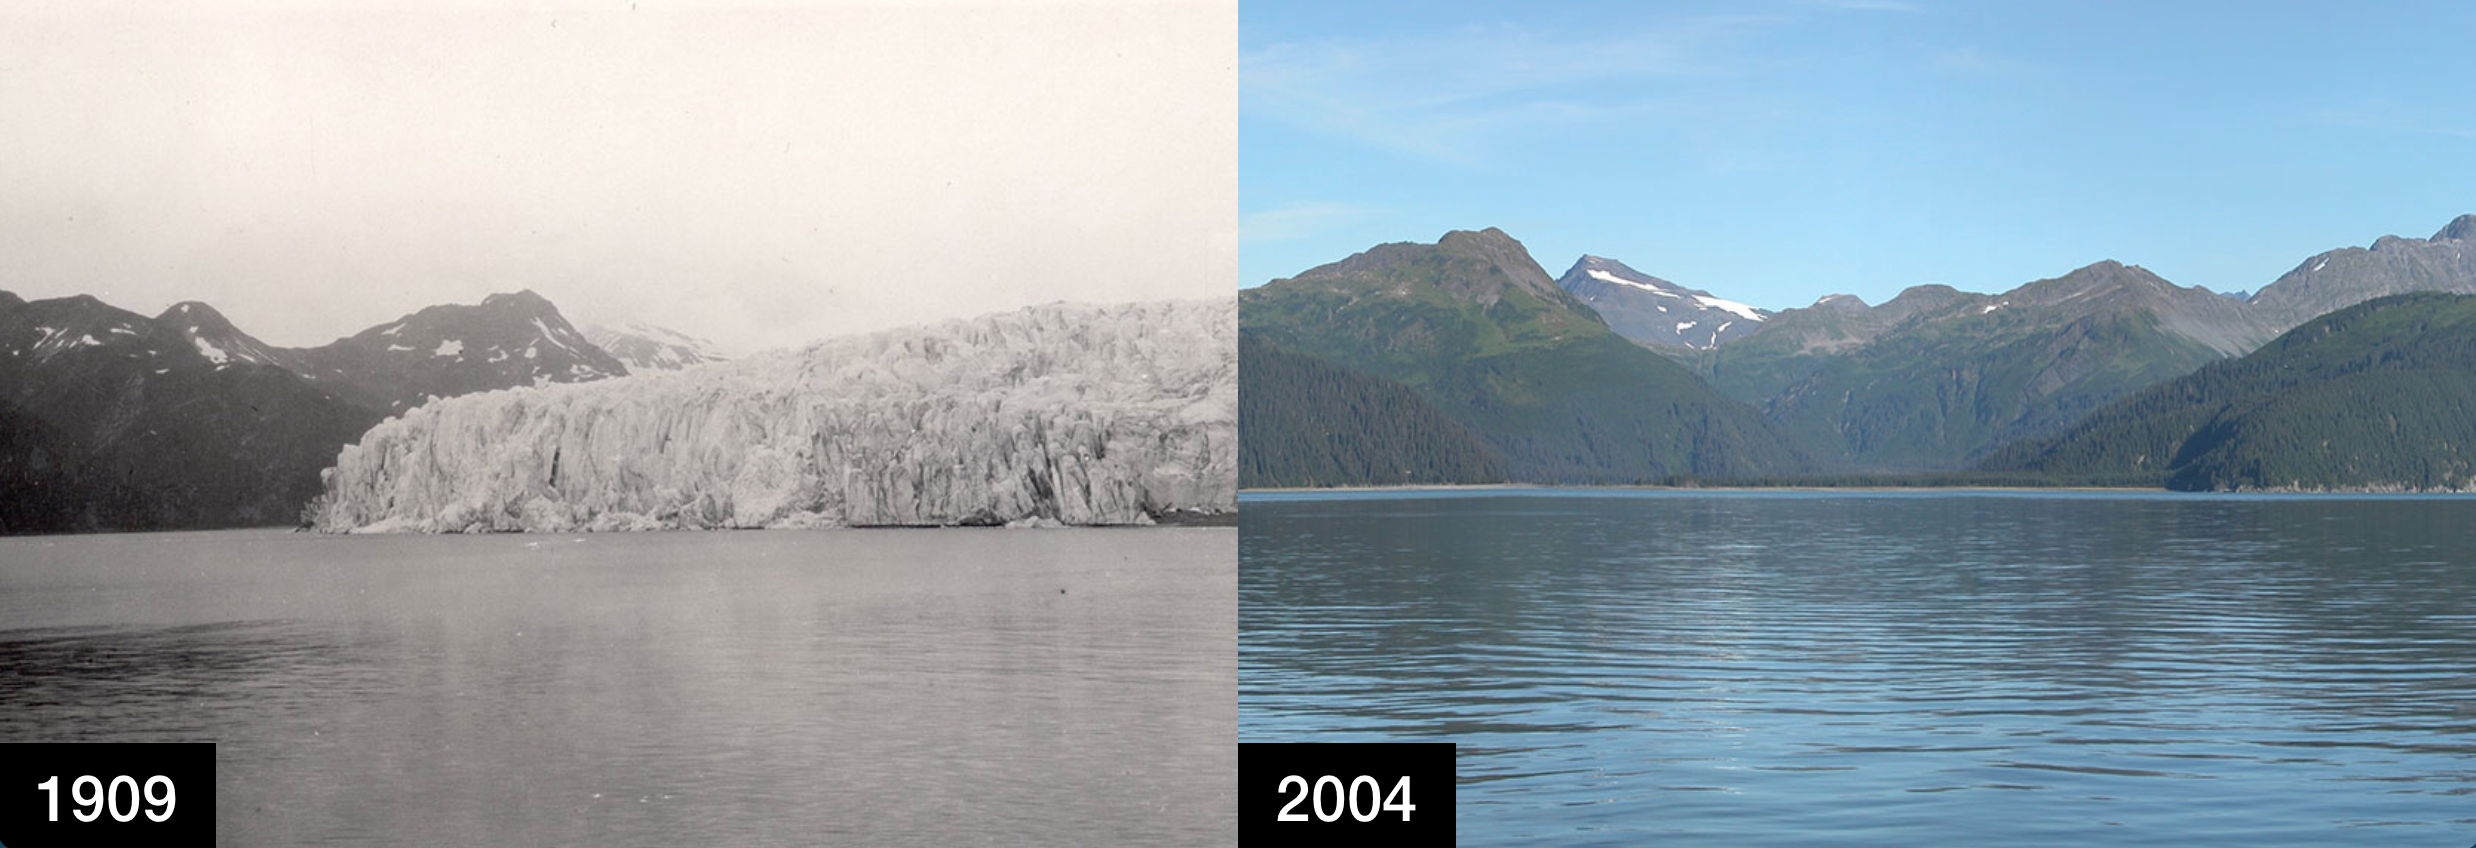
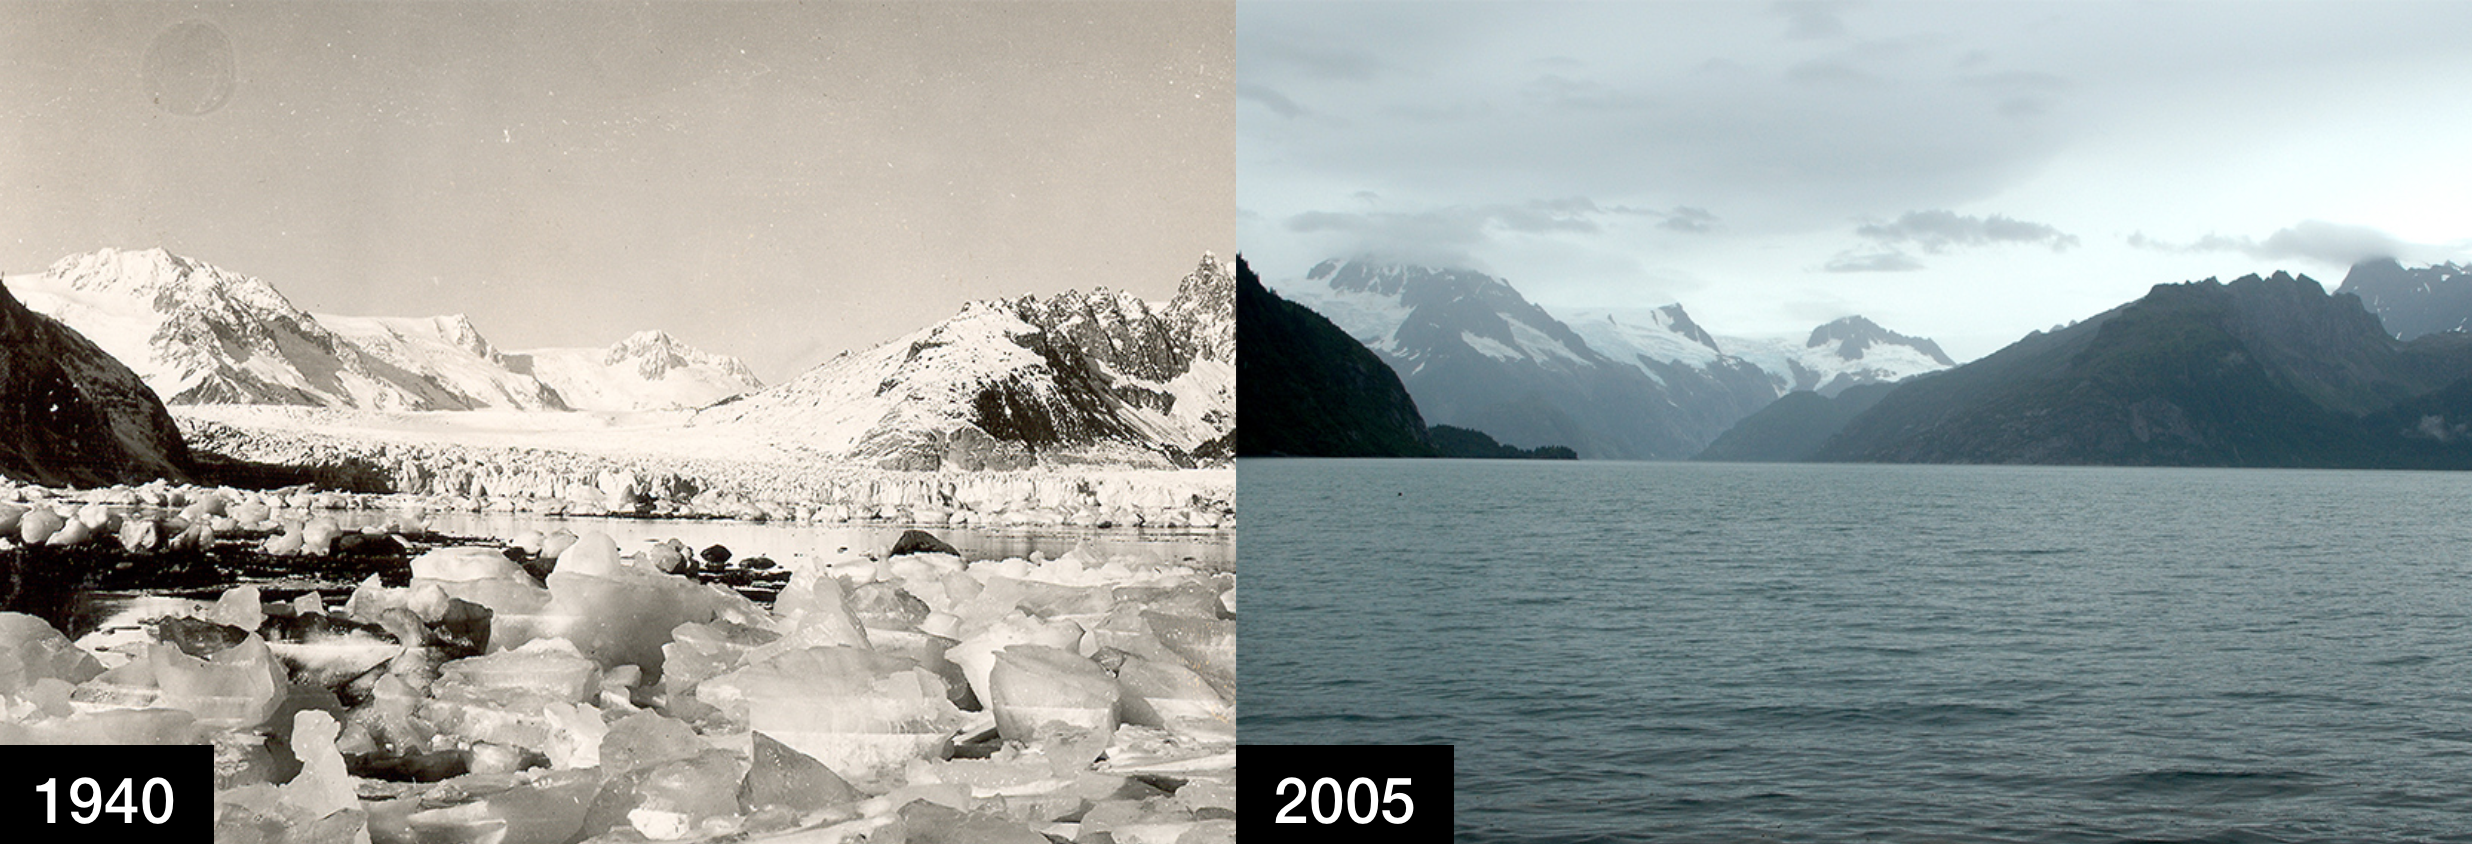
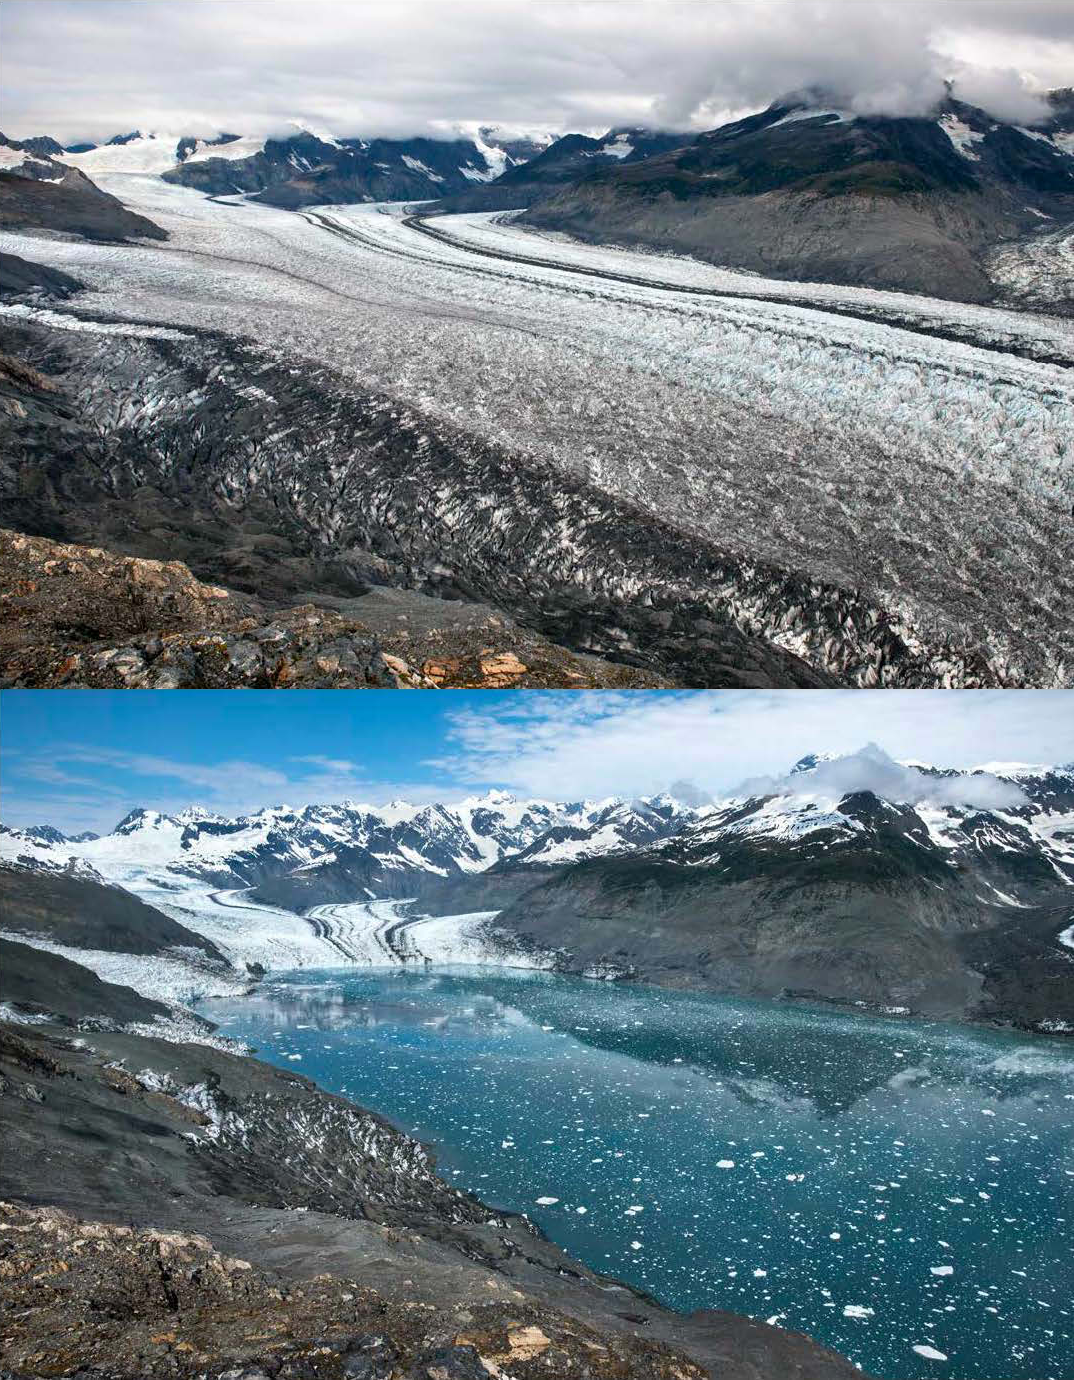
Glaciers in Alaska have dramatically retreated:
Water from glacial runoff is an important supply for some cities and rural communities, for agricultural production and for hydroelectric power generation. Glaciers help to regulate streamflow in regions where water is stored during colder periods of the year, and later released as melt water runoff during warm dry conditions.22 An example of this is the Chacaltaya glacier, that was a supply of water for drinking and hydroelectric power in Bolivia’s main cities, La Paz and El Alto.23 The three main dams that supply these cities are no longer fed by runoff from glaciers and have almost run dry. Water rationing was introduced and the armed forces were brought in to distribute water while emergency wells were drilled.24
- p.6, Hansen J, Kharecha P, Sato M, Masson-Delmotte V, Ackerman F, Beerling DJ, et al. (2013) Assessing “Dangerous Climate Change”: Required Reduction of Carbon Emissions to Protect Young People, Future Generations and Nature. PLoS ONE 8(12): e81648. https://doi.org/10.1371/journal.pone.0081648[↩]
- Box 5.1, page 396, Masson-Delmotte, V., M. Schulz, A. Abe-Ouchi, J. Beer, A. Ganopolski, J.F. González Rouco, E. Jansen, K. Lambeck, J. Luterbacher, T. Naish, T. Osborn, B. Otto-Bliesner, T. Quinn, R. Ramesh, M. Rojas, X. Shao and A. Timmermann, 2013: Information from Paleoclimate Archives. In: Climate Change 2013: The Physical Science Basis. Contribution of Working Group I to the Fifth Assessment Report of the Intergovernmental Panel on Climate Change [Stocker, T.F., D. Qin, G.-K. Plattner, M. Tignor, S.K. Allen, J. Boschung, A. Nauels, Y. Xia, V. Bex and P.M. Midgley (eds.)]. Cambridge University Press, Cambridge, United Kingdom and New York, NY, USA. https://www.ipcc.ch/report/ar5/wg1/[↩]
- https://nsidc.org/about/monthlyhighlights/2009/09/arctic-amplification[↩]
- http://columbia.edu/~jeh1/mailings/2019/20190206_Temperature2018.pdf[↩]
- https://www.arctic.noaa.gov/report-card[↩]
- https://www.nytimes.com/2018/12/11/climate/arctic-warming.html[↩]
- The difference between extent and area is explained at https://nsidc.org/arcticseaicenews/faq/#area_extent This states “A simplified way to think of extent versus area is to imagine a slice of Swiss cheese. Extent would be a measure of the edges of the slice of cheese and all of the space inside it. Area would be the measure of where there is cheese only, not including the holes. That is why if you compare extent and area in the same time period, extent is always bigger. Scientists at NSIDC report extent because they are cautious about summertime values of ice concentration and area taken from satellite sensors. To the sensor, surface melt appears to be open water rather than water on top of sea ice.”[↩]
- https://nsidc.org/arcticseaicenews/charctic-interactive-sea-ice-graph/[↩]
- https://nsidc.org/data/G02135/versions/3. Fetterer, F., K. Knowles, W. N. Meier, M. Savoie, and A. K. Windnagel. 2017, updated daily. Sea Ice Index, Version 3. [North]. Boulder, Colorado USA. NSIDC: National Snow and Ice Data Center. doi: https://doi.org/10.7265/N5K072F8. [20/1/2020].[↩]
- https://www.nesdis.noaa.gov/content/shrinking-arctic-sea-ice-comes-heightened-national-security-concerns[↩]
- https://www.arctic.noaa.gov/Report-Card[↩]
- https://www.washingtonpost.com/energy-environment/2018/12/11/arctic-is-even-worse-shape-than-you-realize/?utm_term=.efb30781ae9a[↩][↩]
- http://nsidc.org/soac/sea-ice-age-month#seaiceage[↩][↩]
- Walt Meier, a sea ice expert at the National Snow and Ice Data Center[↩]
- Veerabhadran Ramanathan is a climate expert at the Scripps Institution of Oceanography who was the discoverer of the role of chlorofluorocarbons (or CFCs) in not only destroying the ozone layer but also amplifying global warming. Refer to https://scripps.ucsd.edu/labs/ramanathan/[↩]
- See FAQ 10.1 on page 894 of Bindoff, N.L., P.A. Stott, K.M. AchutaRao, M.R. Allen, N. Gillett, D. Gutzler, K. Hansingo, G. Hegerl, Y. Hu, S. Jain, I.I. Mokhov, J. Overland, J. Perlwitz, R. Sebbari and X. Zhang, 2013: Detection and Attribution of Climate Change: from Global to Regional. In: Climate Change 2013: The Physical Science Basis. Contribution of Working Group I to the Fifth Assessment Report of the Intergovernmental Panel on Climate Change [Stocker, T.F., D. Qin, G.-K. Plattner, M. Tignor, S.K. Allen, J. Boschung, A. Nauels, Y. Xia, V. Bex and P.M. Midgley (eds.)]. Cambridge University Press, Cambridge, United Kingdom and New York, NY, USA. https://www.ipcc.ch/site/assets/uploads/2018/02/WG1AR5_Chapter10_FINAL.pdf[↩]
- http://www.fabianoventura.it/en/projects/on-the-trails-of-the-glaciers/alaska-2013/[↩]
- Vaughan, D.G., J.C. Comiso, I. Allison, J. Carrasco, G. Kaser, R. Kwok, P. Mote, T. Murray, F. Paul, J. Ren, E. Rignot, O. Solomina, K. Steffen and T. Zhang, 2013: Observations: Cryosphere. In: Climate Change 2013: The Physical Science Basis. Contribution of Working Group I to the Fifth Assessment Report of the Intergovernmental Panel on Climate Change [Stocker, T.F., D. Qin, G.-K. Plattner, M. Tignor, S.K. Allen, J. Boschung, A. Nauels, Y. Xia, V. Bex and P.M. Midgley (eds.)]. Cambridge University Press, Cambridge, United Kingdom and New York, NY, USA. https://www.ipcc.ch/site/assets/uploads/2018/02/WG1AR5_Chapter04_FINAL.pdf[↩]
- NASA Global Ice Viewer, https://climate.nasa.gov/interactives/global-ice-viewer/#/1/4[↩][↩][↩]
- https://phys.org/news/2017-03-glacier-photos-climate.html#jCp[↩]
- http://www.fabianoventura.it/en/projects/on-the-trails-of-the-glaciers/alaska-2013[↩]
- Tielidze, L. G.: Glacier change over the last century, Caucasus Mountains, Georgia, observed from old topographical maps, Landsat and ASTER satellite imagery, The Cryosphere, 10, 713-725, https://doi.org/10.5194/tc-10-713-2016, 2016.[↩]
- http://news.bbc.co.uk/2/hi/8046540.stm[↩]
- https://www.theguardian.com/environment/2016/nov/28/shrinking-glaciers-state-of-emergency-drought-bolivia[↩]