Updated December 2023.
This page explains energy system statistics used by this site. A quick glance at the diagrams here may be all that’s needed. A national energy system can be represented by figure 11 2 3.
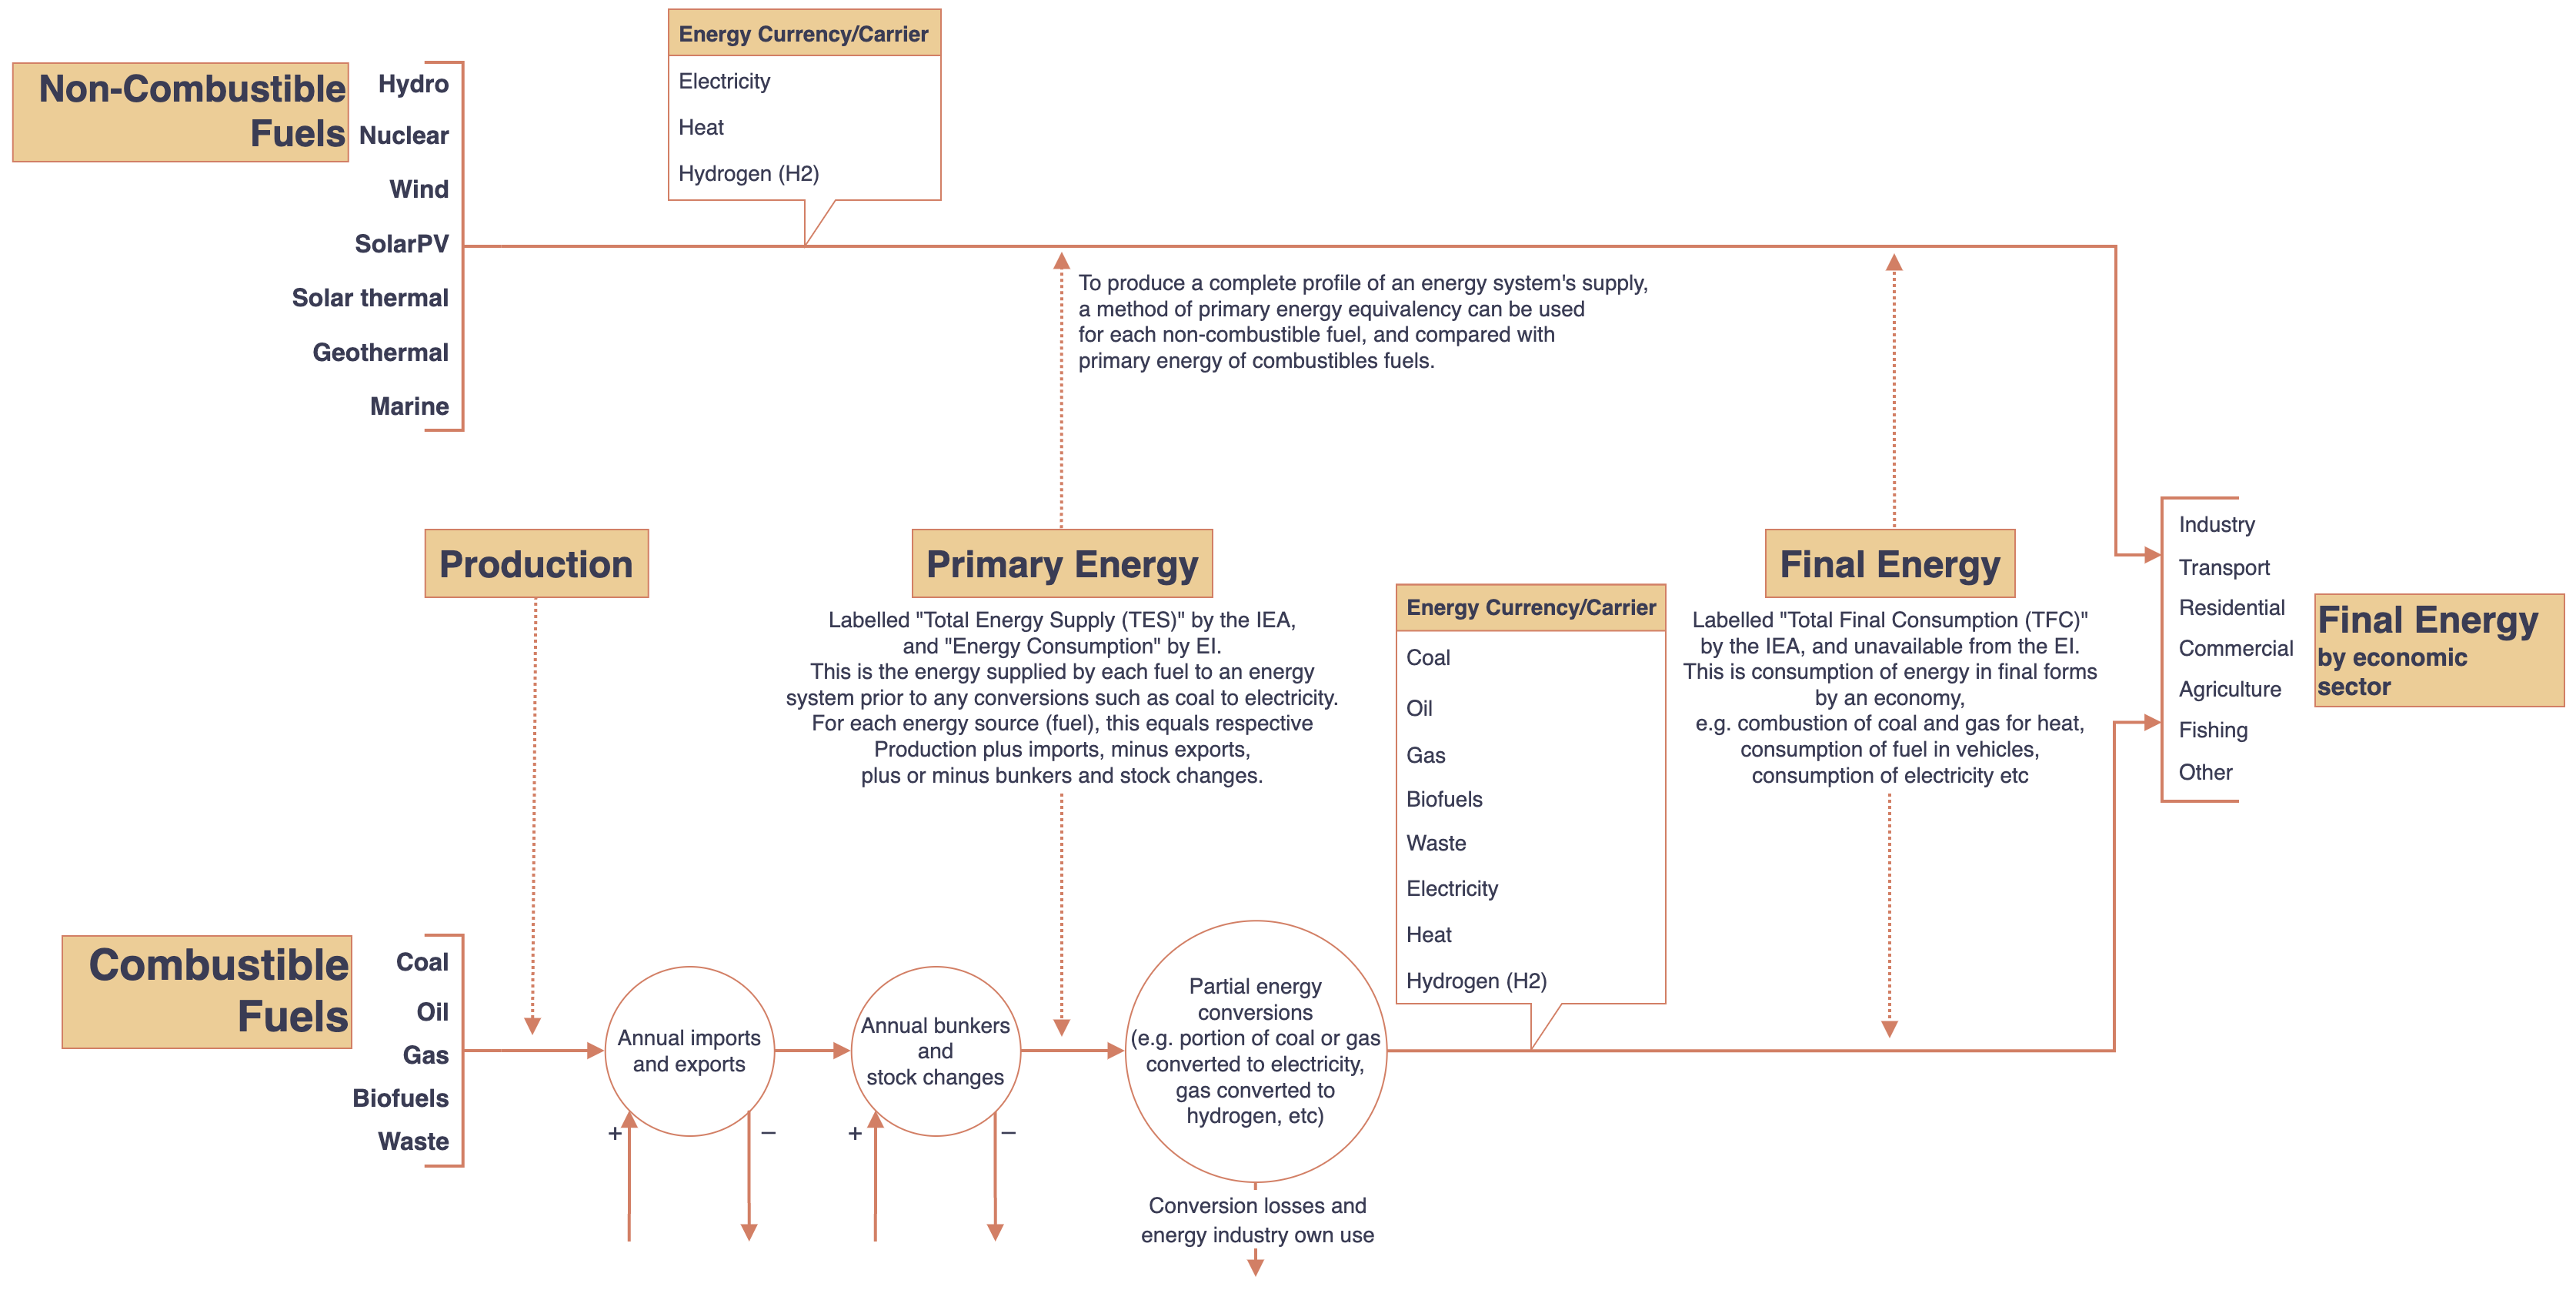
Measures of interest are primary energy (labelled Total Energy Supply (TES) by the IEA4 and Energy Consumption by the Energy Institute (EI)5), and final energy (labelled Total Final Consumption (TFC) by the IEA).
Final energy accounts for energy consumed by a country in its final form. For example, accounting for gas burned to produce heat separately from that burned to produce electricity. Final energy data is only available from the IEA, and so is at least two years old. Despite this, it’s arguably a more useful measure than primary energy, as explained below.
Primary energy provides a means to evaluate the energy supplied to an energy system from all fuel types. It accounts for energy supplied in its primary form, prior to any conversions such as coal to electricity.
The weaknesses of primary energy are –
- It’s a measure of how much fossil fuel electricity generation would be required to replace non-fossil fuelled, which is retrospective and unhelpful,
- it’s complicated and uninteresting for people to understand,
- the arithmetic involved is inconsistent, differing between institutions, and
- naming is inconsistent, with the EI confusingly labelling it “consumption”.
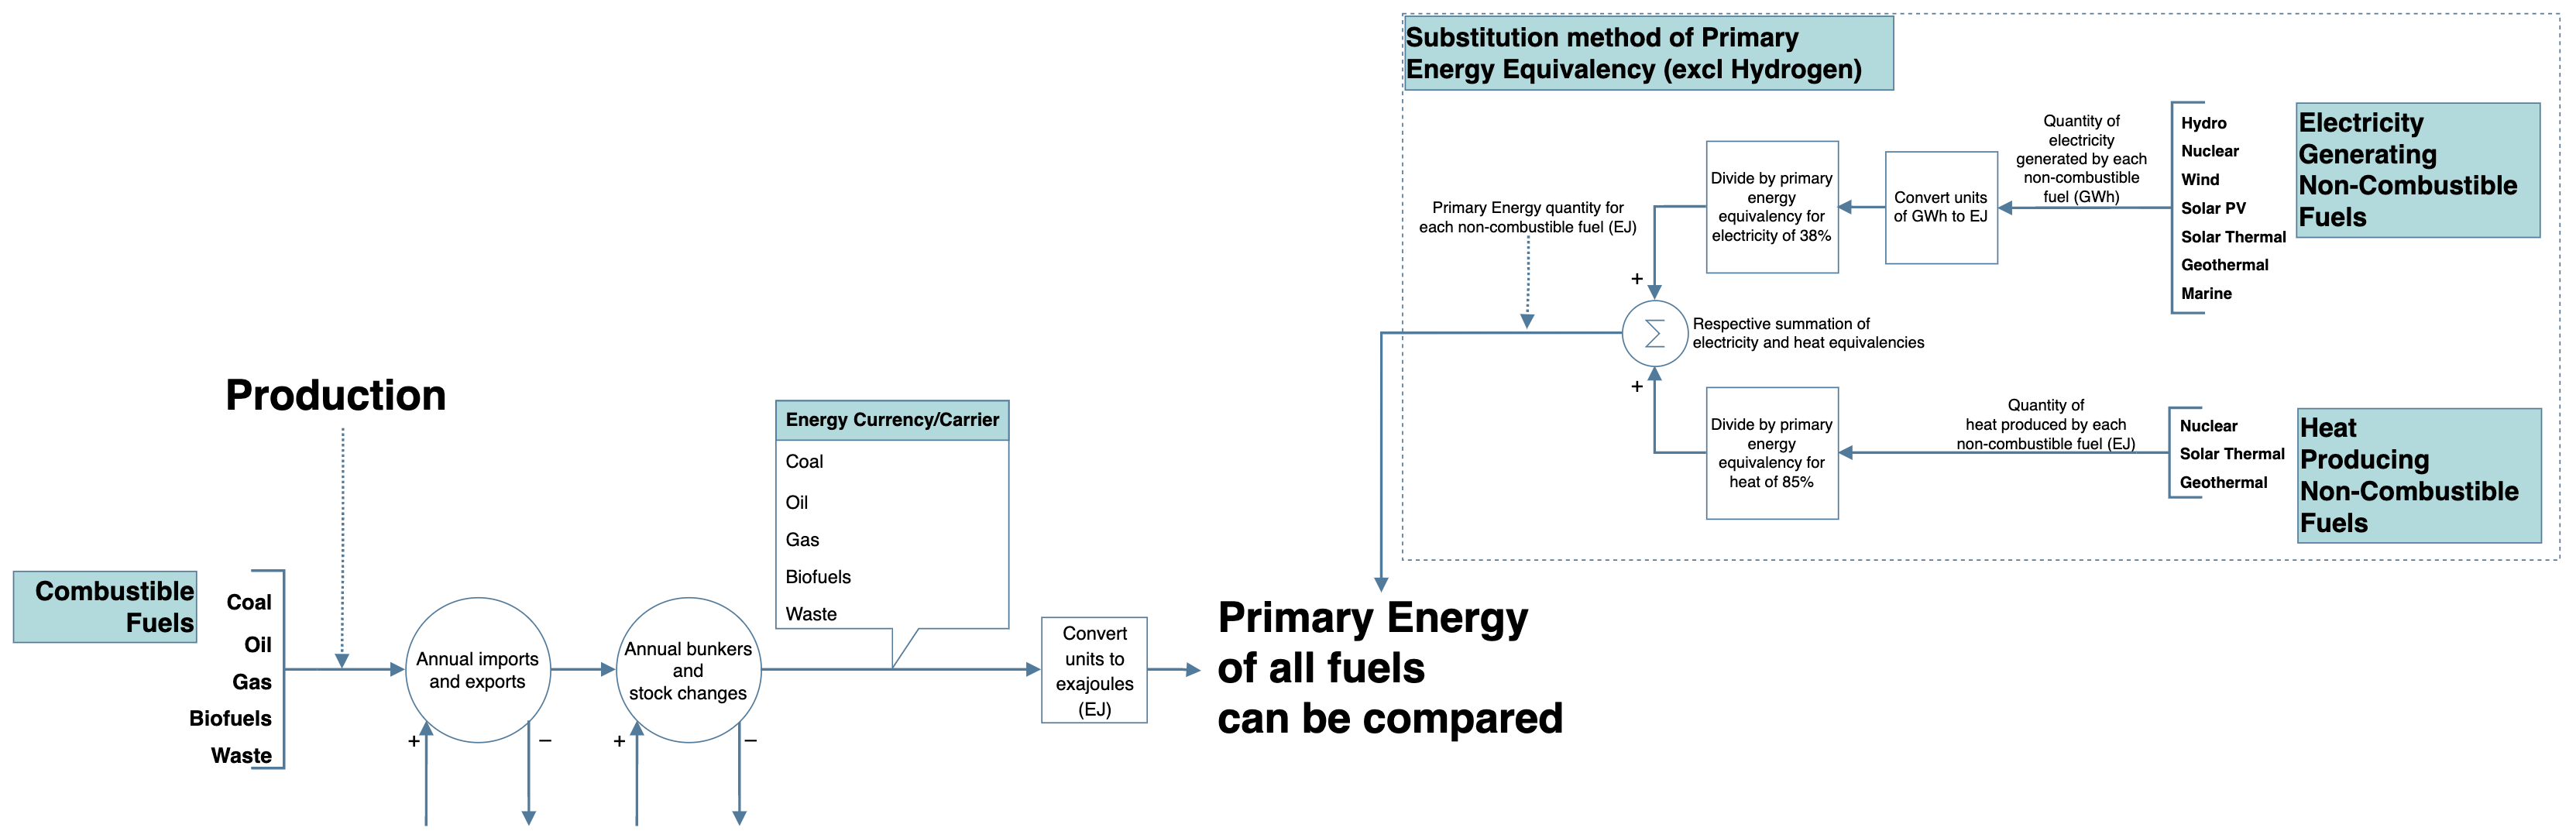
Primary energy supplied by non-combustibles (i.e. renewable and nuclear fuels) can’t be directly compared with that supplied by combustibles because non-combustibles have natural forms of primary energy (e.g. sun, wind, uranium etc). To overcome this, an equivalent quantity can be calculated for each non-combustible, using a method of ‘primary energy equivalence’. The method applied to IEA data6 on this site, and that used by BP7, is the ‘substitution method'8.
The substitution method is performed by calculating the quantity of primary energy required to be input to a thermal power station of average efficiency, in order to generate an amount of electricity or heat equivalent to that generated by each non-combustible. Primary energy values for non-combustibles are therefore the equivalent quantity of thermal generation that they have supplanted. For example, if the share of primary energy in an energy system is ‘4% solar’, then the quantity of energy from solar is equivalent to 4% of an energy system that is 100% fuelled by combustible fuels (i.e. thermal).
Values of efficiency applied to IEA data on this site are those used by the IPCC:9 38% for electricity and 85% for heat. Therefore to calculate equivalents, non-combustible quantities of electricity are multiplied by 2.63 (i.e. 1/0.38), and heat by 1.18 (i.e. 1/0.85), as shown in figure 2 below.
The EI data inherently uses the substitution method with yearly-dependant efficiency values ranging from 36% to 40%, due to efficiency improvements. Therefore this site does not apply further processing to EI data.
A shortcoming of primary energy is the measure is excessive relative to that needed in a fully decarbonised energy system solely fuelled by non-combustibles; the total energy currently supplied by combustion of fossil fuels wouldn’t be required to be generated by non-combustibles, because the inefficiency of thermal generation wouldn’t exist.
The pursuit of a solely non-combustible fuelled national energy system is not policy of any country, and a future global ‘net-zero’ energy system, as unlikely as that now seems, may continue to include substantial quantities of thermal generation, and emissions reduced using carbon capture and storage (CCS), and offset by atmospheric carbon dioxide removal (CDR).
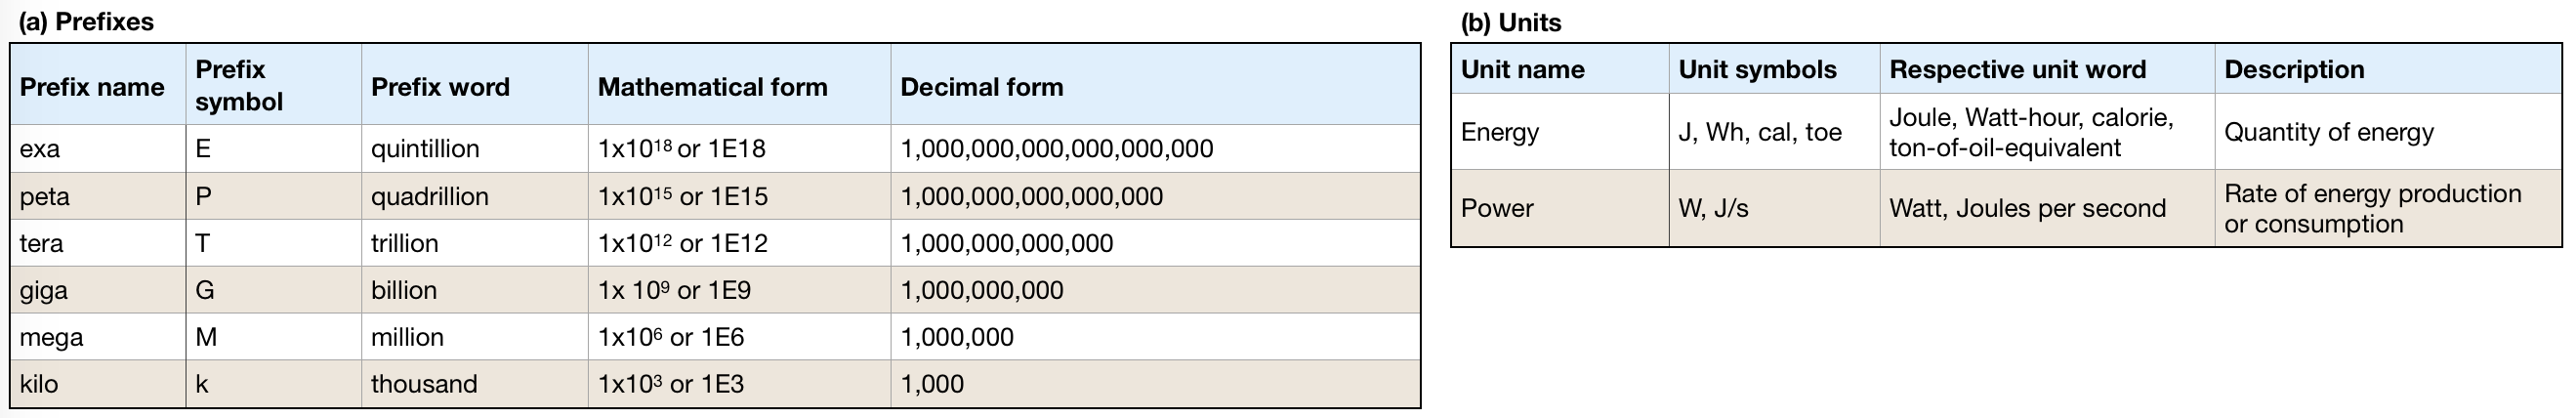
Explanations for number prefixes and units used on this site are listed below.
- J.M.K.C. Donev et al. (2017). Energy Education – Total primary energy supply [Online]. Available: https://energyeducation.ca/encyclopedia/Total_primary_energy_supply [Accessed: February 20, 2019].[↩]
- The International Energy Agency (IEA) statistics overview, http://www.iea.org/media/training/presentations/statisticsmarch/balances_overview.pdf[↩]
- Macknick, Jordan. “Energy and CO2 emission data uncertainties.” Carbon Management 2, no. 2 (2011): 189-205. http://www.iiasa.ac.at/web/home/research/researchPrograms/TransitionstoNewTechnologies/macknick_ene_co2_uncertainties_CM_2011.pdf[↩]
- https://www.iea.org/data-and-statistics/data-tools/energy-statistics-data-browser?country=WORLD&fuel=Energy%20supply&indicator=TESbySource[↩]
- https://www.energyinst.org/statistical-review/about[↩]
- https://www.iea.org/statistics/[↩]
- https://www.bp.com/en/global/corporate/energy-economics/statistical-review-of-world-energy/downloads.html[↩]
- There are two other methods of primary energy equivalency: the ‘direct method’ and the ‘physical energy content method’. The direct method directly compares quantities of energy from combustible and non-combustible sources without any account for the efficiency of thermal generation. This is only useful for future energy scenarios where the supplies of non-combustible fuels are high. The physical energy content method is used by the IEA for their TES values, which enlarges the contribution of nuclear energy and diminishes that from other non-combustibles. This method applies the following weights to non-combustible energy supplies: Nuclear = 33%, Geothermal heat = 50%, Geothermal electricity = 10%, Solar thermal heat = 100%, Solar thermal electricity = 33%, Hydro, wind, marine and solarPV = 100%. For further information see section A.II.4, Krey V., O. Masera, G. Blanford, T. Bruckner, R. Cooke, K. Fisher-Vanden, H. Haberl, E. Hertwich, E. Kriegler, D. Mueller, S. Paltsev, L. Price, S. Schlömer, D. Ürge-Vorsatz, D. van Vuuren, and T. Zwickel, 2014: Annex II: Metrics & Methodology. In: Climate Change 2014: Mitigation of Climate Change. Contribution of Working Group III to the Fifth Assessment Report of the Intergovernmental Panel on Climate Change [Edenhofer, O., R. Pichs-Madruga, Y. Sokona, E. Farahani, S. Kadner, K. Seyboth, A. Adler, I. Baum, S. Brunner, P. Eickemeier, B. Kriemann, J. Savolainen, S. Schlömer, C. von Stechow, T. Zwickel and J.C. Minx (eds.)]. Cambridge University Press, Cambridge, United Kingdom and New York, NY, USA. https://www.ipcc.ch/site/assets/uploads/2018/02/ipcc_wg3_ar5_annex-ii.pdf[↩]
- Footnote of table A.II.10, p. 1294, Krey V., O. Masera, G. Blanford, T. Bruckner, R. Cooke, K. Fisher-Vanden, H. Haberl, E. Hertwich, E. Kriegler, D. Mueller, S. Paltsev, L. Price, S. Schlömer, D. Ürge-Vorsatz, D. van Vuuren, and T. Zwickel, 2014: Annex II: Metrics & Methodology. In: Climate Change 2014: Mitigation of Climate Change. Contribution of Working Group III to the Fifth Assessment Report of the Intergovernmental Panel on Climate Change [Edenhofer, O., R. Pichs-Madruga, Y. Sokona, E. Farahani, S. Kadner, K. Seyboth, A. Adler, I. Baum, S. Brunner, P. Eickemeier, B. Kriemann, J. Savolainen, S. Schlömer, C. von Stechow, T. Zwickel and J.C. Minx (eds.)]. Cambridge University Press, Cambridge, United Kingdom and New York, NY, USA. https://www.ipcc.ch/site/assets/uploads/2018/02/ipcc_wg3_ar5_annex-ii.pdf[↩]