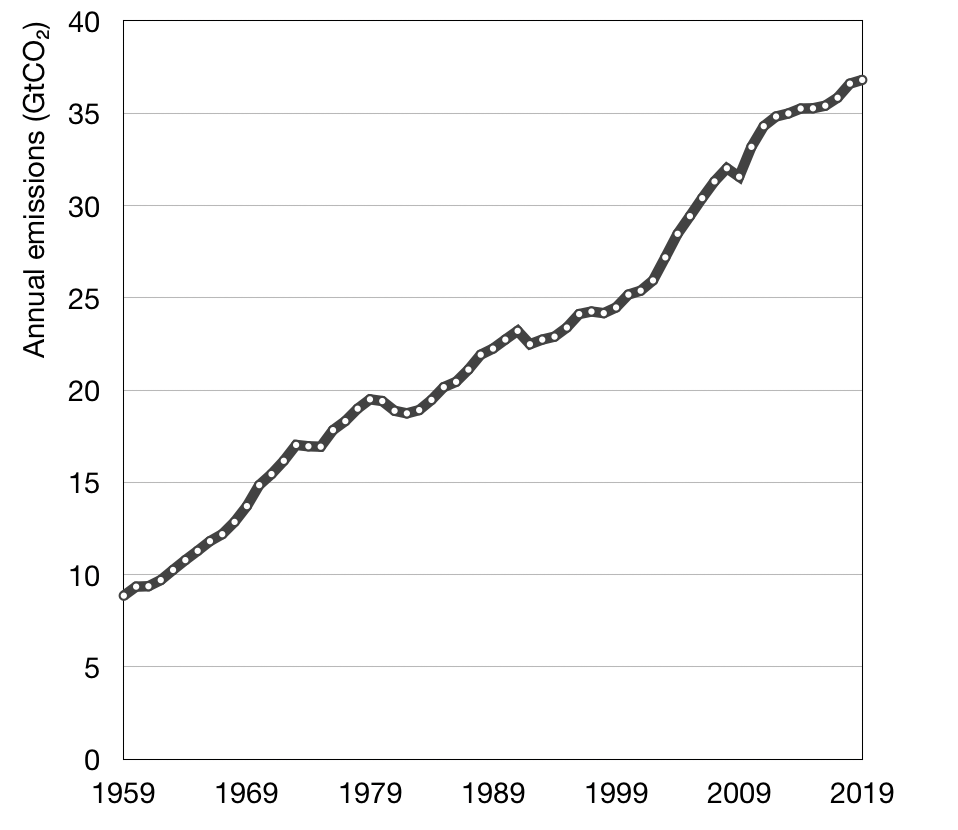
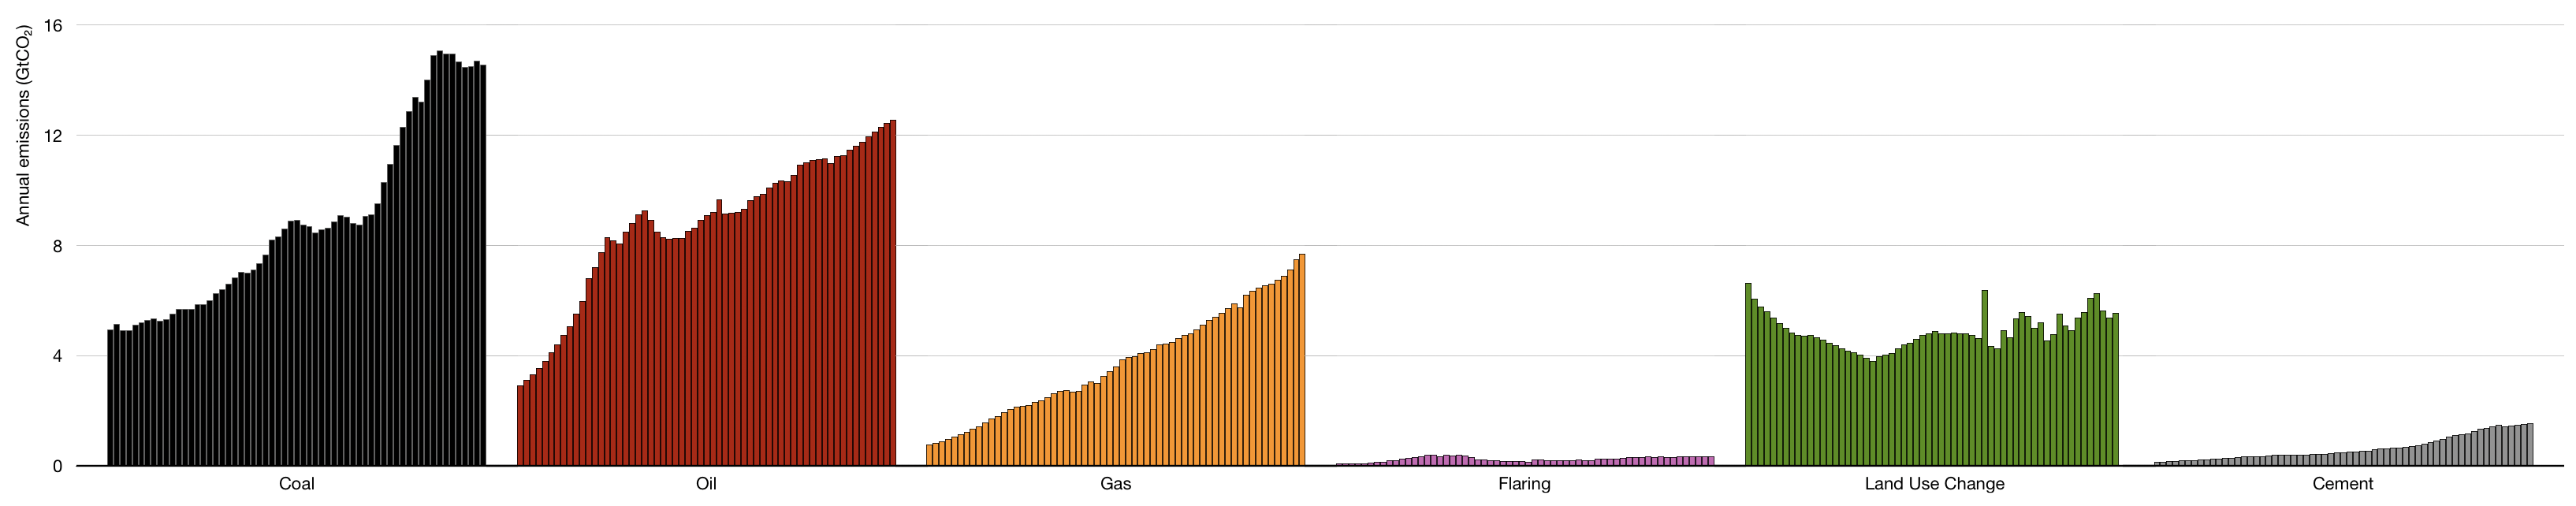
Chart 1 shows we are still carbonising, and chart 2 shows the seperate emissions sources.
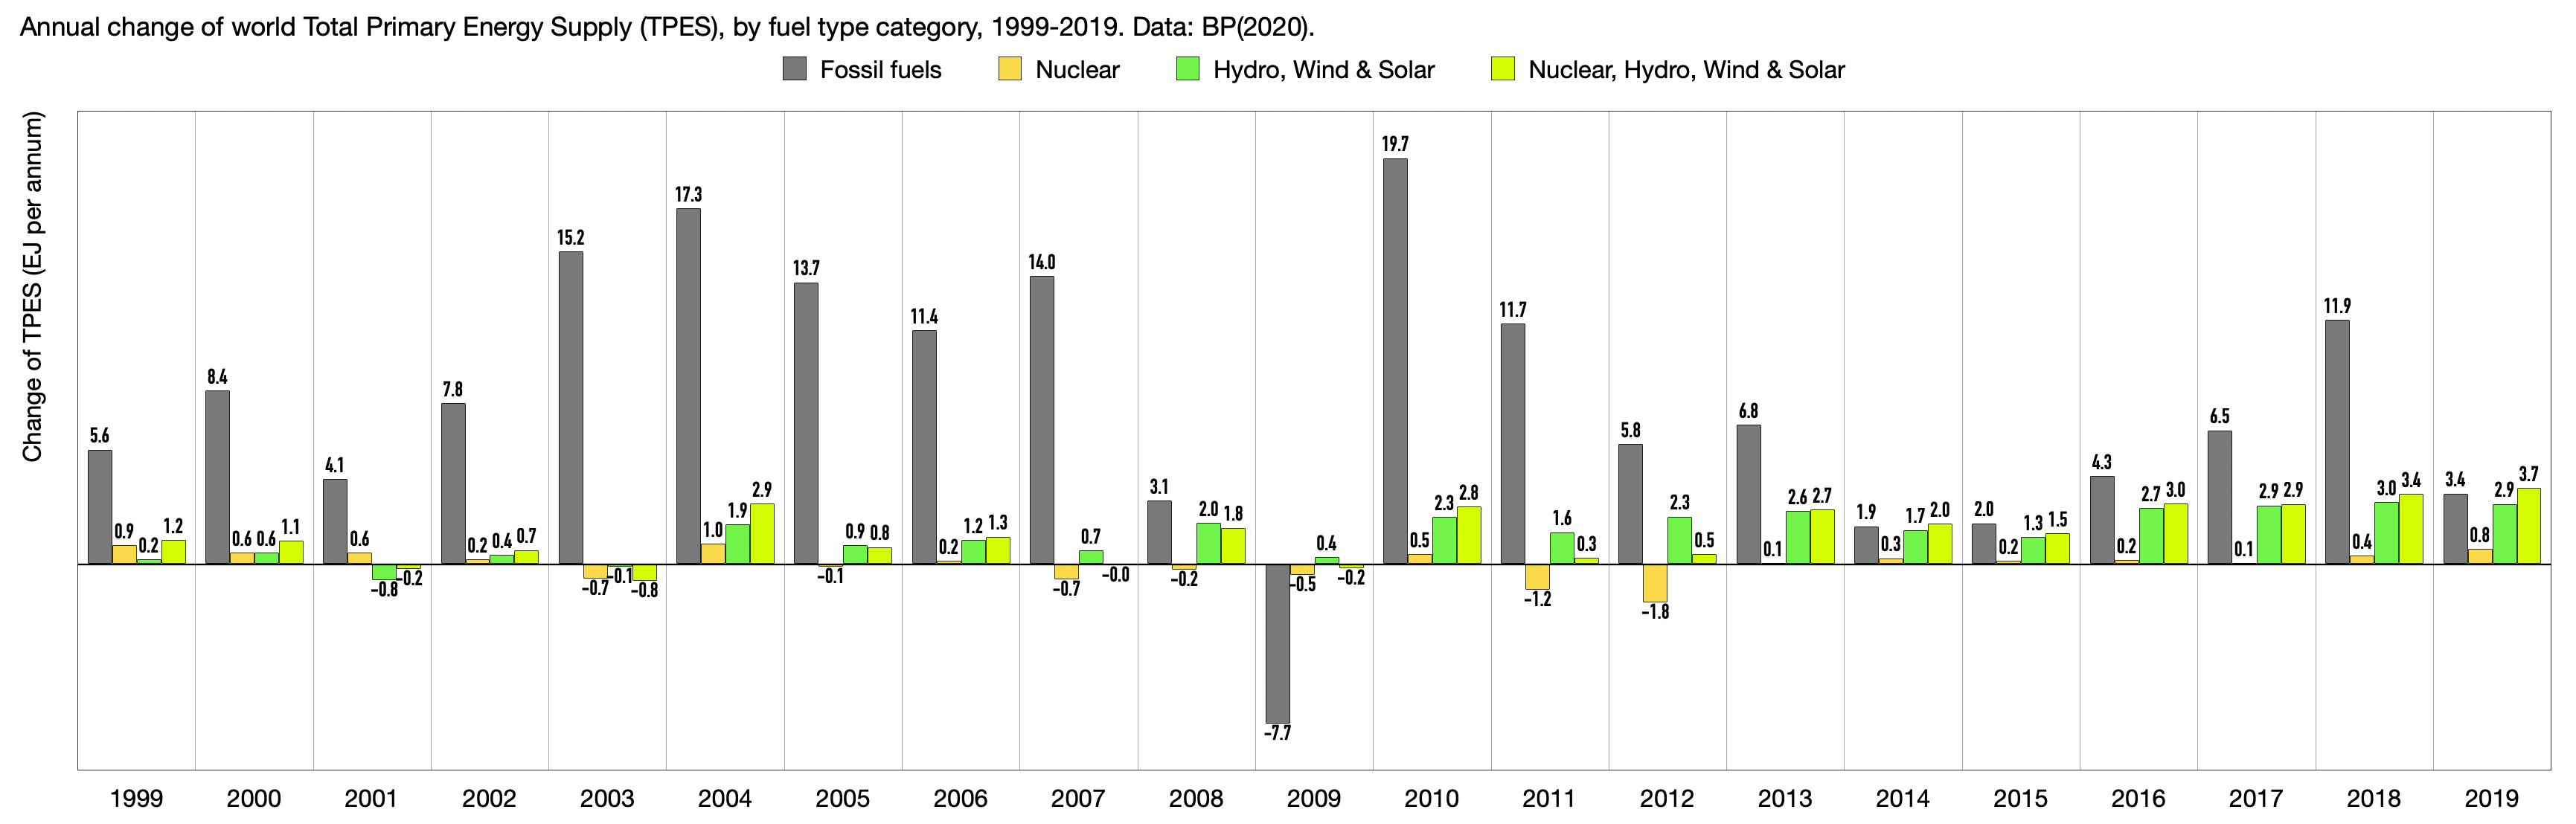
Annual changes to the world energy supply are shown below. For the first time since 2014, in 2019 additional energy from carbon-free fuels was greater than that from fossil fuels, but only by 9% (i.e. 3.7/3.4 = 1.09). In 2019 the world continued to add significant supplies of fossil fuel energy.
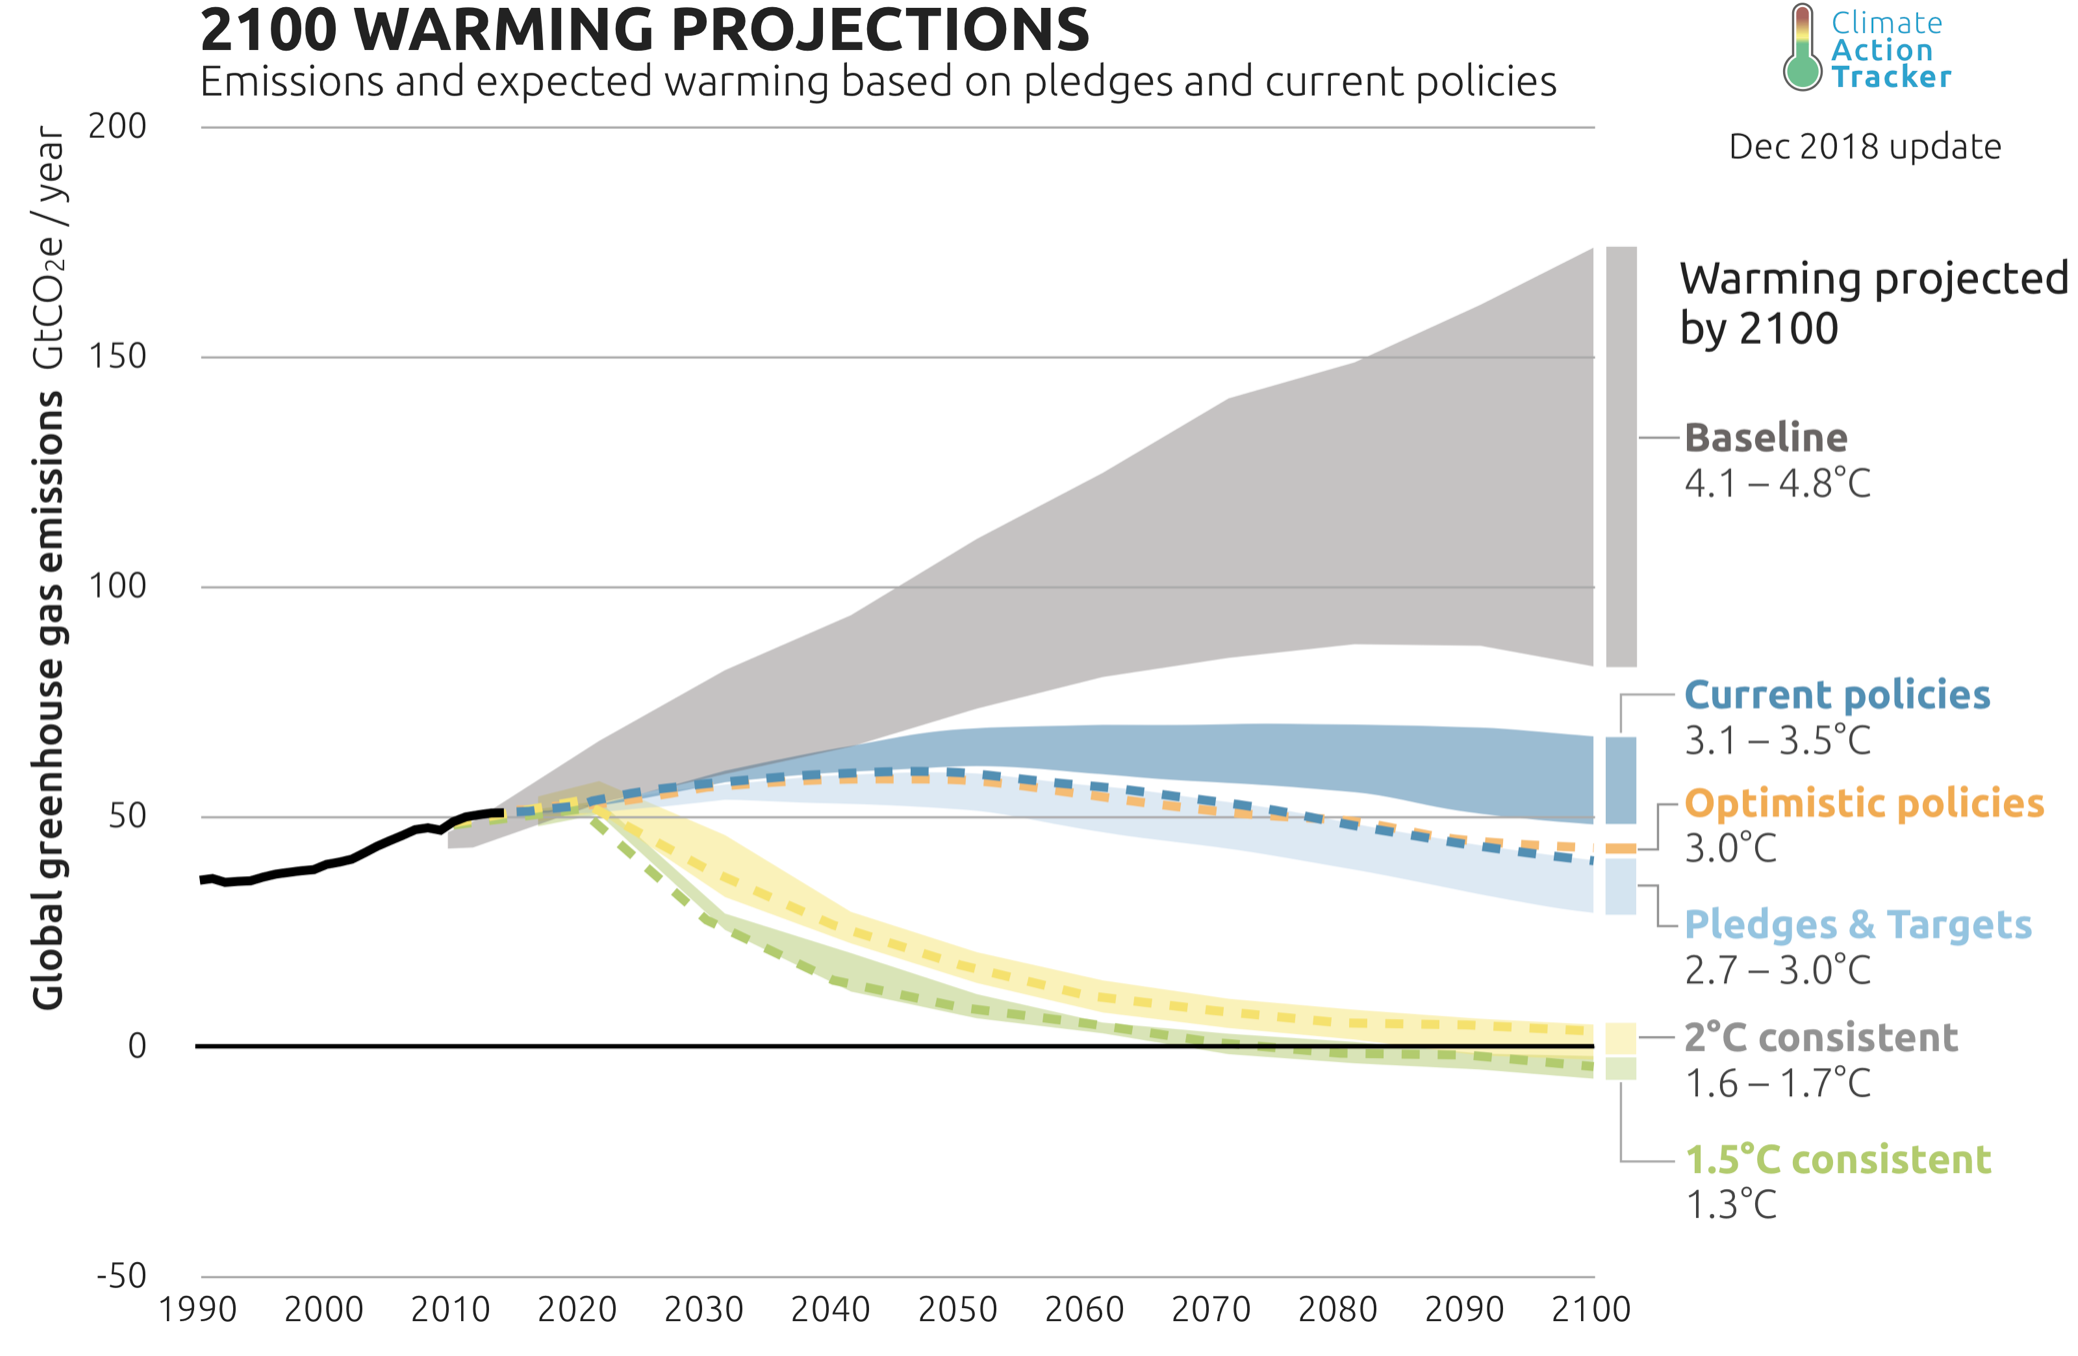
In the absence of policies global warming is expected, to reach 4.1°C – 4.8°C above pre-industrial by the end of the century. The emissions that drive this warming are often called Baseline scenarios (‘Baselines’ in the above figure) and are taken from the IPCC AR5 Working Group III. Current policies presently in place around the world are projected to reduce baseline emissions and result in about 3.3°C warming above pre-industrial levels. The unconditional pledges and targets that governments have made, including NDCs as of December 2018, would limit warming to about 3.0°C above pre-industrial levels, or in probabilistic terms, likely (66% or greater chance) limit warming below 3.2°C. This result is similar to our estimate last year, reflecting the fact that little has changed in terms of government commitments and targets in the past 12 months.
2100 warming projections, Climate Action Tracker, accessed Feb 2019. 5 Note that NDCs are “Nationally Determined Contributions” and detail the supposed intention of each country to reduce its emissions.6
Clearly, for any chance of avoiding evermore severe and frequent climate impacts, and the collapse of civilisation, not only must rapid decarbonisation begin immediately on a global scale, but also massive government investment in research and development of CDR. Current capitalist economic priorities and fossil fuel extraction must cease.
Humanity’s CO2 emissions: (i) are currently trapping two thirds of the energy causing global warming, (ii) are the only rapidly increasing contributor, (iii) almost solely determine our long term warming commitment, and (iv) continue to grow with no peak in sight. Half of all CO2 ever emitted has been emitted recently and almost all by the world’s energy system.
https://www.worldenergydata.org/ghgs/
- Global Carbon Project. (2019). Supplemental data of Global Carbon Budget 2019 (Version 1.0) [Data set]. Global Carbon Project, https://www.icos-cp.eu/GCP/2019, download labelled ‘2019 Global Budget v1.0’.[↩][↩]
- https://www.globalcarbonproject.org/carbonbudget/19/files/GCP_CarbonBudget_2019.pdf[↩][↩]
- https://www.bp.com/en/global/corporate/energy-economics/statistical-review-of-world-energy.html[↩]
- https://www.worldenergydata.org/biofuels/[↩]
- https://climateactiontracker.org/global/temperatures/[↩][↩]
- https://unfccc.int/process/the-paris-agreement/nationally-determined-contributions/ndc-registry[↩]