Updated August 2023 – improved x-axis of chart 1.
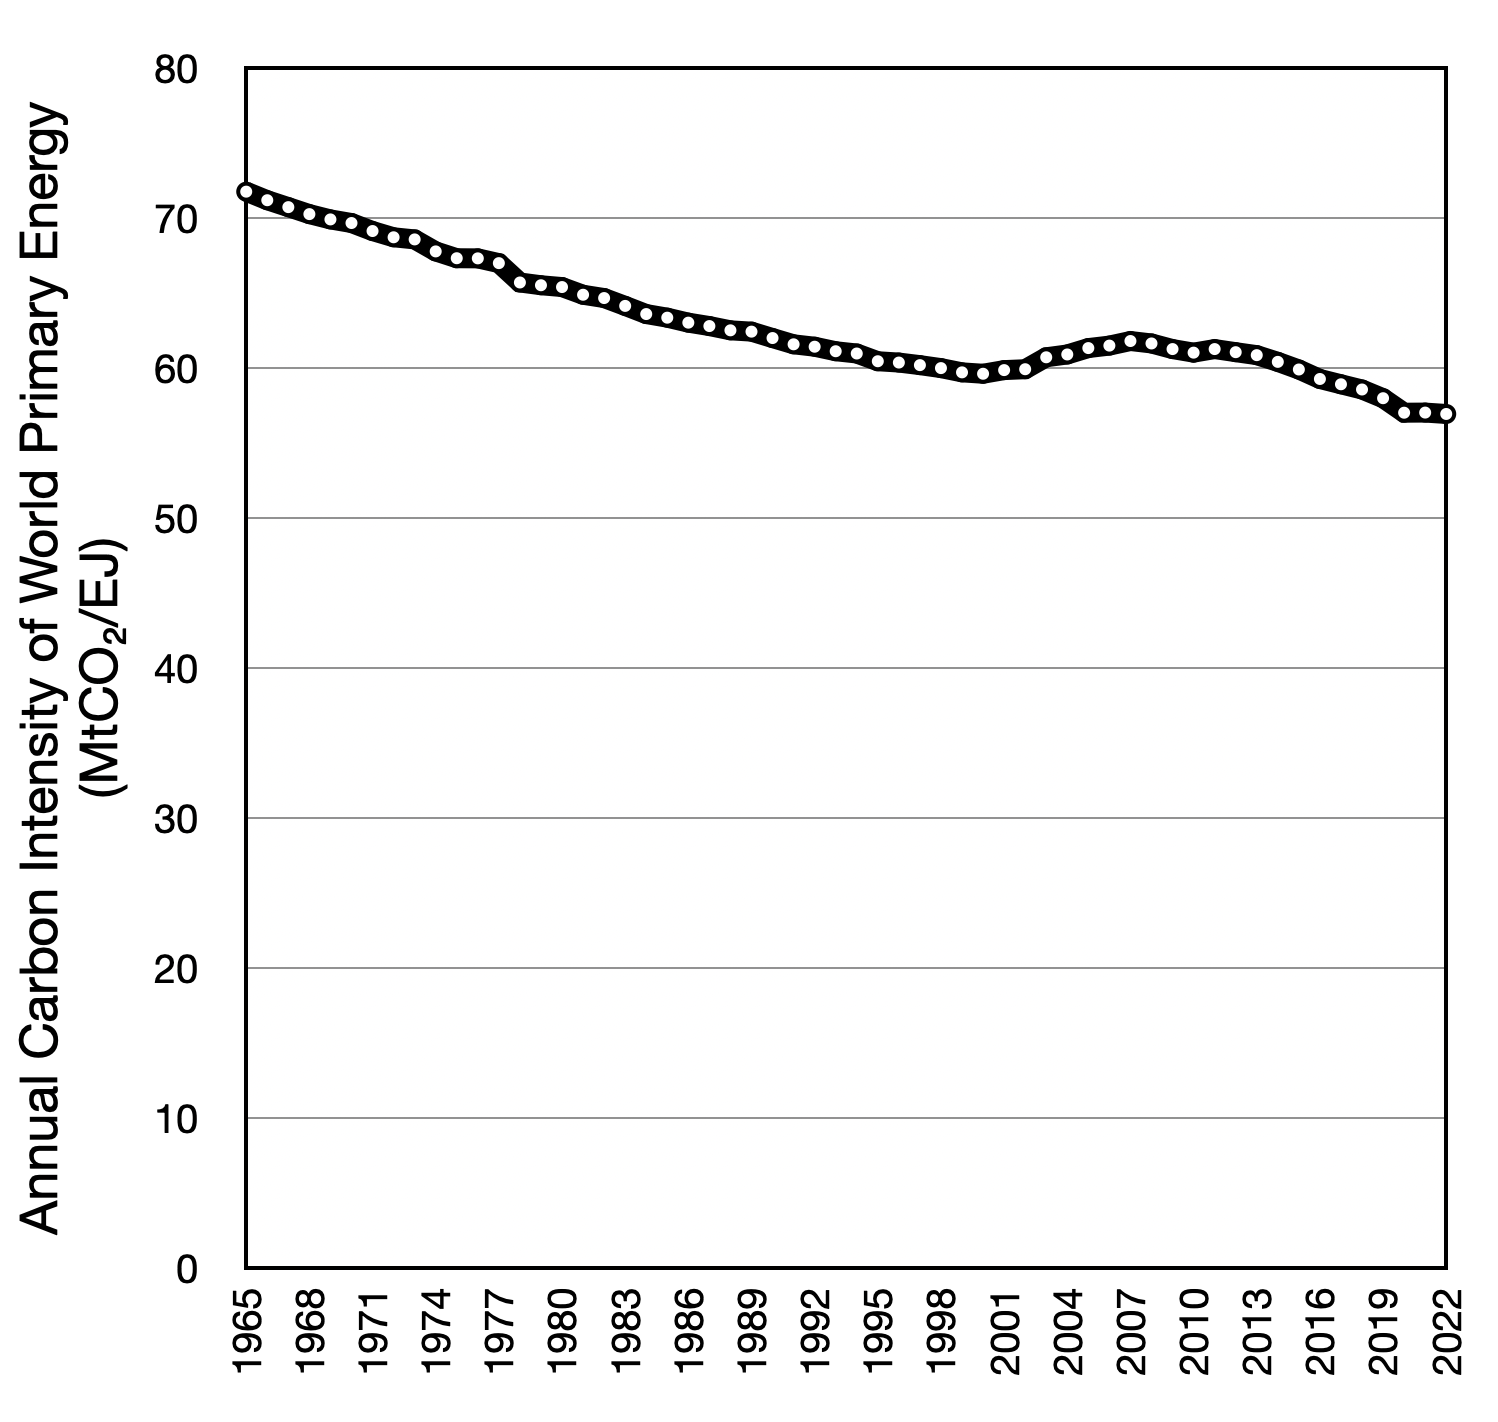
Carbon intensity is a measure to assess decarbonisation. This is the annual mass of CO₂ emitted per unit of energy supplied from the combination of fuels, both fossil and low-carbon. Relying alternatively on the change of CO₂ emissions only can’t account for changes to the quantity of energy supplied.
World Trend
Chart 1 shows the world energy system decarbonised from 1965 to 2000, but then re-carbonised from 2001 to 2011. Decarbonisation then repeated until 2020, but carbon intensity didn’t reduce to the level of 2001 until 2016.
Over the 16 year period, from 2001 to 2016, humanity made no progress to decarbonise the world energy system. Furthermore, decarbonisation since 2020 has stalled.
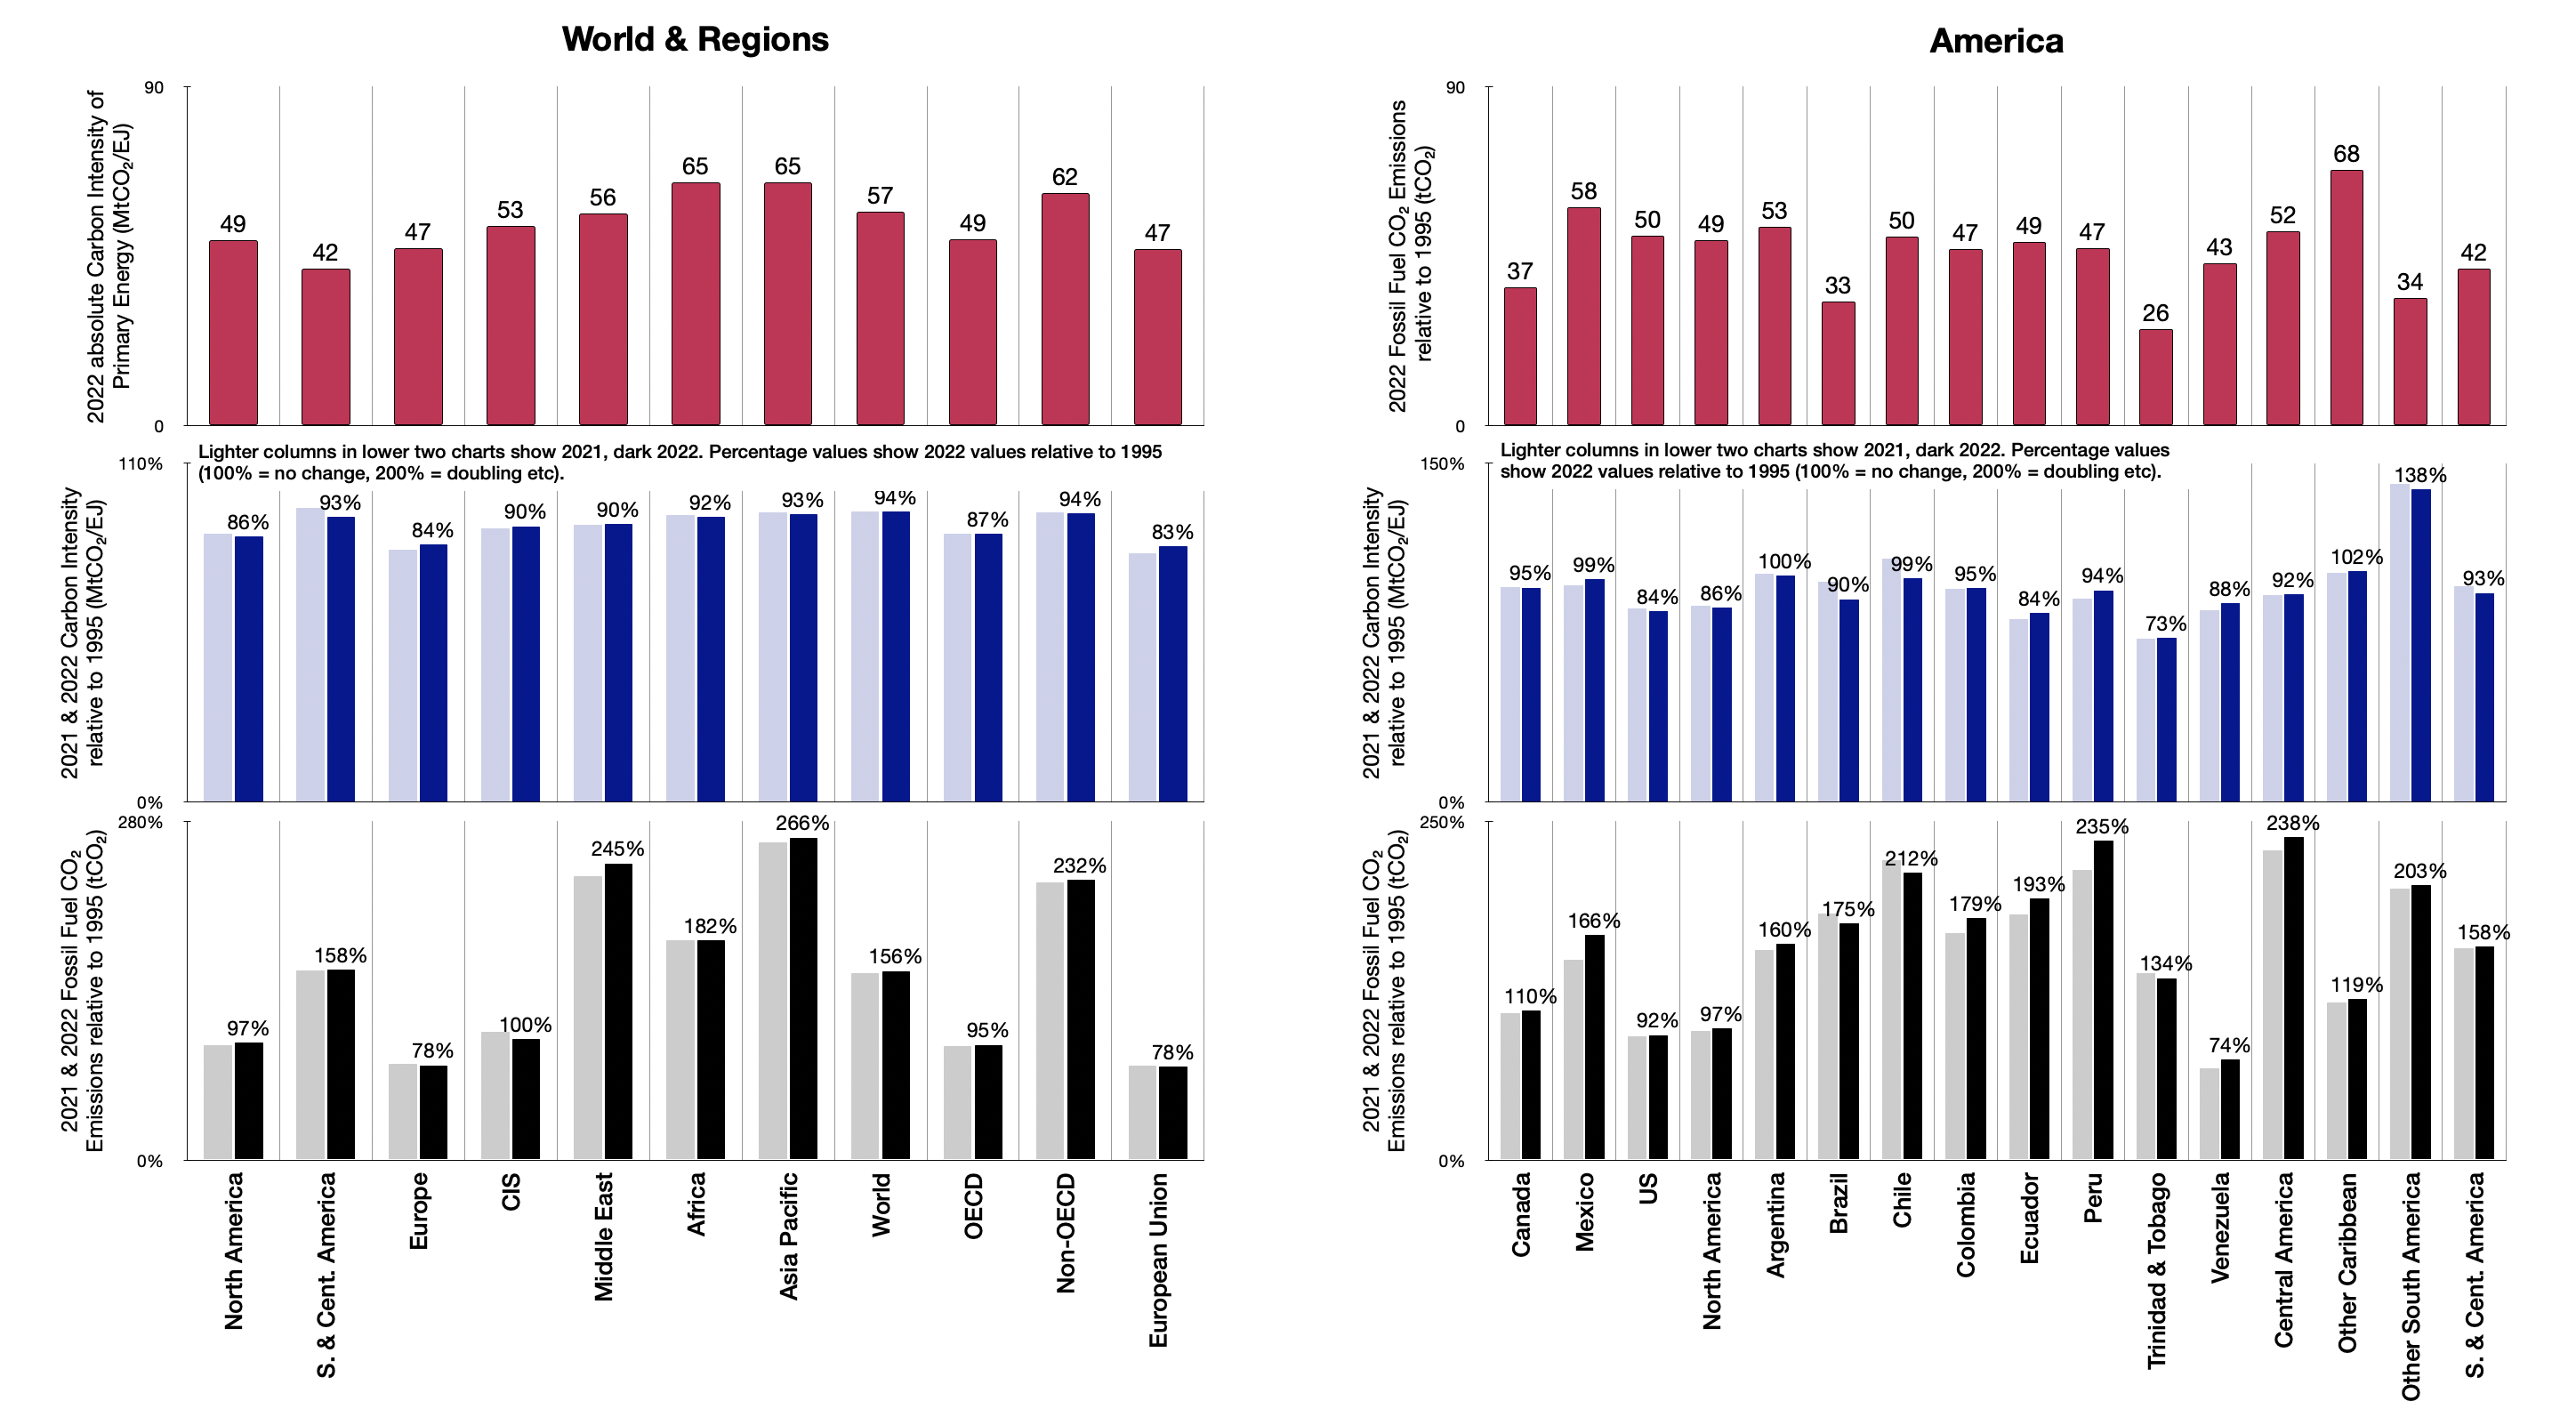
National Trends
Carbon intensity of regions and national economies is shown in the charts below.
- Upper rows show 2022 levels of carbon intensity (red),
- Middle rows show change of carbon intensity relative to 1995, the year of the first UN Climate Conference2, in 2021 (light blue) and 2022 (dark blue), and
- Bottom rows show change of fossil fuel CO₂ emissions relative to 1995, in 2021 (grey) and 2022 (black).
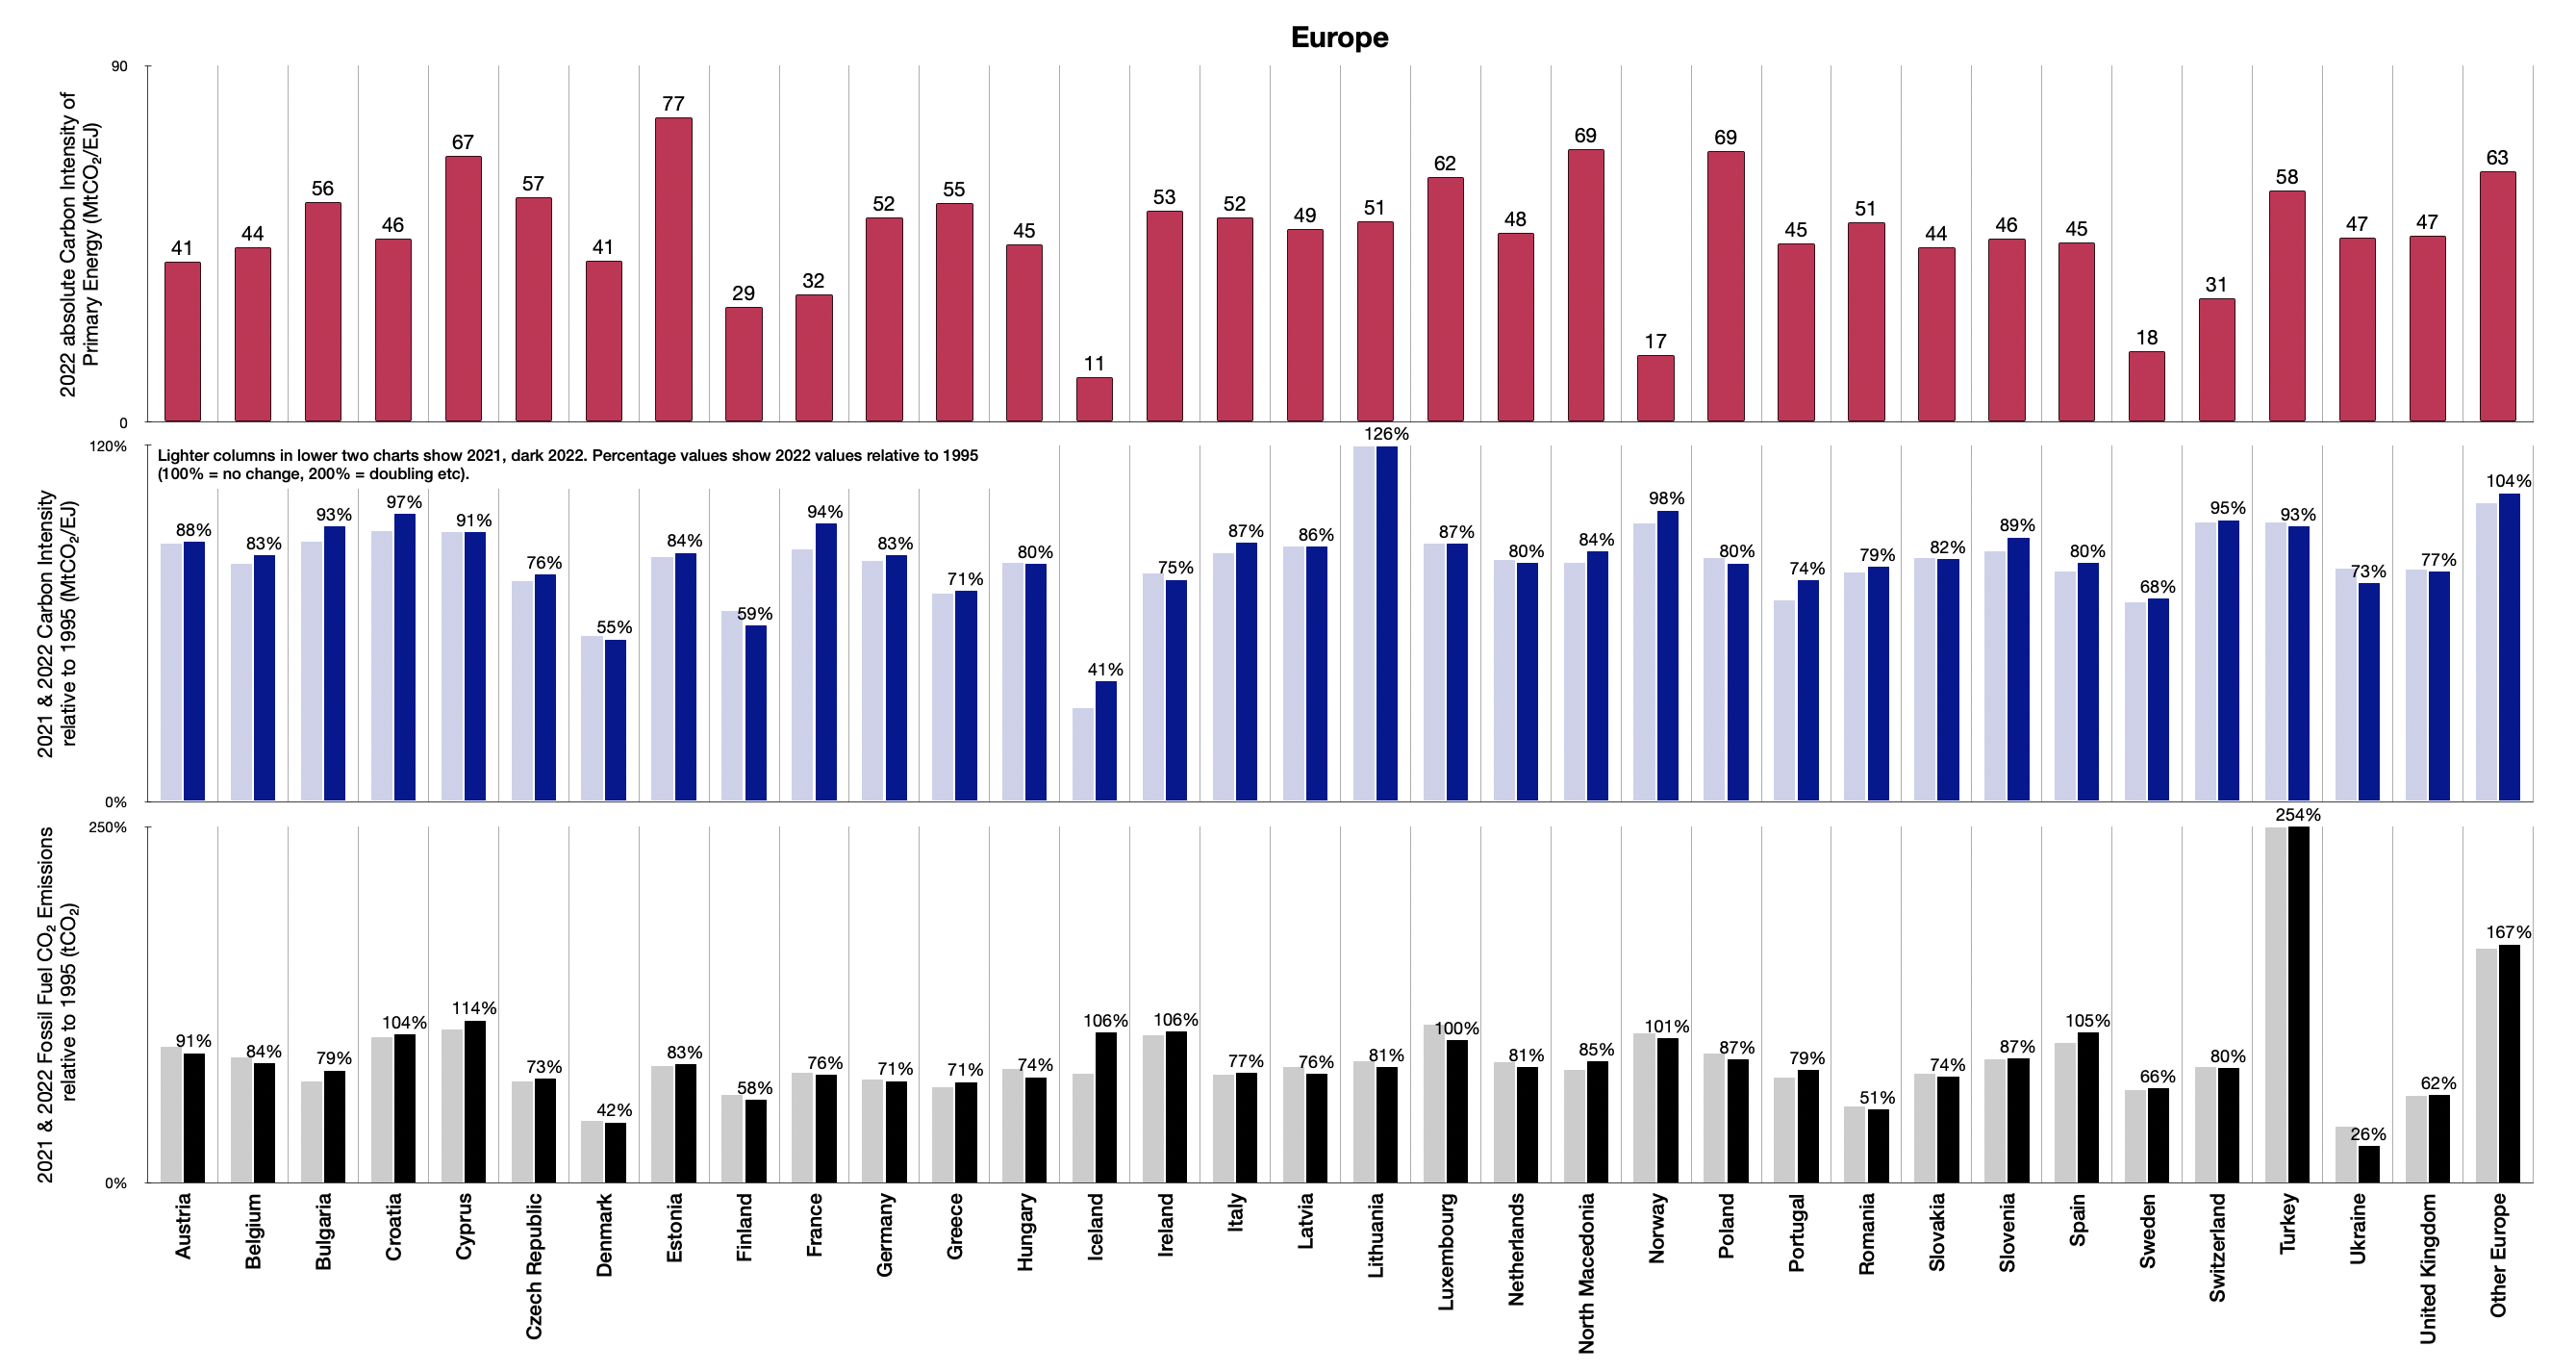
Upper rows show 2022 levels of carbon intensity (red).
Middle rows show change of carbon intensity relative to 1995, the year of the first UN Climate Conference2, in 2021 (light blue) and 2022 (dark blue). Values shown at top of 2022 columns only for clarity. A value of 100% means no change, 200% double etc.
Bottom rows show change of fossil fuel CO₂ emissions relative to 1995, in 2021 (grey) and 2022 (black). Values shown at top of 2022 columns only for clarity. A value of 100% means no change, 200% double etc.
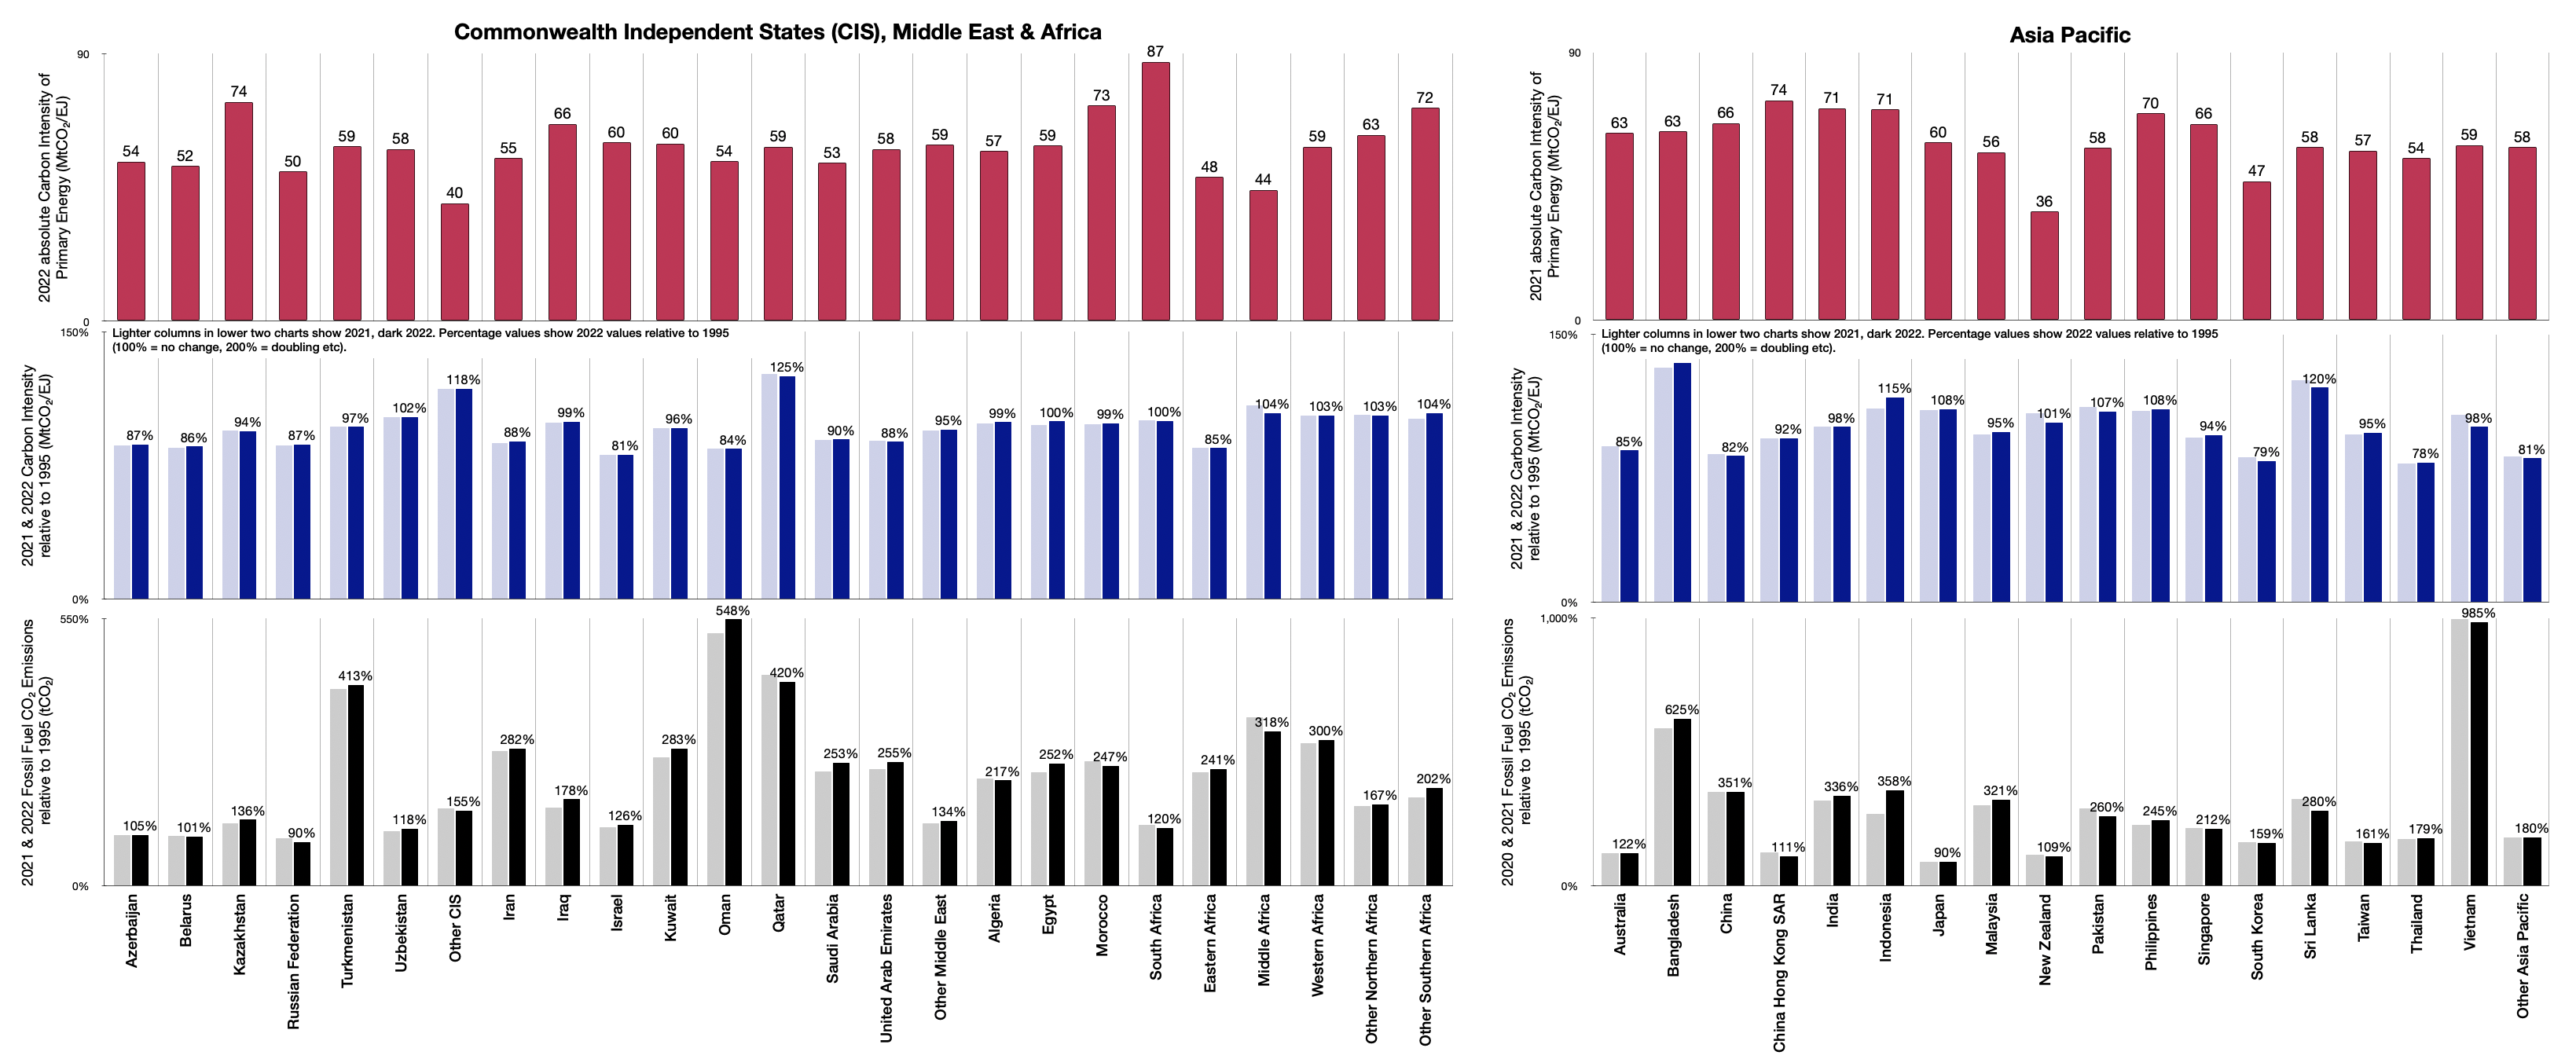