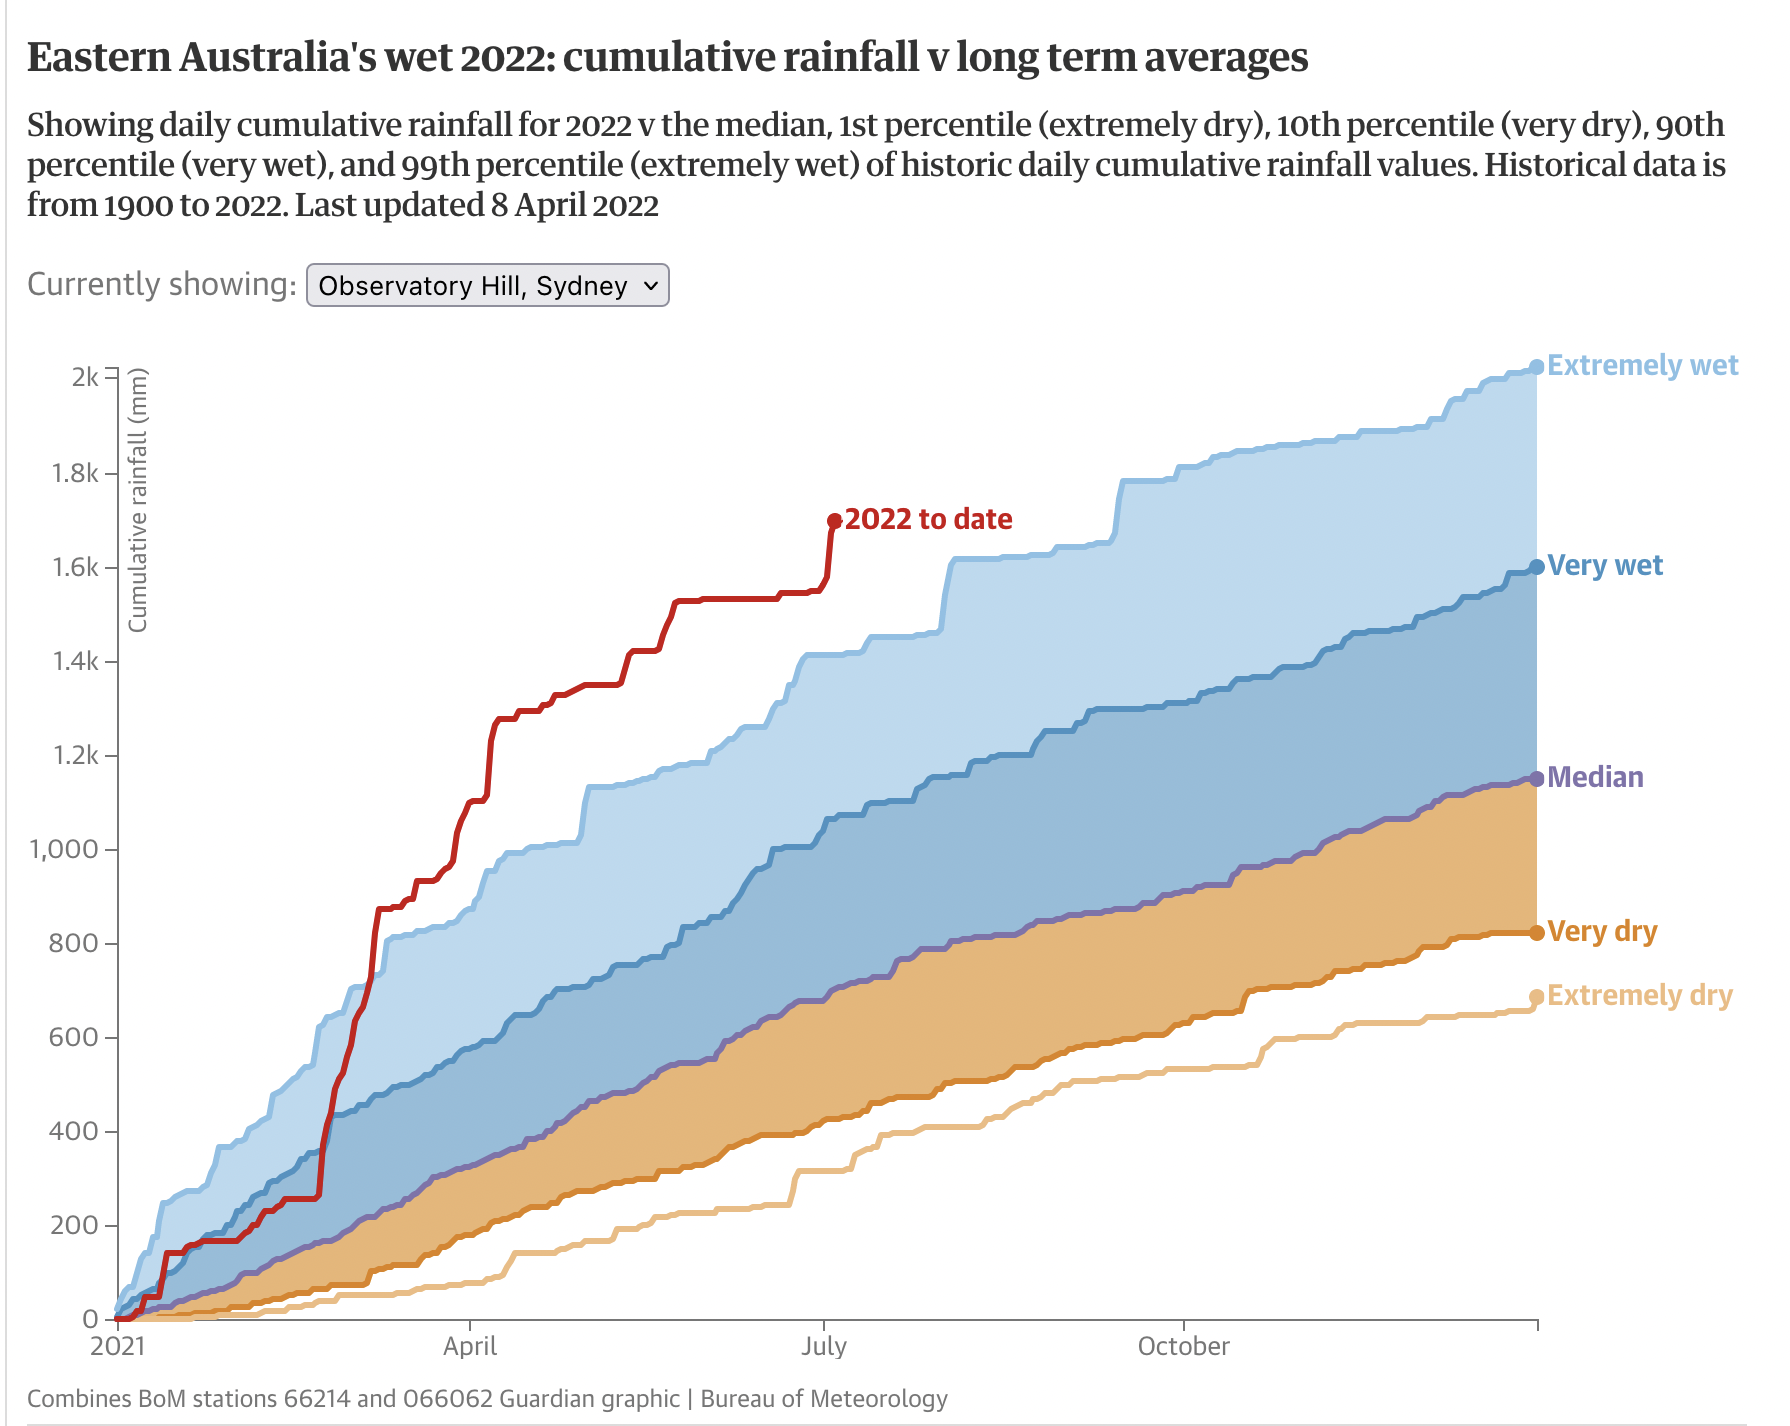
A potent weather system near Australia’s east coast has unloaded tremendous rainfall in the state of New South Wales for days, putting Sydney on track for its wettest year on record.
The torrents have spurred widespread flooding in eastern parts of New South Wales, for the fourth time in less than 18 months. The flooding has triggered more than 100 evacuation orders.
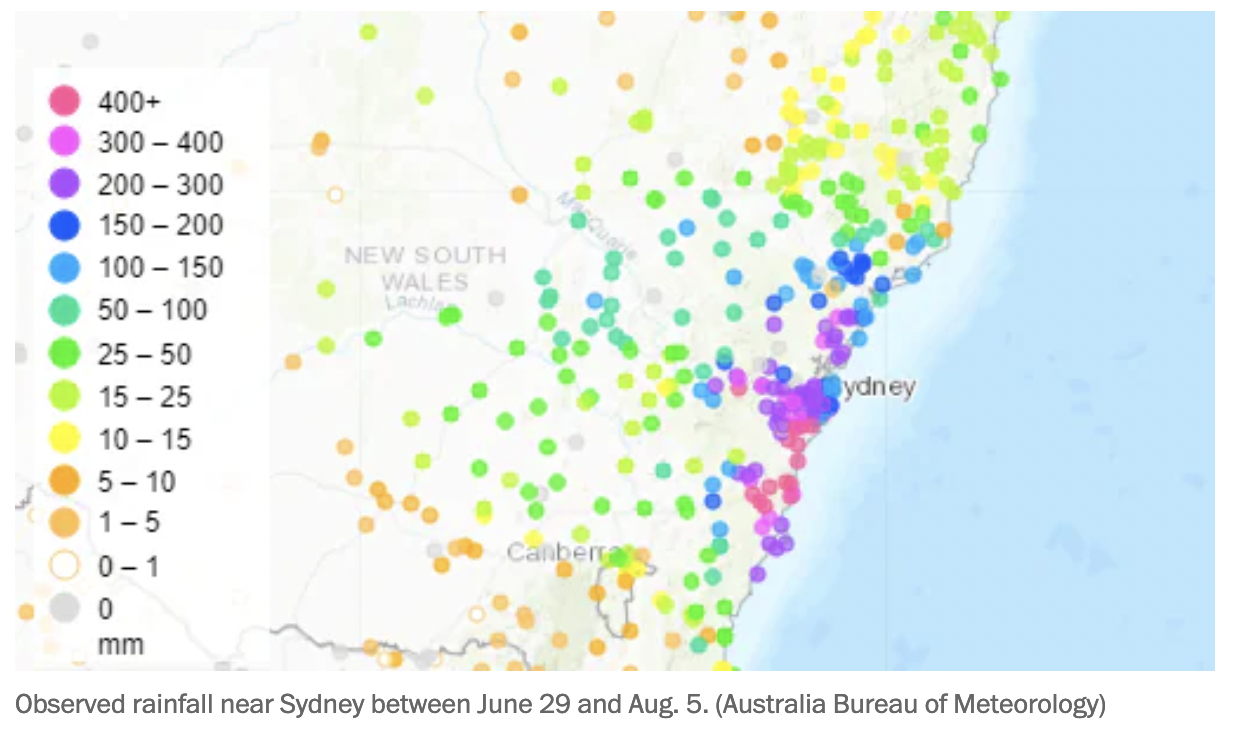
Since Friday, Sydney has observed 8.6 inches (220 mm) of rain, while surrounding areas have seen far more — some approaching 28 inches (700 mm) — which is around the amount London sees in an entire year.
Scientists attributed the excessive rainfall to a combination of factors:
- The presence of several natural climate drivers: La Niña conditions, a periodic cooling of the tropical Pacific Ocean, are linked to increased precipitation in eastern Australia. A periodic cooling of the western Indian Ocean, connected to La Niña, is associated with increased precipitation in southern Australia. A positive Southern Annular Mode causes easterly winds to bring moist air from the Tasman Sea toward eastern Australia, which falls as rain.
- Human-caused climate change, which is warming the atmosphere and oceans and intensifying precipitation events globally.
The Australia Bureau of Meteorology also noted that warm ocean waters helped intensify rainfall.
“During this recent rainfall event, very warm waters off the Australian coast (21-23°C) provided extra energy and moisture contributing to the deep trough and east coast low, leading to the relative concentration of the heavy rainfall to one 24-hour period,” it wrote.
The heaviest rain in New South Wales through Tuesday morning had fallen in Brogers Creek, about 65 miles south of Sydney, which registered 36.7 inches (933 mm).
Researchers say climate change is worsening the situation. Australia has warmed by around 2.6˚F (1.5˚C) since 1910. A warming atmosphere holds more moisture and can increase the intensity of extreme rainfall events.
“Australia has long been a continent of droughts and flooding rains; having said that, projections indicate that climate change will supercharge this variability,” Chiara Holgate, a researcher with the Australian National University.
Holgate said Australia needs to prepare for more intense flooding events, as floods are one of the most expensive disasters the country faces. Flooding in southeast Queensland and New South Wales in February and March cost about $3.35 billion in insured losses, according to the Insurance Council of Australia — making it the costliest flood in the country’s history.